Criteria in the Selection of Target Events for Planetary Microlensing Follow-Up Observations
Abstract
To provide criteria in the selection of target events preferable for planetary lensing follow-up observations, we investigate the variation of the probability of detecting planetary signals depending on the observables of the lensing magnification and source brightness. In estimating the probability, we consider variation of the photometric precision by using a quantity defined as the ratio of the fractional deviation of the planetary perturbation to the photometric precision. From this investigation, we find consistent result from previous studies that the probability increases with the increase of the magnification. The increase rate is boosted at a certain magnification at which perturbations caused by central caustic begin to occur. We find this boost occurs at moderate magnifications of , implying that probability can be high even for events with moderate magnifications. The probability increases as the source brightness increases. We find that the probability of events associated with stars brighter than clump giants is not negligible even at magnifications as low as . In the absence of rare the prime target of very high-magnification events, we, therefore, recommend to observe events with brightest source stars and highest magnifications among the alerted events. Due to the increase of the source size with the increase of the brightness, however, the probability rapidly drops off beyond a certain magnification, causing detections of low mass ratio planets () difficult from the observations of events involved with giant stars with magnifications .
Subject headings:
gravitational lensing – planets and satellites: general1. Introduction
With the advantages of being able to detect very low-mass planets and those with separations from host stars that cannot be covered by other methods, microlensing is one of the most important methods that can detect and characterize extrasolar planets (Mao & Paczyński, 1994; Gould & Loeb, 1992). The microlensing planetary signal is a short duration perturbation to the standard lensing light curve produced by the primary star. To achieve high monitoring frequency required for the detection of the short-lived planetary signal, current lensing experiments are employing early-warning system to issue alerts of ongoing events in the early stage of lensing magnification (Udalski et al., 1994; Bond et al., 2002) and follow-up observations to intensively monitor the alerted events (Dominik et al., 2002; Yoo et al., 2004). Under current surveys, there exist in average alerted events at a certain time (Dominik et al., 2002). Then, an important issue related to the follow-up observation is which event should be monitored for better chance of planet detections.
There have been several estimates of microlensing planet detection efficiencies (Bolatto & Falco, 1994; Bennett & Rhie, 1996; Gaudi & Sackett, 2000; Peale, 2001). Most of these works estimated the efficiency as a function of the instantaneous angular star-planet separation normalized by the angular Einstein radius, , and planet/star mass ratio, . However, the efficiency determined in this way is of little use in the point of view of observers who are actually carrying out follow-up observations of lensing events. This is because the planet parameters and are not known in the middle of lensing magnification and thus they cannot be used as criteria in the selection of target events for follow-up observations. Related to the target selection, Griest & Safizadeh (1998) proposed a useful criterion to observers. They pointed out that by focusing on very high-magnification () events, the probability of detecting planets in the lensing zone could be very high. However, these events are rare and thus they cannot be usually found in the list of alerted events. Therefore, it is necessary to have criteria applicable to general lensing events in the absence of very high-magnification events. To provide such criteria, we investigate the dependency of the probability of detecting planetary signals on the observables such as the lensing magnification and source type.
The paper is organized as follows. In § 2, we briefly describe the basics of planetary microlensing. In § 3, we investigate the variation of the probability of detecting planetary signals depending on the lensing magnification and source type for events caused by planetary systems with different masses and separations. We analyze the result and qualitatively explain the tendencies found from the investigation. Based on the result of the investigation, we then present criteria for the selection of target events preferable for follow-up observations. In § 4, we summarize the results and conclude.
2. Basics of Planetary Lensing
The lensing behavior of a planetary lens system is described by the formalism of a binary lens with a very low-mass companion. Because of the very small mass ratio, planetary a lensing light curve is well described by that of a single lens of the primary star for most of the event duration. However, a short-duration perturbation can occur when the source star passes the region around the caustics, that are the set of source positions at which the magnification of a point source becomes infinite. The caustics of binary lensing form a single or multiple sets of closed curves where each of which is composed of concave curves (fold caustics) that meet at points (cusps).
For a planetary case, there exist two sets of disconnected caustics: ‘central’ and ‘planetary’ caustics. The single central caustic is located close to the host star. It has a wedge shape with four cusps and its size (width along the star-planet axis) is related to the planet parameters by (Chung et al., 2005)
| (1) |
For a given mass ratio, a pair of central caustics with separations and are identical to the first order of approximation (Dominik, 1999; Griest & Safizadeh, 1998; An, 2005). The planetary caustic is located away from the host star. The center of the planetary caustic is located on the star-planet axis and the position vector to the center of the planetary caustic measured from the primary lens position is related to the lens-source separation vector, , by
| (2) |
Then, the planetary caustic is located on the planet side, i.e. , when , and on the opposite side, i.e. , when . When , there exists a single planetary caustic and it has a diamond shape with four cusps. When , there are two caustics and each caustic has a triangular shape with three cusps. The size of the planetary caustic is related to the planet parameters by
| (3) |
where , , and (Han, 2006). The planetary caustic is always bigger than the central caustic and the size ratio between the two types of caustics, , becomes smaller as the mass of the planet becomes smaller and the planet is located further away from the Einstein ring. The planetary caustic is located within the Einstein ring of the primary when the planet is located in the range of separation from the star of . The size of the caustic, which is directly proportional to the planet detection efficiency, is maximized when the planet is located in this range, and thus this range is called as the ‘lensing zone’. As the position of the planet approaches to the Einstein ring radius, , the location of the planetary caustic approaches the position of the central caustic. Then, the two types of caustic eventually merge together, forming a single large one.
3. Variation of Detectability
3.1. Quantification of Detectability
The quantity that has been often used in the previous estimation of the planet detection probability is the ‘fractional deviation’ of the planetary lensing light curve from that of the single lensing event of the primary, i.e.,
| (4) |
With this quantity, however, one cannot consider the variation of the photometric precision depending on the lensing magnification. In addition, it is difficult to consider the variation of the detectability depending on the source type.
To consider the effect of source star brightness and its lensing-induced variation on the planet detection probability, we carry out our analysis based on a new quantity defined as the ratio of the fractional deviation, , to the photometric precision, , i.e,
| (5) |
where and represent the fluxes from the source star and blended background stars, respectively. Here we assume that photometry is carried out by using the difference imaging method (Tomaney & Crotts, 1996; Alard, 1999). In this technique, photometry of the lensed source star is conducted on the subtracted image obtained by convolving two images taken at different times after geometrically and photometrically aligning them. Then the signal from the lensed star measured on the subtracted image is the flux variation of the lensed source star, , while the noise originates from both the source and background blended stars, . Under this definition of the planetary signal detectability, implies that the planetary signal is equivalent to the photometric precision. Hereafter we refer the quantity as the ‘detectability’.
3.2. Contour Maps of Detectability
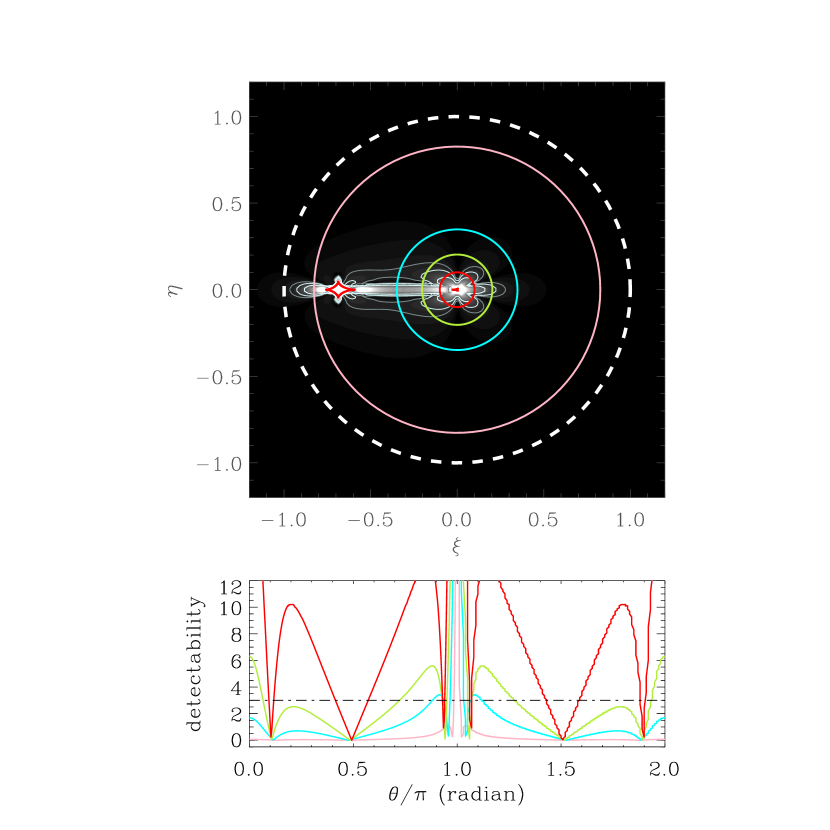
To see the variation of the detectability depending on the separation parameter , mass ratio , and the types of involved source star, we construct maps of detectability as a function of the position in the source plane. Figure 1 shows example maps. The individual sets of panels show the maps for events associated with different types of source stars. All lengths are normalized by the angular Einstein radius and and represent the coordinates parallel with and normal to the star-planet axis, respectively. A contours (yellow curve) is drawn at the level of . The maps are centered at the position of the primary lens star and the planet is located on the left. The dotted arc in each panel represents the Einstein ring of the primary star. The closed figures drawn by red curves represent the caustics.
For the construction of the maps, we assume a mass of the primary lens star of and distances to the lens and source of kpc and kpc, respectively. Then, the corresponding Einstein radius is AU. For the source stars, we test three different types of giant, clump giant, and main-sequence stars. The assumed -band absolute magnitudes of the individual types of stars are , 1.5, and 3.6, respectively. With the assumed amount of extinction toward the Galactic bulge field of , these correspond to the apparent magnitudes of , 17, and 19.1, respectively. As the source type changes, not only the brightness but also the size of the star changes. Source size affects the planetary signal in lensing light curves (Bennett & Rhie, 1996) and thus we take account the finite source effect into consideration. The assumed source radii of the individual types of source stars are 10.0 , 3.0 , and 1.1 , respectively. We assume that events are affected by blended flux equivalent to that of a star with . We note that the adopted lens and source parameters are the typical values of Galactic bulge events that are being detected by the current lensing surveys (Han & Gould, 2003).
For the observational condition, we assume that images are obtained by using 1 m telescopes, which are typical ones being used in current follow-up observations. We also assume that the photon acquisition rate of each telescope is 10 photons per second for an star and a combined image with a total exposure time of 5 minutes is obtained from each set of observations.
3.3. Probability of Detecting Planetary Signals
Based on the maps of detectability, we then investigate the probability of detecting planetary signals as a function of the lensing magnification. We define the probability as the average probability of detecting planetary signals with a detectability greater than a threshold value at the time of observation with a magnification . Geometrically, this probability corresponds to the portion of the arclet(s) where the detectability is greater than a threshold value out of a circle around the primary with a radius equal to the lens-source separation corresponding to the magnification at the time of observation. This is illustrated in Figure 2. We note that the magnification is a unique function of the absolute value of the lens-source separation 111Strictly speaking, the magnification depends additionally on the size of the source star., and thus corresponds to a circle around the lens. The lens-source separation is related to the magnification by
| (6) |
We set the threshold detectability as , i.e. detection of the planetary signal.
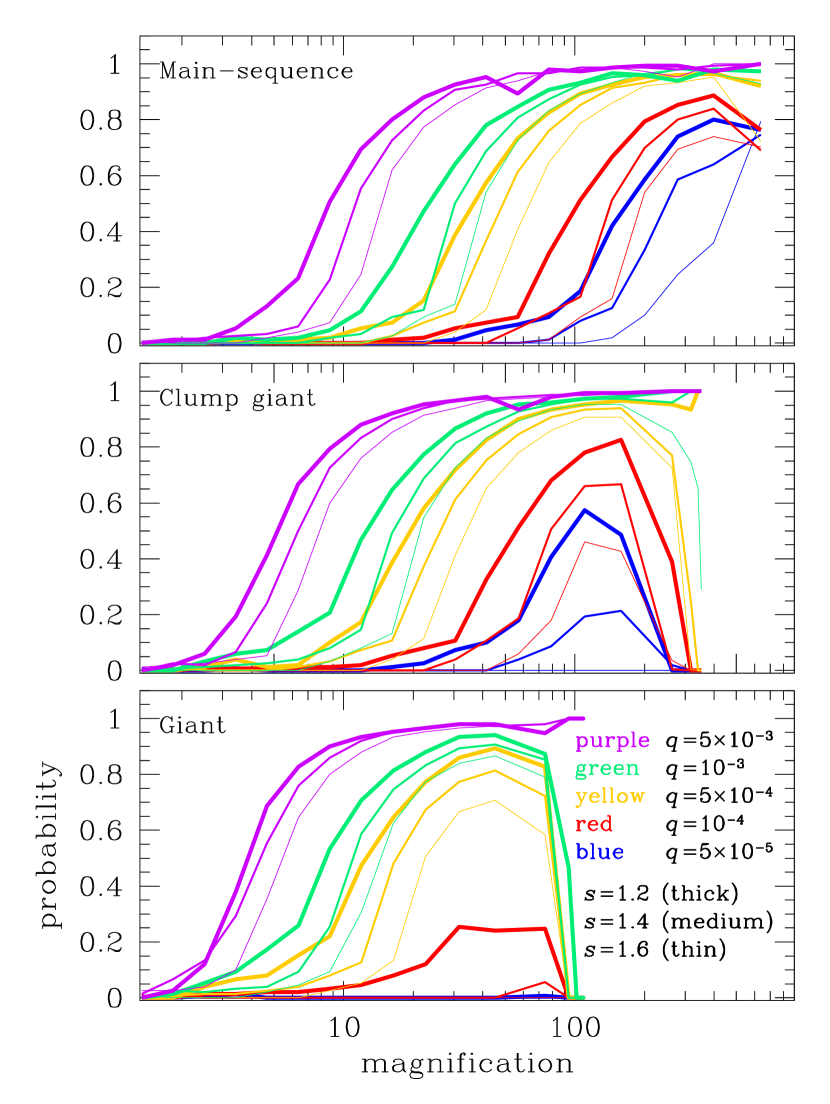
In Figure 3, we present the resulting probability as a function of magnification. The individual panels show the probabilities for events involved with different types of source stars. In each panel, we present the variations of the probability for planets with different mass ratios and separations. We test six different planetary separations of , 1/1.4, 1/1.2, 1.2, 1.4, and 1.6 as representative values for planets in the lensing zone. For the mass ratio, we test five values of , , , , and .
| source type | event type |
|---|---|
| giant | for planets with |
| clump giant | for planets with |
| main-sequence | for planets with |
Note. — Cases of planetary microlensing events where detection of planetary signal is limited by finite source effect. We note that “-” means the respective configuration cannot be realized.
| source | planetary | mass ratio | ||||
|---|---|---|---|---|---|---|
| type | separation | |||||
| , 1/1.2 | ||||||
| giant | , 1/1.4 | – | – | |||
| , 1/1.6 | – | – | ||||
| clump | , 1/1.2 | |||||
| giant | , 1/1.4 | |||||
| , 1/1.6 | – | |||||
| main | , 1/1.2 | |||||
| sequence | , 1/1.4 | |||||
| , 1/1.6 | ||||||
Note. — Critical magnifications at which transition from the regime of perturbations induced by planetary caustics into the one of perturbations induced by central caustics occur. We note that the critical magnifications are in many cases.
From the variation of the probability, we find the following tendencies. First, we find that the probability increases with the increase of the lensing magnification. This is consistent with the result of K. Horne (private communication). This tendency is due to three factors. First, the size of the planetary caustic increases as it is located closer to the primary star. This can be seen in Figure 4, where we present the relation between the location of the planetary caustic and its size, which is obtained by using equations (2) and (3). Then, higher chance of planetary perturbation is expected when the source is located closer to the primary during which the lensing magnification is high. Second, perturbation regions of the same size cover a larger range of angle as the planetary caustic moves closer to the lens. This also contributes to the higher probability. Third, the photometric precision improves with the increasing brightness of the source star due to lensing magnification. As the photometric precision improves, it is easier to detect small deviations induced by planets. The same reason can explain the considerable size of the perturbation region induced by central caustics. Perturbations induced by the central caustics occur at high magnifications during which the photometric precision is high. As a result, despite much smaller size of the central caustic than that of the planetary caustic, the central perturbation region is considerable and can even be comparable to the perturbation region induced by the planetary caustic. This can be seen in the detectability maps presented in Figure 1.

However, the probability does not continue to increase with the increase of the magnification. Instead, the probability drops off rapidly beyond a certain magnification. This critical value corresponds to the magnification at which finite-source effect begins to wash out the planetary signal. In Table 1, we present the cases where finite source effect limits planet detections. As a result, detections of planets with low mass ratios would be difficult for events involved with giant source stars with magnifications . We note that the finite source effect also limits the maximum magnifications of events and thus the curves in Figure 3 discontinue at a certain value.
Second, as the magnification increases, the probability of detecting planetary signal increases with two dramatically different rates of . We find that this abrupt change of occurs due to the transition from the regime of perturbations induced by planetary caustics into the one of perturbations induced by central caustics. The perturbation region induced by the central caustic forms around the primary lens and thus the probability becomes very high once the source star is in the central perturbation regime. The boost of the increase rate occurs at different magnifications depending on the planetary parameters and the types of involved source stars. The critical magnification becomes lower as the mass ratio of the planet increases and the separation of the planet approaches the Einstein ring radius. In Table 2, we present these critical magnifications. An important finding to be noted is that the critical magnification occurs at moderate magnifications of for a significant fraction of events caused by planetary systems with planets located in the lensing zone. This implies that probability of detecting planetary signal can be high even for events with moderate magnifications.
Third, the probability is higher for events involved with brighter source stars. This is because of the improved photometric precision with the increase of the source brightness. The difference in the probability depending on the source type is especially important at low magnifications. For example, the probabilities at a magnification of for events caused by a common planetary system with and but associated with different source stars of giant, clump giant, and main-sequence are , 10%, and 1%, respectively. In the absence of high magnification events, therefore, the second prime candidate event for follow-up observation is the one involved with brightest source star. As the magnification further increases and once the source star enters the central perturbation region, the difference becomes less important.
4. Summary and Conclusion
For the purpose of providing useful criteria in the selection of target events preferable for planetary lensing follow-up observations, we investigated the variation of the probability of detecting planetary lensing signals depending on the observables of the lensing magnification and source brightness. From this investigation, we found consistent result from previous studies that the probability increases with the increase of the lensing magnification due to the improvement of the photometric precision combined with the expansion of the perturbation region. The increase rate of the probability is boosted at a certain magnification at which perturbation caused by the central caustic begins to occur. We found that this boost occurs at moderate magnifications of for a significant fraction of events caused by planetary systems with planets located in the lensing zone, implying that probabilities can be high even for events with moderate magnifications. The probability increases with the increase of the source star brightness. We found that the probability of events associated with source stars brighter than clump giants is not negligible even at magnifications as low as . In the absence of rare prime target of very high-magnification events (), we, therefore, recommend to observe events with brightest source stars and highest magnifications among the alerted events. Due to the increase of the source size with the increase of the brightness, however, the probability rapidly drops off beyond a certain magnification. As a result, detections of planets with low mass ratios () would be difficult for events involved with giant source stars with magnifications .
References
- Alard (1999) Alard, C. 1999, A&A, 343, 10
- An (2005) An, J. H. 2005, MNRAS, 356, 1409
- Bennett & Rhie (1996) Bennett, D. P., & Rhie, S. H. 1996, ApJ, 472, 660
- Bolatto & Falco (1994) Bolatto, D. B., & Falco, E. E. 1994, ApJ, 436, 112
- Bond et al. (2002) Bond, I., et al. 2002, MNRAS, 331, L19
- Chung et al. (2005) Chung, S. J., et al. 2005, ApJ, 630, 535
- Dominik (1999) Dominik, M. 1999, A&A, 349, 108
- Dominik et al. (2002) Dominik, M., et al. 2002, Planetary and Space Science, 50, 299
- Gould & Loeb (1992) Gould, A., & Loeb, A. 1992, ApJ, 396, 104
- Griest & Safizadeh (1998) Griest, K., & Safizadeh, N. 1998, ApJ, 500, 37
- Gaudi & Sackett (2000) Gaudi, B. S., & Sackett, P. D. 2000, ApJ, 532, 340
- Han (2006) Han, C. 2006, ApJ, 638, 1080
- Han & Gould (2003) Han, C., & Gould, A. 2003, ApJ, 592, 172
- Mao & Paczyński (1994) Mao, S., & Paczyński, B. 1991, ApJ, 374, L37
- Peale (2001) Peale, S. J. 2001, ApJ, 552, 889
- Tomaney & Crotts (1996) Tomaney, A. B., & Crotts, A. P. S. 1996, AJ, 112, 2872
- Udalski et al. (1994) Udalski, A., Szymański, M., Kałużny, J., Kubiak, M., Mateo, M., Krzemiński, W., & Paczyński, B. 1994, 44, 227
- Yoo et al. (2004) Yoo, J., et al. 2004, ApJ, 616, 1204