9.7 m Silicate Absorption in A Damped Lyman- Absorber at
Abstract
We report a detection of the 9.7 m silicate absorption feature in a damped Lyman- (DLA) system at toward AO0235+164, using the Infrared Spectrograph (IRS) onboard the Spitzer Space Telescope. The feature shows a broad shallow profile over 8-12 m in the absorber rest frame and appears to be significant in equivalent width. The feature is fit reasonably well by the silicate absorption profiles for laboratory amorphous olivine or diffuse Galactic interstellar clouds. To our knowledge, this is the first indication of 9.7 m silicate absorption in a DLA. We discuss potential implications of this finding for the nature of the dust in quasar absorbers. Although the feature is relatively shallow (), it is times deeper than expected from extrapolation of the vs. relation known for diffuse Galactic interstellar clouds. Further studies of the 9.7 m silicate feature in quasar absorbers will open a new window on the dust in distant galaxies.
Subject headings:
Quasars: absorption lines–ISM:dust1. Introduction
Damped Lyman-alpha (DLA) absorption systems in quasar spectra dominate the neutral gas content in galaxies and offer venues for studying the evolution of metals and dust in galaxies. Recent observations, however, suggest that the majority of DLAs have low metallcities at all redshifts studied (), with the mean metallicity reaching at most solar at the lowest redshifts (see, e.g., Prochaska et al. 2003; Kulkarni et al. 2005, 2007; Péroux et al. 2006; and references therein). These results appear to contradict the predictions of a near-solar global mean interstellar metallicity of galaxies at in most chemical evolution models based on the cosmic star formation history inferred from galaxy imaging surveys such as the Hubble Deep Field (HDF) (e.g., Madau et al. 1996). Furthermore, for a large fraction of the DLAs, the SFRs inferred from emission-line imaging searches fall far below the global predictions (e.g., Kulkarni et al. 2006, and references therein).
A possible explanation of these puzzles is that the current DLA samples are biased due to dust selection effects, i.e. that the more dusty and more metal-rich absorbers obscure the background quasars more, making them harder to observe (e.g., Fall & Pei 1993; Boissé et al. 1998; Vladilo & Péroux 2005). DLAs are known to have some dust, based on both the (generally mild) depletions of refractory elements and the (typically slight) reddening of the background quasars (e.g., Pei et al. 1991; Pettini et al. 1997; Kulkarni et al. 1997). Combining quasar spectra from the Sloan Digital Sky Survey (SDSS), York et al. (2006b) found a small but significant amount of dust in absorbers at , with of 0.02-0.09 for 9 of their 27 sub-samples (see also Khare et al. 2007). York et al. (2006b) also showed that the extinction in the composite spectra is best fitted by a Small Magellanic Cloud (SMC) curve (with no 2175 Å bump). Some recent studies suggest that dusty DLAs could hide as much as of the total metal content at , and more at lower (Bouché et al. 2005). To understand whether this is the case, and to understand the role of dust in quasar absorbers in general, it is essential to directly probe the basic properties of the dust.
Recently, a small number of very dusty quasar absorbers have been discovered, via various signatures of the dust in optical and UV observations: substantial reddening of the background quasars, large element depletions (e.g., for Cr, Fe), and/or a detectable 2175 Å bump (e.g., Junkkarinen et al. 2004; Wang et al. 2004). It is not yet clear, however, whether the dust in these systems is similar to that in the Milky Way or SMC or LMC.
The 2175 Å bump is generally, though not conclusively, attributed to carbonaceous grains. The silicate component of the dust, believed to comprise of the core mass of interstellar dust grains in the Milky Way (see, e.g., Draine 2003) has not yet been probed in quasar absorbers. A unique opportunity to study this important dust component is provided by the Spitzer IRS (Werner et al. 2004; Houck et al. 2004), which provides the spectral coverage, sensitivity, and resolution needed for the detection of the strongest of the silicate spectral features near 9.7 m. The 9.7 m feature, thought to arise in Si-O stretching vibrations, is seen in a wide range of Galactic and extragalactic environments (e.g., Whittet 1987 and references therein; Spoon et al. 2006; Imanishi et al. 2007). We have been carrying out an exploratory study of the silicate dust in quasar absorbers by searching for the 9.7 m absorption feature with the Spitzer IRS. Here we report on the detection of the 9.7 m feature in one of the systems studied, while the remaining three systems observed recently will be reported in a separate paper (Kulkarni et al. 2007b, in preparation).
2. Observations and Data Analysis
The DLA at (Junkkarinen et al. 2004) toward the blazar AO 0235+164 () offers an excellent venue for comparing dust in a distant galaxy with that in near-by galaxies. It has one of the largest H I column densities seen in DLAs (log ) and shows 21-cm absorption (Roberts et al. 1976). It also shows X-ray absorption, consistent with a metallicity of 0.7 solar (Junkkarinen et al. 2004). Candidate absorber galaxies (much fainter than the blazar) within a few arcseconds from the blazar sightline have been detected (e.g., Smith et al. 1977; Yanny et al. 1989; Chun et al. 2006). This absorber is one of a very few DLAs producing appreciable reddening [ = 0.23 in the absorber rest frame] and detection of a strong broad 2175 Å extinction bump (Junkkarinen et al. 2004). Finally, this absorber is the only DLA with detections of several diffuse interstellar bands (Junkkarinen et al. 2004; York et al. 2006a). All of these data suggest that this absorber is very dusty and may contain molecular gas.
The observations were obtained with the Spitzer IRS on January 30, 2006 (UT) as GO program 20757 (PI V. P. Kulkarni). IRS modules Short-Low 1 (SL1) and Long-Low 2 (LL2) were used to cover 7.5-21.4 m in the observed frame (4.9-14.1 m in the DLA rest frame). The target was acquired with high-accuracy peakup using a near-by bright star. The IRS standard staring mode was used, with 2-pixel slit widths of 3.6” for SL1 and 10.5” for LL2. Integration times were 60 s cycles for SL1 and 120 s cycles for LL2. For each cycle, observations were performed at both nod positions A and B (offset by 1/3 the slit length), so the total integration times were 960 s and 2640 s, respectively, for SL1 and LL2.
The data were processed using the IRS S15.0 calibration pipeline (the latest version available at present), Image Reduction and Analysis Facility (IRAF111IRAF is distributed by the National Optical Astronomy Observatories, which are operated by the Association of Universities for Research in Astronomy, Inc. (AURA), under cooperative agreement with the National Science Foundation), and Interactive Data Language (IDL). As detailed below, the S15.0 pipeline yielded significant improvements for the reliable detection and measurement of weak, broad features in our spectra. The pipeline performs a number of standard processing steps to produce the basic calibrated data (BCD) files (see, e.g., the IRS Data Handbook at http://ssc.spitzer.caltech.edu/irs/dh). Subtraction of the sky (mostly zodiacal light) was performed by subtracting the coadded frames at nod position B from those at nod position A, and vice versa. The 1-dimentional spectra were extracted from the 2-dimensional images using the Spitzer IRS Custom Extraction (SPICE) software using the default extraction windows, and flux calibrated using the standard S15.0 flux calibration files. The spectra from the two nod positions were averaged together, and the corresponding flux uncertainties calculated using both measurement uncertainties and “sampling uncertainties” between the two nod positions.
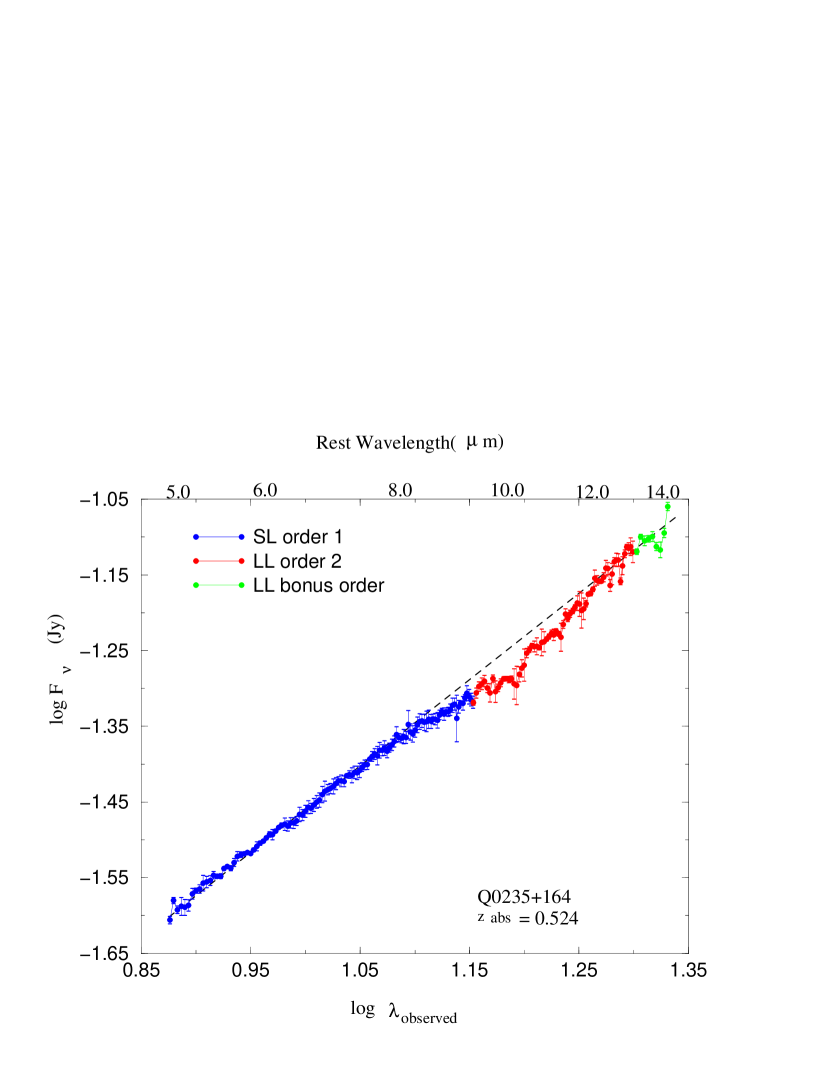
The absolute flux levels in the different IRS modules were scaled to match the continuum levels in the overlapping regions, using the bonus segment available in the LL2 images. There was no mismatch between the SL1 and LL2 flux levels; we used the SL1 data for m and LL2 data for m. The data at m bonus segment level had to be scaled up by to match with the LL2 data at m. Fig. 1(a) shows the final merged spectrum of AO0235+164. The S/N achieved per unbinned pixel in the final spectrum, determined from rms fluctuations in the continuum regions, is . The error bars denote 1 uncertainties.
The dashed line in Fig. 1(a) shows an estimate of the power-law continuum of the quasar. This line joins the observed continuum fluxes at 5.6 and 7.1 m in the absorber rest frame and is extrapolated to the remaining wavelength region. These wavelengths are chosen to be in regions free of any other potential emission or absorption features (e.g., Imanishi et al. 2007). In principle, significant 9.7 m emission at the quasar redshift could affect continuum determination redward of the suspected silicate absorption feature from the DLA. However, (a) our spectrum does not extend that far to the red, (b) the power law provides a good fit to the continuum in our data, and (c) the 9.7 m emission is not particularly strong in most quasars (e.g., Hao et al. 2007).
3. Results
The spectrum shown in Fig. 1(a) exhibits a broad absorption feature between about 12.4 and 18.3 m relative to the power law continuum. The flux decline from the continuum begins near the long wavelength end of SL1 and continues smoothly into the LL2 data. The broad feature is centered at 15.41 m (10.11 m in the DLA rest frame). The observed frame equivalent width is m, with a 1 uncertainty of 0.014-0.020 m, including contributions from photon noise and continuum fitting uncertainties (Sembach & Savage 1992).
We have performed several checks of our data analysis to see whether the observed broad feature could be an artifact. Since the possible silicate feature is broad and shallow, extending from the long wavelength end of SL1 through most of LL2, flux calibration and continuum fitting are critical issues. In the S14 pipeline version of these data, the possible silicate feature was somewhat stronger than in the S15 version. These differences are due to a low-level non-linearity problem in the S14 pipeline, which produces a tilt in LL2 spectra and a mismatch at the SL1/LL2 boundary. This problem has been eliminated in the S15 pipeline, and we find no mismatch at the SL1/LL2 boundary in the S15 data.
The possible silicate feature does not show any visible signature of the “teardrop” feature known to exist near 14.1 m in some SL1 data (see, e.g., the IRS data handbook). The beginning of decline in flux at the long-wavelength end of SL1 matches smoothly with the flux at the short-wavelength end of LL2 (which does not suffer from the teardrop problem). Our results do not change much even if the SL1 data are truncated at 14 m to avoid the region potentially affected by the teardrop (the region 14-14.23 m is a small fraction of the whole feature stretching out to 18.3 m in the observed frame).
Inaccuracies in pointing (which can affect SL1 and LL2 fluxes at the level) also do not appear to be significant for our data. Based on an examination of the spectral images and the pointing difference keywords in the data file headers, the telescope pointing was accurate to within 0.09-0.11” for LL2 and within 0.22-0.29” for SL1. Integrating a Gaussian intensity distribution from a point source with the Spitzer point spread function over the known slit dimensions ( for SL1, for LL2), we estimate that the effect of such an offset would be about for SL1 and for LL2, far too small to account for the observed feature.
We also compared our results with IRS spectra from the literature for quasars without strong absorption systems (e.g., Sturm et al. 2006; Hao et al. 2007), and did not find the broad absorption feature from our data in those other quasars. In fact, quasar spectra in general show no silicate absorption, but rather (generally relatively weak) silicate emission at the quasar emission redshift. We also compared our IRS data for AO0235+164 with those for other targets in our study. The feature seen in AO0235+164 is not seen at the same observed wavelength in the other objects, suggesting that it is not an instrumental artifact. [In fact, in Kulkarni et al. 2007b (in prep.), we will report the possible detection of redshifted broad 9.7 m silicate absorption in other parts of the Spitzer spectral coverage toward other quasars.]
Given the results of the above tests and the fact that the DLA toward AO0235+164 is already known to be dusty (from detection of 2175 Å bump and diffuse interstellar bands and reddening of the background quasar), it seems very likely that the feature detected is the broad 9.7 m silicate feature arising in the absorber galaxy.
4. Discussion
The suggested silicate feature in the DLA toward AO0235+164 is relatively shallow/weak compared to the silicate features typically observed in Galactic interstellar material (ISM) because of the modest reddening and lower amounts of dust in quasar absorbers than in the Milky Way. Indeed, the dust-to-gas ratio in the DLA toward AO0235+164 is estimated to be 0.19 times the Galactic value (Junkkarinen et al. 2004). On the other hand, the observed feature is stronger than expected from for this absorber (Junkkarinen et al. 2004). In Galactic diffuse interstellar clouds, the peak optical depth in the 9.7 m silicate feature () is observed to correlate with the reddening along the line of sight, with (e.g., Whittet 1987). Extrapolating this relation, and assuming , one would expect for the DLA in AO0235+164. Our observations, however, indicate for this DLA, times higher than expected from the relation for Galactic diffuse ISM. The dust in this absorber may thus be somewhat richer in silicates than typical Galactic dust. We note, however, that the silicate feature is also known to be stronger in the Galactic Center region, perhaps due to fewer carbon stars (and thus less carbonaceous dust) there (e.g., Roche & Aitken 1985). If future observations of other DLAs also reveal material richer in silicates, it might indicate that those DLAs probe denser regions near the centers of the respective galaxies.
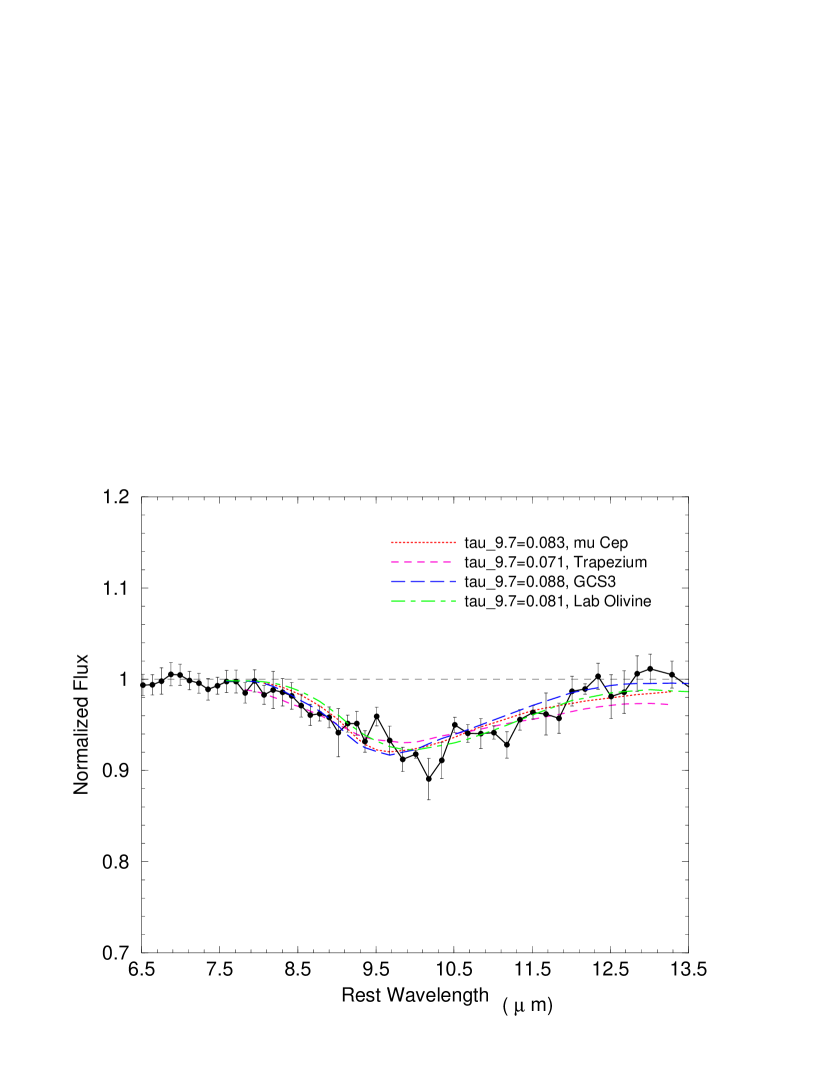
The Galactic interstellar 9.7 m feature is generally broad and relatively featureless, which is taken as an indication that interstellar silicates are largely amorphous. (Crystalline silicates would produce structure within the broad feature.) In principle, silicate grains may be composed of a mixture of pyroxene-like [(MgxFe1-x)SiO3] and olivine-like [(MgxFe1-x)2SiO4] silicates, with the shape and central wavelength of the 9.7 m absorption somewhat dependent on the exact composition (e.g., Kemper et al. 2004; Chiar & Tielens 2006). Fig. 1(b) shows a closer view of the data, normalized by the power law continuum shown in Fig. 1(a), and binned by a factor of 3. The dotted and short-dashed curves are fits based on silicate emissivities derived from observations of the M supergiant Cep and of the Orion Trapezium region (e.g., Roche & Aitken 1984; Hanner et al. 1995), which are taken to be representative of diffuse Galactic ISM and denser molecular material, respectively . The long-dashed and dot-dashed curves are fits based on the silicate absorption profile observed toward the Galactic Center Source GCS3, and on laboratory measurements for amorphous olivine (Spoon et al. 2006). The shape of the silicate profile observed toward AO 0235+164 is most similar to that of laboratory amorphous olivine, but the -Cep and GCS3 templates also yield reasonable fits. The DLA silicate profile does not exhibit the redward extension seen for the Trapezium profile, suggesting that the DLA dust resembles dust in diffuse Galactic clouds more than that in molecular clouds. Using minimization for 8.0-13.3 m in the DLA rest frame, the peak optical depth values for the laboratory olivine, GCS3, Cep, and Trapezium templates are , , , and , respectively for the binned data (, , , and , respectively, for the unbinned data). The error bars on correspond to optical depths that give reduced larger by 1.0 than the minimum values. The respective reduced values are 1.22, 1.32, 1.51, and 1.92 for the binned data (1.82, 2.08, 2.10, and 2.65 for the unbinned data). It is interesting to note that the best-fit astronomical template is GCS3, consistent with the enhanced ratio seen in the DLA as toward the Galactic center. While the minimum reduced values are greater than 1.0, they are similar to those found in other studies of the silicate absorption toward both Galactic and extragalactic sources (e.g., Hanner et al. 1995; Bowey et al. 1998; Roche et al. 2006, 2007). Indeed, we do not expect a perfect fit, since possible differences in dust grain size and chemical composition can alter the shape of the silicate feature, including the peak wavelength and the FWHM (Bowey et al. 1998 and references therein). Higher S/N and higher resolution data would be needed to shed further light on the specific types of silicates present in DLAs.
With a larger absorber sample, it would be possible to explore correlations between the strengths of the 9.7 m silicate feature and the 2175 Å extinction bump (which is thought to be produced by a carbonaceous component of the dust). For example, it would be interesting to understand whether the relative amounts of silicate and carbonaceous dust vary with redshift or with the gas-phase abundances of C or Si. High-S/N observations of other possible features (e.g., the 18.5 m silicate feature or the 3.0 m H2O ice feature) would provide additional constraints on dust composition. (While those features are generally weaker than the 9.7 m feature in the Milky Way, the 3.0 m feature can be stronger than the 9.7 m feature in highly reddened molecular sightlines.)
Our exploratory study has demonstrated the potential of the Spitzer IRS to study dust in quasar absorbers. It would be very interesting to obtain similar spectra for other dusty quasar absorbers. The values for dusty absorbers such as that reported here (0.23) are much larger than those for typical Mg II absorbers [ of 0.002; York et al. 2006b]. These relatively large reddening values are comparable to some of those for Ly-break galaxies (LBGs), which show up to 0.4 and a median of at and (Shapley et al. 2001, 2005; Papovich et al. 2001). Such dusty absorbers appear to be chemically more evolved (Wild et al. 2006) than typical DLAs, and may possibly provide a link in terms of SFRs, masses, metallicities, and dust content between the primarily metal-poor and dust-poor general DLA population with low SFRs and the actively star-forming, metal-rich, and dust-rich LBGs. Further Spitzer IRS observations of more dusty quasar absorbers thus will help to open a new window on this interesting class of distant galaxies.
References
- Boisse (98) Boissé, P., Le Brun, V., Bergeron, J., & Deharveng, J.-M. 1998, A&A, 333, 841
- Bouche (05) Bouché, N., Lehnert, M. D., & Péroux, C. 2005, MNRAS, 364, 319
- Bowey (98) Bowey, J. E., Adamson, A. J., & Whittet, D. C. B. 1998, MNRAS, 298, 131
- CT (06) Chiar, J. E., & Tielens, A. G. G. M. 2006, ApJ, 637, 774
- Chun (06) Chun, M. R. et al. 2006, AJ, 131, 686
- Draine (03) Draine, B. T. 2003, ARAA, 41, 241
- FP (93) Fall, S. M., & Pei, Y. C. 1993, ApJ, 402, 479
- Hao (07) Hao, L., Weedman, D. W., Spoon, H. W. W., Marshall, J. A., Levenson, N., Elitzur, M., & Houck, J. R. 2007, ApJ, 655, L77
- Hanner (95) Hanner, M. S., Brooke, T. Y., & Tokunaga, A. T. 1995, ApJ, 438, 250
- Houck (04) Houck, J. R. et al. 2004, ApJS, 154, 18
- Imanishi (07) Imanishi, M., Dudley, C. C., Maiolino, R., Maloney, P. R., Nakagawa, T., & Risaliti, G. 2007, ApJ, in press
- Junkk (04) Junkkarinen, V. T., Cohen, R. D., Beaver, E. A., Burbidge, E. M., Lyons, R. W., & Madejski, G. 2004, ApJ, 614, 658
- Kemp (04) Kemper, F., Vriend, W. J., & Tielens, A. G. G. M. 2004, ApJ, 609, 826 (erratum 633, 534 [2005])
- Kh (07) Khare, P., Kulkarni, V. P., Péroux, C., York, D. G., Lauroesch, J. T., & Meiring, J. D. 2007, A&A, 464, 487
- KFT (97) Kulkarni, V. P., Fall, S. M. & Truran, J. W. 1997, ApJ, 484, L7
- K (05) Kulkarni, V. P., Fall, S. M., Lauroesch, J. T., York, D. G., Welty, D. E., Khare, P., & Truran, J. W. 2005, ApJ, 618, 68
- K (06) Kulkarni, V. P., Woodgate, B. E., York, D. G., Thatte, D. G., Meiring, J., Palunas, P., & Wassell, E. 2006, ApJ, 636, 30
- Kh (07) Kulkarni, V. P., Khare, P., Péroux, C., York, D. G., Lauroesch, J. T., & Meiring, J. D. 2007, ApJ, in press (astro-ph/0608126)
- Madau (96) Madau, P., Ferguson, H. C., Dickinson, M. E., Giavalisco, M., Steidel, C. C., & Fruchter, A. 1996, MNRAS, 283, 1388
- Papo (01) Papovich et al. 2001, ApJ, 559, 620
- PFB (91) Pei, Y. C., Fall, S. M., & Bechtold, J. 1991, ApJ, 378, 6
- Peroux (06) Péroux, C., Kulkarni, V. P., Meiring, J., Ferlet, R., Khare, P., Lauroesch, J., Vladilo, G., & York, D. G. 2006, A&A 450, 53
- Pet (97) Pettini, M. Smith, L. J., King, D. L., & Hunstead, R. W. 1997, ApJ, 486, 665
- Pro (03) Prochaska, J. X., Gawiser, E., Wolfe, A. M., Cooke, J., & Gelino, D. 2003, ApJS, 147, 227
- Rob (76) Roberts, M. S. et al. 1976, AJ, 81, 293
- RA (84) Roche, P. F., & Aitken, D. K. 1984, MNRAS, 208, 481
- RA (85) Roche, P. F., & Aitken, D. K. 1985, MNRAS, 215, 425
- Roche (06) Roche, P. F., Packham, C., Aitken, D. K., & Mason, R. E. 2007, MNRAS, 375, 99
- Roche (07) Roche, P. F., Packham, C., Telesco, C. M., Radomski, J. T., Alonso-Herroro, A., Aitken, D. K., Colina, L., & Perlman, E. 2006, MNRAS, 367, 1689
- SS (92) Sembach, K. R., & Savage, B. D. 1992, ApJS, 83, 147
- Shap (01) Shapley, A. et al. 2001, ApJ, 562, 95
- Shap (05) Shapley, A. E., Steidel, C. C., Erb, D. K., Reddy, N. A., Adelberger, K. L., Pettini, M., Barmby, P., & Huang, J. 2005, ApJ, 626, 698
- Sm (77) Smith, H. E. et al. 1977, ApJ, 218, 611
- Spoon (06) Spoon, H. W. W. et al. 2006, ApJ, 638, 759
- Sturm (06) Sturm, E., Hasinger, G., Lehmann, I., Mainieri, V., Genzel, R., Lehnert, M. D., Lutz, D., & Tacconi, L. J. 2006, ApJ, 642, 81
- VP (05) Vladilo, G., & Péroux, C. 2005, , A&A, 444, 461
- Wang (04) Wang, J., Hall, P. B., Ge, J., Li, A., & Schneider, D. P. 2004, ApJ, 609, 589
- Werner (04) Werner, M. W. et al. 2004, ApJS, 154, 1
- Whit (87) Whittet, D. C. B. 1987, QJRAS, 28, 303
- Whit (88) Whittet, D. C. B., Bode, M. F., Longmore, A. J., Adamson, A. J., McFadzean, A. D., Aitken, D. K., & Roche, P. F. 1988, 233, 321
- Wild (05) Wild, V., & Hewett, P. C. 2005, MNRAS, 361, L30
- Wild (06) Wild, V., Hewett, P. C., & Pettini, M. 2006, MNRAS, 367, 211
- Yanny (89) Yanny, B., York, D. G., & Gallagher, J. S. 1989, ApJ, 338, 735
- YorkB (06) York, B. A., Ellison, S. L., Lawton, B., Churchill, C. W., Snow, T. P., Johnson, R. A., & Ryan, S. G. 2006a, ApJ, 647, L29
- YorkD (06) York, D. G. et al. 2006b, MNRAS, 367, 945