PAH emission and star formation in the host of the z2.56 Cloverleaf QSO
Abstract
We report the first detection of the 6.2m and 7.7m infrared ‘PAH’ emission features in the spectrum of a high redshift QSO, from the Spitzer-IRS spectrum of the Cloverleaf lensed QSO (H1413+117, z2.56). The ratio of PAH features and rest frame far-infrared emission is the same as in lower luminosity star forming ultraluminous infrared galaxies and in local PG QSOs, supporting a predominantly starburst nature of the Cloverleaf’s huge far-infrared luminosity (L⊙, corrected for lensing). The Cloverleaf’s period of dominant QSO activity (LL⊙) is coincident with an intense (star formation rate M⊙yr-1) and short (gas exhaustion time yr) star forming event.
1 Introduction
Redshifts 2.5 witness both the ‘quasar epoch’ with peak number density of luminous accreting black holes (e.g. Schmidt et al., 1995) and the peak in number of the most intense star forming events as traced by the submillimeter galaxy population (Chapman et al., 2005), suggestive of a relation of the two phenomena. Detailed evolutionary connections between massive starbursts and QSOs have been discussed for many years (e.g. Sanders et al., 1988; Norman & Scoville, 1988) and form an integral part of some recent models of galaxy and merger evolution (e.g. Granato et al., 2004; Springel et al., 2005; Hopkins et al., 2006). Phases of intense star formation coincident with the active phase of the quasars are a natural postulate of such models but have been exceedingly difficult to confirm and quantify due to the effects of the powerful AGN outshining tracers of star formation at most wavelengths.
Perhaps the strongest constraint on the potential significance of star formation in QSOs comes from the far-infrared part of their spectral energy distribution (SED). Indeed, this far-infrared emission has been interpreted as due to star formation (e.g. Rowan-Robinson, 1995), but alternative models successfully ascribe it to AGN heated dust, by postulating a dust distribution in which relatively cold dust at large distance from the AGN has a significant covering factor, for example in a warped disk configuration (Sanders et al., 1989). Additional diagnostics are needed to break this degeneracy.
CO surveys of local QSOs (e.g. Evans et al., 2001; Scoville et al., 2003; Evans et al., 2006) have produced a significant number of detections of molecular gas reservoirs that might power star formation. Depending on the adopted ‘star formation efficiency’ SFE=LFIR/LCO the detected gas masses may be sufficient or not for ascribing the QSO far-infrared emission to star formation. Optical studies have identified significant ‘post-starburst’ stellar populations in QSOs (Canalizo & Stockton, 2001; Kauffmann et al., 2003). On the other hand, Ho (2005) suggested low star formation in QSOs, perhaps actively inhibited by the AGN, on the basis of observations of the [OII] 3727Å line. We have used the much less extinction sensitive mid-infrared PAH emission features to infer that in a sample of local (PG) QSOs, star formation is sufficient to power the observed far-infrared emission (Schweitzer et al., 2006).
The observational situation remains complex for high redshift QSOs. Metallicity studies of the broad-line region suggest significant enrichment by star formation (e.g. Hamann & Ferland, 1999; Shemmer et al., 2004) but may not be representative for the host as a whole. Submm and mm studies of luminous radio quiet QSOs have produced significant individual detections of dust emission of some QSOs, as well as statistical detection of the entire population (e.g. Omont et al., 2003; Priddey et al., 2003; Barvainis & Ivison, 2002). These suggest potential starburst luminosities up to and exceeding 1013L⊙. CO studies have detected large gas reservoirs in many high-z QSOs (see summaries in Solomon & Vanden Bout, 2005; Greve et al., 2005). Emission from high density molecular gas tracers has been detected in some of the brightest systems (Barvainis et al., 1997; Solomon et al., 2003; Carilli et al., 2005; Riechers et al., 2006; García-Burillo et al., 2006; Guélin et al., 2007) and may well originate in dense high pressure star forming regions, but AGN effects on chemistry and molecular line excitation could also play a role (e.g. Maloney et al., 1996). Finally, the [CII] 157m rest wavelength fine structure line was detected in the z=6.42 quasar SDSS J114816.64+525150.3 (Maiolino et al., 2005) at a ratio to the rest frame far-infrared emission similar to the ratio in local ULIRGs, consistent with massive star formation.
We have initiated a program extending the use of mid-infrared PAH emission as star formation tracer to high redshift QSOs. In this Letter, we use Spitzer mid-infrared spectra to detect and quantify star formation in one of the brightest and best studied z2.5 QSOs, the lensed Cloverleaf (H1413+117, Hazard et al., 1984; Magain et al., 1988). We adopt , and km s-1 Mpc-1.
2 Observations and Results
We obtained low resolution (R) mid-infrared spectra of the Cloverleaf QSO using the Spitzer infrared spectrograph IRS (Houck et al., 2004) in staring mode on July 24, 2006, at J2000 target position RA 14h15m46.27s, DEC +11d29m43.40s. The IRS aperture includes all lensed images. 30 cycles of 120sec integration time per nod position were taken in the LL1 (19.5 to 38.0 m) and 15 cycles in the LL2 (14.0 to 21.3 m) module, leading to effective on-source integration times of 2 and 1 hours, respectively. We use the pipeline 14.4.0 processed basic calibrated data, own deglitching and coaddition procedures, and SMART (Higdon et al., 2004) for extraction. When combining the two orders into the final spectrum, we scaled the LL2 spectrum by a factor 1.02 for best match in the overlapping region.
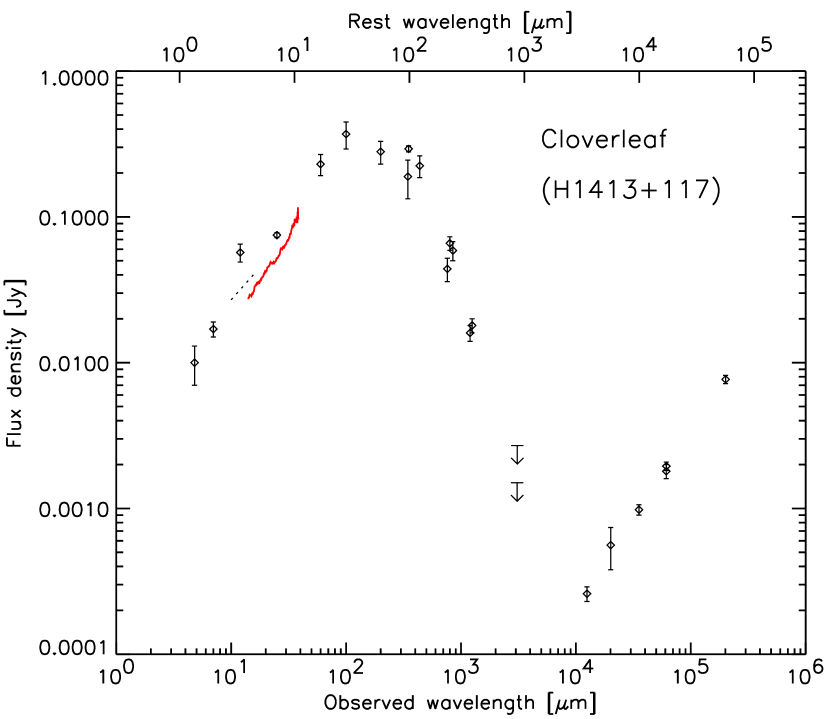
Fig. 1 shows the IRS spectrum embedded into the infrared to radio SED of the Cloverleaf, and Fig. 2 the IRS spectrum proper, together with the location of key features in the corresponding rest wavelength range. The rest frame mid-infrared emission is dominated by a strong continuum, approximately flat in Fν, due to dust heated by the powerful active nucleus to temperatures well above those reached in star forming regions. Superposed on this continuum are emission features, which we identify with the 6.2m and 7.7m aromatic ‘PAH’ emission features normally detected in star-forming galaxies over a very wide range of properties. As expected for a Type 1 AGN, there are no indications for the ice (6m) or silicate (9.6m) absorptions seen in heavily obscured galaxies. None of the well-known emission lines in this wavelength range is bright enough to be significantly detected in this low resolution spectrum, although we cannot exclude a contribution of [Ne VI] 7.64m to the 7.7m feature. Adopting standard mid-infrared low resolution diagnostics (Genzel et al., 1998; Laurent et al., 2000), the weak PAH features on top of a strong continuum agree with the notion that the Cloverleaf is energetically dominated by its AGN. The detection of PAH features with several mJy peak flux density in a z2.6 galaxy, however, implies intense star formation, which we discuss in conjunction with other properties of the Cloverleaf.
By fitting a Lorentzian superposed on a local polynomial continuum, we measure a flux of 1.52W cm-2 for the 6.2m feature, with a S/N of 6. The 7.7m feature is more difficult to quantify. Schweitzer et al. (2006) have discussed PAHs as star formation indicators in local (PG) QSOs, PAHs are also detected in the average QSO spectrum of Hao et al. (2007). The AGN continuum of those QSOs shows superposed silicate emission features at m (see also Siebenmorgen et al., 2005; Hao et al., 2005). If PAH emission is additionally present, the PAH features partly ‘fill in’ the minimum in the AGN emission before the onset of the silicate feature (see Fig. 2 of Schweitzer et al. (2006)), causing a seemingly flat overall spectrum. In reality, there is simultaneous presence of AGN continuum, the 6.2-8.6m PAH complex, silicate emission, and more PAH emission at longer wavelengths. From inspection of Fig. 2, a similar co-presence of PAH and silicate emission is observed for the Cloverleaf. We note that the presence of silicate emission in the luminous Cloverleaf Type 1 QSO, other high z Type 1 QSOs (Maiolino et al., in prep) as well as in luminous Type 2 QSOs (Sturm et al., 2006; Teplitz et al., 2006) has implications for the location of this cool silicate component (200K, Hao et al., 2005) in unified AGN schemes. We leave further discussion of the properties of silicates to a future paper. For the 7.7m feature of the Cloverleaf, we adopt a flux of 6.1W cm-2. This flux was determined by scaling a PAH template (ISO spectrum of M82, Sturm et al., 2000) to the measured Cloverleaf 6.2m feature flux, and then fitting three lorentzians to represent the 6.2, 7.7, and 8.6 features plus a local polynomial continuum to this template. Similar Lorentzian fits were also used for local comparison objects discussed below. Brandl et al. (2006) have quantified the scatter of the 6.2 to 7.7m flux ratio in starbursts, with 0.07 in the log this scatter indicates the modest uncertainty induced by tying the longer wavelength features to the 6.2m one. The result of subtracting the scaled M82 template from the Cloverleaf spectrum is indicated in Fig. 2, and shows a combination of continuum and silicate emission very similar to local QSOs. Directly measuring the 7.7m flux by fitting a single Lorentzian plus local continuum to the Cloverleaf spectrum gives a 40% lower feature flux, which would be a systematic underestimate because of the complexity of the underlying continuum/silicates discussed above.
3 Intense star formation in the host of the Cloverleaf QSO
The Cloverleaf SED (Fig. 1) shows strong rest frame far-infrared emission in addition to the AGN heated dust emitting in the rest frame mid-infrared. Weiß et al. (2003) decomposed the SED into two modified blackbodies of temperature 50 and 115 K, the rest frame far-infrared (40-120m) luminosity of L⊙ is dominated by the colder component and could largely originate in star formation. Comparison of PAH and far-infrared emission can shed new light on this question. The bolometric (rather than rest-frame far-infrared) luminosity of the Cloverleaf will still be dominated by the AGN. We estimate LBol extrapolating from the observed rest frame 6m continuum which for a mid-infrared spectrum with weak PAH but strong continuum will be AGN dominated (Laurent et al., 2000). Using L based on an Elvis et al. (1994) radio-quiet QSO SED, the AGN luminosity is L⊙. A similar estimate L⊙ is obtained from the rest frame optical (observed near-infrared; Barvainis et al., 1995) continuum, tracing the AGN ionizing continuum, and the same global SED.
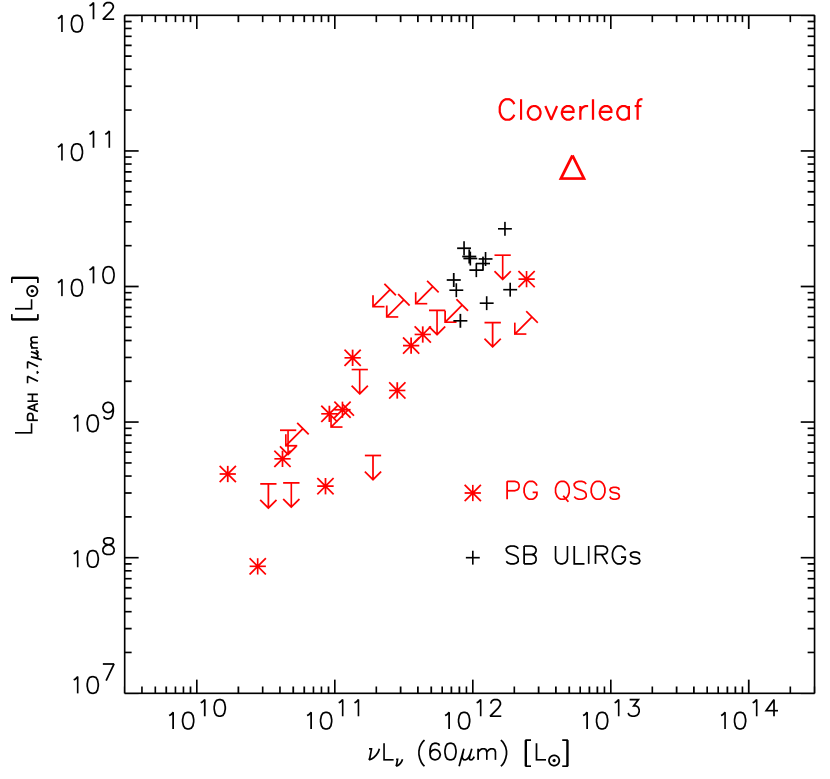
Schweitzer et al. (2006) have measured PAH emission in local QSOs and compared the PAH to far-infrared emission ratio to that for starbursting ULIRGs, i.e. those among a larger ULIRG sample not showing evidence for dominant AGN and not having absorption dominated mid-infrared spectra. Fig. 3 places the Cloverleaf on their relation between 7.7m PAH luminosity and far-infrared luminosity. is 0.014 for the Cloverleaf, very close to the mean value for the 12 starburst-dominated ULIRGs of . The scatter of this relation is 0.2 in the log for these 12 comparison ULIRGs, indicating the minimum uncertainty of extrapolating from the PAH to far-infrared emission. The Cloverleaf thus extends the relation between PAH and far-infrared luminosity for the local QSOs and ULIRGs to 5 times larger luminosities. Its PAH emission is consistent with an extremely luminous starburst of ULIRG-like physical conditions powering essentially all of the rest frame far-infrared emission.
Teplitz et al. (2006) present the IRS spectrum of the lensed FIR-bright Type 2 AGN IRAS F10214+4724 at similar redshift. They report a marginal feature at 6.2m rest wavelength which they do not interpret as PAH given the lack of a 7.7m maximum. Given the strength of silicate emission in this target, PAH emission may be present in the blue wing of the silicate feature without producing a maximum, and such a component may be suggested by comparing their Fig. 1 with the later onset of silicate emission in the spectra of local QSOs. The tentative 6.2m peak in IRAS F10214+4724 has similar peak height as the Cloverleaf PAH feature, in line with our interpretation and the similar rest frame FIR fluxes of the two objects.
With 5-10% of its total luminosity originating in the rest frame far-infrared and by star formation, the Cloverleaf is within the range of local QSOs, and not a pronounced infrared excess object. Specifically, its ratio of FIR to total luminosity and the ratio of rest frame far-infrared (60m) to mid-infrared (6m) continuum are about twice those of the Elvis et al. (1994) radio-quiet QSO SED. Adopting the conclusion of Schweitzer et al. (2006) that star formation already dominates the FIR emission of local PG QSOs and considering the modest FIR ‘excess’ of the Cloverleaf compared to the Elvis et al. (1994) SED then suggests only a small AGN contribution to its FIR luminosity. Other z2 QSOs may have lower ratios of FIR and total luminosity, and conversely larger AGN contributions to their more modest FIR emission, though. After correcting for lensing, the Cloverleaf submm flux is a factor 2 above the typical bright z2 QSOs of Priddey et al. (2003) whose rest frame B magnitudes in addition are typically brighter than the delensed Cloverleaf.
Submillimeter galaxies host starbursts of similar luminosity as the Cloverleaf, at similar redshift. Lutz et al. (2005) and Valiante et al. (2007) have obtained IRS mid-infrared spectra of 13 SMGs with median redshift 2.8, finding mostly starburst dominated systems. A comparison can be made between PAH peak flux density and flux density at rest wavelength 222m which is obtained with minimal extrapolation from observed SCUBA 850m fluxes. Combining the 7.7m feature peak of 5.1mJy (Fig. 2) with a extrapolation of the SCUBA flux of Barvainis & Ivison (2002) places the Cloverleaf at , near the center of the distribution of this quantity for the SMGs of Valiante et al. (2007, their Fig.4). Like the SMGs, the Cloverleaf appears to host a scaled up ULIRG-like starburst, but with superposition of a much more powerful AGN, also in comparison to the gas mass.
Tracers of high density gas, in particular HCN but also HCO+ have been detected in a few high redshift QSOs including the Cloverleaf (Barvainis et al., 1997; Solomon et al., 2003; Riechers et al., 2006). Their ratio to far-infrared emission is similar to the one for Galactic dense star forming regions, and has been used to argue for dense, high pressure star forming regions dominating the far-infrared luminosity of these QSOs as well as of local ULIRGs (e.g. Solomon et al., 2003). Intense HCN emission is observed also from X-ray dominated regions close to AGN (e.g. Tacconi et al., 1994), and there is ongoing debate as to the possible contributions of chemistry and excitation in X-ray dominated regions, and other effects like radiative pumping, to the emission of dense molecular gas tracers in ULIRGs and QSOs (Kohno, 2005; Imanishi et al., 2006; Gracía-Carpio et al., 2006). Unlike HCN, PAH emission is severely reduced in X-ray dominated regions close to AGN (Voit, 1992) and provides an independent check of the effects of the AGN on the molecular gas versus the role of the host and its star formation. In a scenario where XDRs dominate the strong HCN emission and the hosts PAH emission, reproducing the consistent ratios of these quantities to rest-frame far-infrared over a wide range of far-infrared luminosities would thus require a considerable amount of finetuning. In contrast, these consistent ratios are a natural implication if all these components are dominated by ULIRG-like dense star formation.
Our detection of PAH emission is strong support to a scenario in which the Cloverleaf QSO coexists with intense star formation. Applying the Kennicutt (1998) conversion from infrared luminosity to star formation rate to LL⊙ suggests a star formation rate close to 1000 M⊙yr-1, which can be maintained for a gas exhaustion timescale of only yr, for the molecular gas mass inferred by Weiß et al. (2003). At this time resolution, the period of QSO activity coincides with what likely is the most significant star forming event in the history of the Cloverleaf host.
References
- Alloin et al. (1997) Alloin, D., Guilloteau, S., Barvainis, R., Antonucci, R., Tacconi, L. 1997, A&A, 321, 24
- Aussel et al. (1998) Aussel, H., Gerin, M., Boulanger, F., Désert, F.X., Casoli, F., Cutri, R.M., Signore, M. 1998, A&A, 334, L73
- Barvainis et al. (1995) Barvainis, R., Antonucci, R., Hurt, T., Coleman, P., Reuter, H.-P. 1995, ApJ, 451, L9
- Barvainis & Lonsdale (1997) Barvainis, R., Lonsdale, C. 1997, AJ, 113, 144
- Barvainis et al. (1997) Barvainis, R., Maloney, P., Antonucci, R., Alloin, D. 1997, ApJ, 484, 695
- Barvainis & Ivison (2002) Barvainis, R., Ivison, R. 2002, ApJ, 571, 712
- Benford (1999) Benford, D. 1999, PhD Thesis, California Institute of Technology
- Brandl et al. (2006) Brandl, B., et al. 2006, ApJ, 653, 1129
- Canalizo & Stockton (2001) Canalizo, G., Stockton, A. 201, ApJ, 555, 719
- Carilli et al. (2005) Carilli, C.L., et al. 2005, ApJ, 618, 586
- Chapman et al. (2005) Chapman, S.C., Blain, A.W., Smail, I., Ivison, R.J. 2005, ApJ, 622, 772
- Elvis et al. (1994) Elvis, M., et al. 1994, ApJS, 95, 1
- Evans et al. (2001) Evans, A.S., Frayer, D.T., Surace, J.A., Sanders, D.B. 2001, AJ, 121, 3286
- Evans et al. (2006) Evans, A.S., Solomon, P.M., Tacconi, L.J., Vavilkin, T., Downes, D. 2006, AJ, 132, 2398
- García-Burillo et al. (2006) García-Burillo, S., et al. 2006, ApJ, 645, L17
- Genzel et al. (1998) Genzel, R., et al. 1998, ApJ, 498, 579
- Gracía-Carpio et al. (2006) Gracía-Carpio, J., García-Burillo, S., Planesas, P., Colina, L. 2006, ApJ, 640, L135
- Granato et al. (2004) Granato, G.L., de Zotti, G., Silva, L., Bressan, A., Danese, L. 2004, ApJ, 600, 580
- Greve et al. (2005) Greve, T.R., et al. 2005, MNRAS, 359, 1165
- Guélin et al. (2007) Guélin, M., et al. 2007, A&A, 462, L45
- Hao et al. (2005) Hao, L., et al. 2005, ApJ, 625, L75
- Hao et al. (2007) Hao, L., Weedman, D.W., Spoon, H.W.W., Marshall, J.A., Levenson, N.A., Elitzur, M., Houck, J.R. 2007, ApJ, 655, L77
- Hamann & Ferland (1999) Hamann, F., Ferland, G. 1999, ARA&A, 47, 487
- Hazard et al. (1984) Hazard, C., Morton, D.C., Terlevich, R., McMahon, R. 1984, ApJ, 282, 33
- Higdon et al. (2004) Higdon, S.J.U., et al. 2004, PASP, 116, 975
- Ho (2005) Ho, L.C. 2005, ApJ, 629, 680
- Hopkins et al. (2006) Hopkins, P.F., Hernquist, L., Cox, T.J., Di Matteo, T., Robertson, B., Springel, V. 2006, ApJS, 163, 1
- Houck et al. (2004) Houck, J.R., et al. 2004, ApJS, 154, 18
- Hughes et al. (1997) Hughes, D.H., Dunlop, J.S., Rawlings, S. 1997, MNRAS, 289, 766
- Imanishi et al. (2006) Imanishi, M., Nakanishi, K., Kohno, K. 2006, AJ, 131, 2888
- Kauffmann et al. (2003) Kauffmann, G., et al. 2003, MNRAS, 346, 1055
- Kennicutt (1998) Kennicutt, R.C. 1998, ARA&A, 36, 189
- Kohno (2005) Kohno, K. 2005, astro-ph/0508420
- Laurent et al. (2000) Laurent, O., Mirabel, I.F., Charmandaris, V., Gallais, P., Madden, S.C., Sauvage, M., Vigroux, L., Cesarsky, C. 2000, A&A, 359, 887
- Lutz et al. (2005) Lutz, D., Valiante, E., Sturm, E., Genzel, R., Tacconi, L.J., Lehnert, M.D., Sternberg, A., Baker, A.J. 2005, ApJ, 625, L83
- Magain et al. (1988) Magain, P., Surdej, J., Swings, J.-P., Borgeest, U., Kayser, R., Kühr, H., Refsdal, S., Remy, M. 1988, Nature, 334, 325
- Maiolino et al. (2005) Maiolino, R., et al. 2005 A&A, 440, L51
- Maloney et al. (1996) Maloney, P.R., Hollenbach, D.J., Tielens, A.G.G.M., 1996, ApJ, 466, 561
- Norman & Scoville (1988) Norman, C., Scoville, N.Z., 1988, ApJ, 332, 124
- Omont et al. (2003) Omont, A., Beelen, A., Bertoldi, F., Cox, P., Carilli, C.L., Priddey, R.S., McMahon, R.G., Isaak, K.G. 2003, A&A, 398, 857
- Priddey et al. (2003) Priddey, R.S., Isaak, K.G., McMahon, R.G., Omont, A. 2003, MNRAS, 339, 1183
- Riechers et al. (2006) Riechers, D.A., Walter, F., Carilli, C.L., Weiss, A., Bertoldi, F., Menten, K.M., Knudsen, K.K., Cox, P. 2006, ApJ, 645, L13
- Rowan-Robinson (1995) Rowan-Robinson, M. 1995, MNRAS, 272, 737
- Rowan-Robinson (2000) Rowan-Robinson, M. 2000, MNRAS, 316, 885
- Sanders et al. (1988) Sanders, D.B., Soifer, B.T., Elias, J.H., Madore, B.F., Matthews, K., Neugebauer, G., Scoville, N.Z. 1988, ApJ, 325, 74
- Sanders et al. (1989) Sanders, D.B., Phinney, E.S., Neugebauer, G., Soifer, B.T., Matthews, K. 1989, ApJ, 347, 29
- Schmidt et al. (1995) Schmidt, M., Schneider, D., Gunn, J. 1995, AJ, 110, 68
- Scoville et al. (2003) Scoville, N.Z., et al. 2003, ApJ, 585, L105
- Schweitzer et al. (2006) Schweitzer, M., et al. 2006, ApJ, 649, 79
- Shemmer et al. (2004) Shemmer, O., Netzer, H., Maiolino, R., Oliva, E., Croom, S., Corbett, E., di Fabrizio, L. 2004, ApJ, 614, 557
- Siebenmorgen et al. (2005) Siebenmorgen, R., Haas, M., Krügel, E., Schulz, B. 2005, A&A, 436, L5
- Solomon et al. (2003) Solomon, P., Vanden Bout, P., Carilli, C., Guélin, M. 2003, Nature, 426, 636
- Solomon & Vanden Bout (2005) Solomon, P.M., Vanden Bout, P.A. 2005, ARA&A, 43, 677
- Springel et al. (2005) Springel, V., Di Matteo, T., Hernquist, L. 2005, MNRAS, 361, 776
- Sturm et al. (2000) Sturm, E., Lutz, D., Tran, D., Feuchtgruber, H., Genzel, R., Kunze, D., Moorwood, A.F.M., Thornley, M.D. 2000, A&A, 358, 481
- Sturm et al. (2006) Sturm, E., Hasinger, G., Lehmann, I., Mainieri, V., Genzel, R., Lehnert, M.D., Tacconi, L.J., 2006, ApJ, 642, 81
- Tacconi et al. (1994) Tacconi, L.J., Genzel, R., Blietz, M., Cameron, M., Harris, A.I., Madden, S. 1994, ApJ, 416, L77
- Teplitz et al. (2006) Teplitz, H.I., et al. 2006, ApJ, 638, L1
- Valiante et al. (2007) Valiante, E., Lutz, D., Sturm, E., Genzel, R., Tacconi, L.J., Lehnert, M., Baker, A.J. 2007, ApJ, in press (astro-ph/0701816)
- Venturini & Solomon (2003) Venturini, S., Solomon, P.M. 2003, ApJ, 590, 740
- Voit (1992) Voit, G.M. 1992, MNRAS, 258, 841
- Weiß et al. (2003) Weiß, A., Henkel, C., Downes, D., Walter, F. 2003, A&A, 409, L41
| Quantity | Value | Reference |
|---|---|---|
| Redshift z | 2.55784 | Weiß et al. (2003) |
| Amplification | 11 | Venturini & Solomon (2003) |
| F(PAH 6.2m) | W cm-2 | this work |
| F(PAH 7.7m) | W cm-2 | this work |
| L(PAH 7.7m)aaCorrected for lensing amplification 11 and to our adopted cosmology , and km s-1 Mpc-1 (DL=20.96 Gpc). | L⊙ | this work |
| L(40-120m)aaCorrected for lensing amplification 11 and to our adopted cosmology , and km s-1 Mpc-1 (DL=20.96 Gpc). | L⊙ | Weiß et al. (2003) |
| M(H2)aaCorrected for lensing amplification 11 and to our adopted cosmology , and km s-1 Mpc-1 (DL=20.96 Gpc). | M⊙ | Weiß et al. (2003) |
| LBol(QSO)aaCorrected for lensing amplification 11 and to our adopted cosmology , and km s-1 Mpc-1 (DL=20.96 Gpc). | L⊙ | this work, |