The orbital motion of the Quintuplet cluster - a common origin for the Arches and Quintuplet clusters?∗
Abstract
We investigate the orbital motion of the Quintuplet cluster near the Galactic center with the aim of constraining formation scenarios of young, massive star clusters in nuclear environments. Three epochs of adaptive optics high-angular resolution imaging with the Keck/NIRC2 and VLT/NAOS-CONICA systems were obtained over a time baseline of 5.8 years, delivering an astrometric accuracy of 0.5-1 mas/yr. Proper motions were derived in the cluster reference frame and were used to distinguish cluster members from the majority of the dense field star population toward the inner bulge. Fitting the cluster and field proper motion distributions with 2D gaussian models, we derive the orbital motion of the cluster for the first time. The Quintuplet is moving with a 2D velocity of km/s with respect to the field along the Galactic plane, which yields a 3D orbital velocity of km/s when combined with the previously known radial velocity. From a sample of 119 stars measured in three epochs, we derive an upper limit to the velocity dispersion in the core of the Quintuplet cluster of km/s. Knowledge of the three velocity components of the Quintuplet allows us to model the cluster orbit in the potential of the inner Galaxy. Under the assumption that the Quintuplet is located in the central 200 pc at the present time, these simulations exclude the possibility that the cluster is moving on a circular orbit. Comparing the Quintuplet’s orbit with our earlier measurements of the Arches orbit, we discuss the possibility that both clusters originated in the same area of the central molecular zone. According to the model of Binney et al. (1991), two families of stable cloud orbits are located along the major and minor axes of the Galactic bar, named x1 and x2 orbits, respectively. The formation locus of these clusters is consistent with the outermost x2 orbit and might hint at cloud collisions at the transition region between the x1 and x2 orbital families located at the tip of the minor axis of the Galactic bar. The formation of young, massive star clusters in circumnuclear rings is discussed in the framework of the channeling in of dense gas by the bar potential. We conclude that the existence of a large-scale bar plays a major role in supporting ongoing star and cluster formation, not only in nearby spiral galaxies with circumnuclear rings, but also in the Milky Way’s central molecular zone.
1 Introduction
The Galactic center is host to 3 young, massive star clusters, the Arches and Quintuplet clusters at projected distances of 26 to 32 pc from the supermassive black hole (Nagata et al. 1990, 1995, Okuda et al. 1990, Cotera et al. 1996, Figer et al. 1999ab, Stolte et al. 2008), and the young nuclear cluster inside the central few parsecs (e.g., Genzel et al. 2003, Ghez et al. 2005, Paumard et al. 2006, Schödel et al. 2007, Do et al. 2009, 2013, Bartko et al. 2010, Lu et al. 2013). Each of these clusters is known to host at least in stars, with the Arches and Quintuplet likely containing stellar masses in excess of (Figer et al. 1999a, Espinoza et al. 2009, Clarkson et al. 2012, Habibi et al. 2013), similar to the stellar content in the Young Nuclear Cluster (Bartko et al. 2010, Lu et al. 2013). At ages of only a few Myr, these clusters harbour a rich population of Wolf-Rayet stars and supergiants, which are the youngest and most extreme post-main sequence evolutionary phases of O-type stars (Crowther 2007, Martins et al. 2008). The Quintuplet cluster in particular is associated with at least two sources in the short-lived Luminous Blue Variable (LBV) phase and contains several carbon-enriched Wolf-Rayet (WC) stars (Figer et al. 1999b, Liermann et al. 2009, 2010, Mauerhan et al. 2010a). The short dynamical lifetime of young clusters in the GC of only a few 10 Myr (Kim et al. 2000, Portegies Zwart et al. 2002) suggests that the Arches and Quintuplet clusters contribute to the apparently isolated field population of evolved, high-mass stars (Mauerhan et al. 2010b).
At the same time, the origin of these massive clusters is unknown. The dynamical properties of a young star cluster are indicators of the cluster’s origin and stability during its evolutionary timescale. In contrast to spiral arm clusters, clusters emerging near the center of the Galaxy are moving rapidly from their birth sites and do not appear affiliated with their natal clouds. The orbital motion of these clusters, combined with the cluster age, provides the only clue to their birth sites by tracing the cluster orbit backwards in time. In addition, the orbital velocity is an important determinant for the chances of cluster survival. Clusters on orbits very close to the Galactic center experience stronger tidal losses, but a larger orbital velocity decreases the effect of dynamical friction in the central potential.
With the goal of tracing back the dynamical evolution of the Arches and Quintuplet clusters to their potential formation locus, we have set out to measure the orbital motion and the internal velocity dispersion of both clusters from proper motions, covering a time baseline of six years. With the first derivation of the 3D orbital velocity of the Arches cluster and its orbital path for a family of nested orbits at various line-of-sight distances (Stolte et al. 2008), we constrained the most likely formation locus of this cluster to the inner 200 pc and hence showed for the first time that these massive clusters might form within the boundaries of the central molecular zone (CMZ). One predestined location where cloud collisions might trigger cluster formation are the regions where instreaming clouds on x1 orbits from the outer Galactic bar collide with CMZ clouds on orbits around the bar’s minor axis (x2 orbits, Binney et al. 1991). In our previous paper, we suggested a formation locus for the Arches cluster near the transition region of the x1 and x2 orbital families (Binney et al. 1991). Recent results by the Herschel satellite have fostered the notion of a star-forming ring in the inner 240 pc (diameter) of the CMZ (Molinari et al. 2011). Additional support to cluster formation in the Galactic center stems from the discovery of dense, compact clouds with sufficient masses to form clusters (Longmore et al. 2012, 2013). The clouds are located in projection along the star-forming ring proposed by Molinari et al. (2011). Although both the Arches and Quintuplet clusters were also suggested to be located on this structure (Longmore et al. 2013), their orbital velocities are higher by about a factor of two as compared to the terminal cloud velocities of km/s (Molinari et al. 2011).
In this contribution, we present the orbital velocity and obtain an upper limit to the internal velocity dispersion of the Quintuplet cluster. Combining the proper motion of the Quintuplet with its radial velocity, we model the cluster’s orbital motion as a function of the line-of-sight distance, which provides clues on the formation locus of the cluster. Ultimately, the comparison with N-body simulations will yield the expected tidal losses that have occured during the cluster’s lifetime. Comparable results for the - presumably younger - Arches cluster are presented in Stolte et al. (2008) and Clarkson et al. (2012).
The paper is organized as follows: The observations are described in Sec. 2, followed by the data reduction, astrometry and photometry procedures. The orbital motion and velocity dispersion are fitted using the proper motion plane in Sec. 3, while simulations of the family of cluster orbits are shown in Sec. 3.3. We also present an updated version of the Arches cluster orbit for comparison, adjusted for the slightly lower orbital velocity found in our new multi-epoch investigation (Clarkson et al. 2012). In Sec. 4, we discuss the implications for cluster formation in the nucleus of the Milky Way and other galaxies. Sec. 5 summarizes the main findings of the proper motion analysis.
2 Observations
For the proper motion analysis of the central region of the Quintuplet, data from the ESO Very Large Telescope (VLT) taken in 2003 were combined with Keck observations obtained in 2008 and 2009. A second epoch of NACO observations obtained in July 2008 was used to constrain the 2D cluster motion from a sample of stars at larger radii from the cluster center. All positions are approximately centered on the central Quintuplet star Q12 (Glass et al. 1990) at RA 17:46:15.12, DEC -28:49:35.06. A technical summary of the observations is provided in Table 1.
2.1 Keck/NIRC2
Keck observations were carried out using the NIRC2 near-infrared camera (PI: K. Matthews) behind laser guide star adaptive optics on 2008 May 14 and 2009 May 4. The narrow camera was used with a field of view of , delivering a pixel scale of 9.942 milliarcseconds (mas) per pixel. A detector integration time of 1s with 30 co-added frames led to a total integration time of 30s per image using the filter (m, m), similar to the specifications of the NACO filter (Sec. 2.2). A small dither pattern of in 2008 and of in 2009 was used to facilitate bad-pixel removal. The small dither movements minimize optical distortion effects, which enhances the astrometric accuracy of the NIRC2 data set. In the 2008 campaign, 58 images were obtained with Strehl ratios ranging from 8% to 34%, with a spatial resolution between 57 and 108 mas (Full Width at Half Maximum, FWHM). As spatial resolution is the limiting factor for the astrometric accuracy, only the 33 frames with mas and Strehl ratios % were selected for the astrometric analysis. In the 2009 campaign, the same exposure time setup was used to obtain 117 images with Strehl ratios between 12 and 47% and spatial resolutions of mas. In total 60 frames with % and mas were selected for image combination.
The data reduction was carried out with our custom-made NIRC2 data pipeline (see Lu et al. 2009 for a detailed description). The raw data were reduced using dark images with the same exposure time, readout mode, and number of co-adds, and were then divided by the master flat-field created from on-off lamp flats taken during the same night. During the combination of the master dark and flat-field images, a 3 sigma clipping routine was applied to detect hot and dark pixels and create a fixed NIRC2 bad pixel mask. In addition to the fixed NIRC2 bad pixel mask, individual mask images were extracted for each image using a standard cosmic ray detection routine (crrej in IRAF). At the end of the cluster observing sequence, 9 sky images were obtained with the same observational setup and at an airmass comparable to that of the science observations. The sky images were scaled to a common mean sky level prior to image combination, and the resulting master sky was scaled with scaling factors of 0.99-1.03 to the background flux of each science frame before sky subtraction. The reduced images were combined using the drizzle task (Fruchter & Hook 2002) in IRAF111IRAF is distributed by the National Optical Astronomy Observatory, which is operated by the Association of Universities for Research in Astronomy (AURA) under cooperative agreement with the National Science Foundation.. In addition to a deep image encompassing all 33 (60) selected frames in 2008 (2009) shown in Fig. 1, 3 auxiliary images were drizzled from three subsets of 11 (20) frames each, where the full range of spatial resolutions is included in each stack to achieve a comparable data quality among all three subsets. Photometry is derived on these auxiliary images in the same way as on the deep combined image to obtain photometric and astrometric uncertainties from repeated measurements.
2.2 VLT/NAOS-CONICA
The Quintuplet cluster was observed in 2003 with the Very Large Telescope (VLT) Nasmyth Adaptive Optics System NAOS (Rousset et al. 2003) attached to the infrared camera CONICA (Lenzen et al. 2003, hereafter NACO) as part of the guaranteed time observations of the NACO instrument consortium. Observations were carried out on 2003 July 22 and 23, using the infrared wavefront sensor with the N20C80 dichroic splitting the beam such that 20% of the light serves the adaptive optics control loop and 80% is diverted to the science detector. The infrared-bright star Q2 (Glass et al. 1990) with mag at a distance of from the cluster center (Q12) served as the natural guide star for the infrared wavefront sensor. Images were observed with the S27 camera covering a field of view with a pixel scale 27.1 milliarcseconds (mas) per pixel and the filter with m, m, similar to the NIRC2 filter (Sec. 2.1). Two sets of exposures with different integration times were obtained to minimize saturation effects while ensuring astrometric and photometric performance at the faint end. Short exposures with detector integration times of 2.0s with 15 co-added frames aided avoiding saturation of the brighter cluster members, and 20.0s exposures with two co-added frames enhanced the sensitivity towards the faintest stars. The telescope was moved in a wide dither pattern with maximum offsets of to avoid artefacts due to ghost images of the very bright central cluster stars ( mag) and to facilitate bad pixel correction. Dithering increased the observed field of view to , and the central of this field were extracted for matching with the narrow field NIRC2 data sets. A second, shallower epoch of NACO images with 2.0s individual exposure times and maximum dithers was obtained in July 2008 with the same instrumental setup under worse atmospheric conditions. For all NACO data sets, the FWHM ranged from 71 to 83 mas with Strehl ratios of 3-12% (see Table 1).
The raw data were extracted from the ESO archive facility, including flat-field and dark calibration frames taken during adjacent nights. A custom-made pipeline which caters to the special needs of the NACO S27 performance was used to reduce the data. The major reduction steps are briefly summarized here, while a detailed overview of the reduction procedures is presented in Hußmann et al. (2012). As 50Hz noise is sometimes prevalent in the NACO images222http://www.eso.org/observing/dfo/quality/NACO/ ServiceMode/naco_noise.html, manifesting itself in a dense pattern of horizontal stripes moving across the images during consecutive exposures, both science and sky frames were dark-subtracted and flat-fielded to allow for 50Hz correction prior to sky subtraction. A master dark was generated from 3 individual dark exposures with the same exposure time and readout mode as the science images. The master flat-field was derived from sensitivity measurements in each pixel obtained at varying twilight flux levels. The master sky was created from sky exposures of semi-empty fields observed without AO correction. Residual star flux was removed from the master sky image by rejecting bright pixels during the combination of the individual sky frames. As in the case of the NIRC2 data, a bad pixel mask was created during the combination of the darks and flat-fields, to which individual bad pixel masks are added for each image marking cosmic ray events detected with the IRAF crrej routine. The reduced images are combined using the IRAF/PYRAF task drizzle, with the individual bad pixel mask applied to each frame during image combination. From the 2.0s and 20.0s 2003 and 2.0s 2008 data sets, one deep image was generated for each by selecting 16, 16, and 33 individual frames, respectively. The deep images of the 2003 and 2008 2s exposures are displayed in Fig. 1. The combined sets are termed 2s and 20s (combined) images for simplicity in the remainder of the paper. Auxiliary images were generated from one third of the individual science exposures in each of these sets to perform repeated flux measurements for a realistic judgement of the astrometric und photometric uncertainties.
2.3 Astrometry and Photometry
2.3.1 Keck/NIRC2
Positions and fluxes were extracted using the Starfinder crowded field point spread function (PSF) fitting tool (Diolaiti et al. 2000). In the NIRC2 field of view, ten isolated sources were selected as PSF reference stars. Photometry of all sources in the field was extracted with a flux threshold of three sigma above the background, and three source extraction iterations were performed. In addition to the deep images, Starfinder was run on each of the three auxiliary images in each epoch. As these three images are independent, a repeated flux and position measurement is obtained for each star, albeit at the cost of photometric sensitivity and astrometric precision due to the fact that each subset contains only one-third of the images combined in each deep image. Stars are required to be detected in at least two auxiliary images in addition to the deep science image. For stars detected in all three auxiliary images, the uncertainty in the position and magnitude of each star is derived as the root-mean-square (rms) deviation from the mean of the three subsets divided by the square root of the number of independent measurements, here , which compensates for the lack of photometric depth in the auxiliary images as compared to the deep science image. In the case that a star is only detected in two auxiliary images, the uncertainty is derived as the deviation from the mean of the two measurements, divided by . The positional uncertainties for all data sets are displayed in Fig. 2.
2.3.2 VLT/NACO
Ks 2003 central field
The larger field of view of provided by the NACO camera shows severe anisoplanatic effects across the field. These effects were especially pronounced in the 20s images due to the long integration time. For the central area overlapping the NIRC2 data, it proved sufficient to perform PSF fitting photometry with Starfinder in the same manner as described above. The extracted field of view covered , which allowed for a constant PSF construction with 30 to 40 stars in the 2s and 20s exposures. The use of the same Starfinder algorithms ensured that the relative astrometric uncertainty between NACO and NIRC2 was minimized. Matching the NACO 2003 source list with the NIRC2 2008 and 2009 photometry provided a catalogue of 226 sources of which 119 had 3-epoch measurements suitable for linear-motion fitting (see Sec. 2.4). This catalogue provides the highest astrometric accuracy available in the Quintuplet cluster center.
Ks 2003 & 2008 full field
For the extraction of the wider field of view with substanially increased source counts, the anisoplanatic effects in both the NACO 2003 and 2008 data sets could not be ignored. The daophot PSF package with a spatially varying PSF was therefore used to perform the photometry on these data sets. While the 2s combined images in 2003 and 2008 could be well modelled with a quadratically varying PSF, the anisoplanatic effects across the 20s exposures proved neither linear nor quadratic. To minimize the residual positional errors from anisoplanatism, the 2003 20s combined image was split into four quadrants and the PSF fitting was performed on each quadrant separately. A linearly varying PSF across each quadrant image provided the lowest flux residuals after PSF subtraction. The astrometric and photometric source lists of all quadrant images were re-combined and matched with the 2s 2003 photometry to replace saturated stars with mag in the deep observations. The combined 2003 source list was then matched with the NACO 2008 daophot photometry to yield 2134 sources with proper motion uncertainties of less than 3 mas/yr and mag suitable for fitting the cluster motion.
The three auxiliary images providing the photometric and astrometric uncertainties were treated in the same way as the deep image, and uncertainties were derived as in the case of the NIRC2 data discussed above.
2.3.3 Photometric calibration
Absolute photometric calibration was obtained by referencing bright stars against the UKIDSS source catalogue. The UKIDSS survey is a near-infrared survey conducted with the UKIRT telescope on Mauna Kea, Hawai’i (Lawrence et al. 2007). The Galactic center region is covered as part of the Galactic plane survey (GPS) described in detail in Lucas et al. (2008). The survey provides a uniform spatial resolution of better than 1 arcsecond defined by the median seeing conditions at UKIRT (Warren et al. 2007). The larger NACO field of view is used to identify semi-isolated stars with reliable fluxes in the UKIDSS GPS survey. The zeropoint was derived for the combined NACO image with the short 2.0s individual exposure time to avoid saturation effects. Magnitudes reported in the GPS are derived from aperture fluxes within the FWHM resolution of . In order to mitigate a systematic error in the zeropoint due to the difference in spatial resolution, the flux of stars detected in the NACO frame within the radius from each calibration source was added prior to the zeropoint derivation. This is particularly crucial as the flux is systematically brighter for UKIDSS stars where the aperture contains several fainter sources next to the calibration star. As a consequence, the uncorrected flux zeropoint is 0.2 mag larger than the zeropoint after correcting for the sum of resolved stars in each aperture. To avoid stars partially contributing to each circular aperture, stars located closer than one FWHM (3.2 pixel or ) from the aperture edge were excluded, such that only stars within contribute to the total flux of PSF-fitted stars in each aperture. For most calibration sources, corrections due to flux adding are below 0.1 mag, yet the maximum correction reaches 0.3 mag in two cases. This constructed aperture flux on the NACO 2.0s image is then compared to the UKIDSS photometric catalogue for zeropoint calibration. The sample of local, reddened stars used as calibrators ensures that color effects are minimized, and no color terms were found between the Mauna Kea and VLT filters. A total of 15 non-saturated stars with mag provided a zeropoint of mag.
After calibrating the 2.0s source list to UKIDSS, the 20.0s NACO catalogue was referenced to the 2.0s calibrated catalogue using a total of 860 stars in the common linear regime, mag. The deeper NIRC2 2009 observations were calibrated with respect to the NACO 2.0s 2003 observations using stars in the range mag, and the shallower NIRC2 2008 observations were then calibrated against the NIRC2 2009 observations with stars with mag. The three auxiliary frames of each data set were calibrated with respect to their respective deep image in all cases. The high number of available calibration sources between each high-resolution 2003/2008/2009 data set led to a zeropoint error of less than mag for each calibration, which is consistent with the deviation between all cross-matched data sets after zeropointing. The absolute accuracy of the final photometry is therefore limited by the calibration with respect to the UKIDSS sample with a zeropoint uncertainty of mag.
2.4 Geometric transformation & proper motions
2.4.1 NACO 2003 & NIRC2 2008 & 2009
Proper motions are derived in the cluster reference frame, adopting our earlier approach as laid out in Stolte et al. (2008) and Clarkson et al. (2012). As there are no known high-resolution radio sources in the cluster field, we cannot derive the cluster motion in the absolute reference frame. Systematic effects caused by the necessary choice of the cluster reference frame, such as the higher number of detected foreground stars as compared to reddened background sources, are discussed in detail in Sec. 3.2 of Stolte et al. (2008).
All epochs were transformed to the NIRC2 2009 image, which served as the reference epoch. The NIRC2 2009 observations were chosen as astrometric reference because i) the optical distortion solution is extremely well known for NIRC2 (Yelda et al. 2010), while it is not sufficiently known for the NACO S27 camera, and ii) the 2009 observations are photometrically the most sensitive data set, such that positions have the highest astrometric precision (see Fig. 2). Geometric transformations were calculated individually and iteratively using the IRAF task geomap for the NACO 2.0s short exposure combined image, the NACO 20.0s deep combined image, and the NIRC2 2008 image. An initial estimate of the transformation was obtained from bright stars, which are dominated by cluster members. The proper motion diagram created from this initial guess, where cluster stars are concentrated around the origin in the cluster reference frame, was then used to iteratively improve the transformation. In the second step, the transformations were refined using all stars with proper motions within a 2-sigma selection circle around the origin as cluster member candidates. This selection ensured that only stars not moving significantly with respect to the cluster are used to derive the final geometric solution. Stars with significant motions between the considered epochs are excluded from the fit. A second-order polynomial including first-order cross terms provided the most accurate geometric transformation solution in all cases. The residual rms in the proper motion of cluster members after the transformation was applied served as a probe for the accuracy of the transformation matrix. In the case of the NIRC2 2008 transformation, 38 stars with mag provided a residual rms of 0.032 (0.022) pixels or 0.32 (0.22) mas in the x and y directions, respectively, in the final geometric solution. For the NACO 2003 2.0s observations, a final selection of 41 cluster member candidates with mag yielded a residual rms of 0.63 and 0.70 mas in the x and y coordinates, respectively. For the NACO 20.0s deep combined image, 32 stars with mag led to residual rms values of 0.85 and 0.76 mas in x and y, respectively. As expected, the positional uncertainty is larger for the lower resolution NACO observations due to the larger pixel size and the unknown instrumental optical distortions, but is mitigated by the longer time baseline. As there is no significant difference between the x and y directions, the mean of the x and y rms residuals divided by the time baseline provide an indication of the proper motion uncertainty from each transformation. The contribution of the geometric transformation to the proper motion uncertainty is 0.27 mas/yr when referencing the NIRC2 2008 to the NIRC2 2009 positions, and 0.80 mas/5.78 yrs mas/yr when referencing the NACO 2003 epoch to NIRC2 2009. The x and y rms uncertainties of the transformation are added in quadrature to the individual x and y positional uncertainties to derive the proper motion uncertainty of each star measured in only two epochs.
For the final proper motion source list, star lists from all epochs were matched with the NIRC2 2009 reference list. For the 5.8 year baseline between NACO and NIRC2, a matching radius of 5 pixels (50 mas) was used to allow for all field stars to be included in the proper motion sample. The NIRC2 2008 positions were matched to the 2009 catalogue with a matching radius of 2.0 pixels (20 mas), which accounts for the smaller time baseline of only 1 year. The final proper motion catalogue contains 119 sources detected in all three epochs, and an additional 107 sources only detected in 2003 and 2009.
For the 119 sources detected in all three epochs, proper motions were obtained from linear fits to the x and y coordinate with respect to the time baseline. The linear fit was performed with respect to the uncertainty-weighted mean epoch,
,
where is the time, in fractional years, of each measurement at each epoch , and denotes the astrometric uncertainty in x or y at the same epoch, respectively.
Note that the dependency of the weighted mean epoch on the x and y positional uncertainties implies that it is different for each star. The linear fit of the change in x or y position over time is performed with respect to the difference between each epoch and the mean epoch, which minimizes the uncertainty from the intercept and facilitates the derivation of realistic fitting uncertainties in the proper motion plane. Otherwise, the extrapolation back to zero from an epoch of 2003.56 causes unrealistically large uncertainties in the intercept.
The combined proper motion uncertainties for all data sets are shown in Fig. 3. For stars brighter than mag, the uncertainty is dominated by the lower resolution NACO 2003 data set, while between mag, the shallower NIRC2 2008 data determine the proper motion uncertainty. Because of the significant difference in detection sensitivity, stars with mag are only detected in the 2003 and 2009 epochs. The combined proper motion uncertainty of these sources is shown as open diamonds in Fig. 3 (left panel).
As the fainter field stars were predominantly lost in the 2008 observations, the 3-epoch sample is heavily biased towards cluster stars. In order to measure the relative motion between the cluster and the field, we therefore had to include the faint field stars detected in the 2003 and 2009 epochs alone. For the 107 sources not detected in 2008, the proper motion had to be estimated from the positional difference between 2009 and 2003, and no goodness-of-fit evaluation was possible. As most of these stars are fainter than mag, the larger positional uncertainties are reflected in larger proper motion uncertainties than in the case of the 3-epoch linear-fitting proper motions.
The proper motion uncertainty for stars measured in all three epochs is determined from the linear fitting error of the slope of the three measurements, leading to a median uncertainty of 0.34 mas/yr for stars with mag for the 3-epoch sample (Fig. 3, left panel, asterisks). The median proper motion uncertainty for stars detected in 2003 and 2009, but not in 2008, was 0.66 mas/yr (Fig. 3, left panel, open symbols).
2.4.2 NACO 2003 & 2008 full field
The same iterative procedure is employed when matching the NACO 2003 and 2008 epochs covering the full field of view. For these two data sets, obtained with the same CONICA S27 camera and hence similar optical properties, the geometric transformation resulted in a residual x and y rms of 1.1 and 1.3 mas. These transformation uncertainties contribute 0.24 mas/yr to the final astrometric uncertainty, which is dominated by the positional uncertainties of the PSF fitting procedure in both NACO epochs (see Fig. 2, bottom two panels). After matching the NACO 2003 & 2008 source catalogues, the median proper motion uncertainty of stars with mag in both x and y results in 0.5 mas/yr for the time baseline of 5.0 years (Fig. 3, right panel). The final proper motion catalogue contains 2137 sources across a combined field of view of .
2.5 Combined proper motion catalogues
The source counts of all proper motion catalogues are summarised in Table 2. In the final proper motion source list as published in Table 3, the central cluster area is covered with the NACO-NIRC2 astrometry and photometry of 226 sources covered in 2003, (2008), and 2009, providing the highest astometric performance. All sources in this catalogue have proper motion uncertainties of less than 1.5 mas/yr. In addition, a more complete coverage of the cluster center is provided due to the sensitivity of the NACO-NACO sample in Table 4, albeit at the cost of astrometric accuracy. The outer cluster areas contain NACO-NACO astrometry exclusively, and the full NACO-NACO catalogue contains 2137 stars with proper motion uncertainties of less than 3 mas/yr and mag. Sources with larger uncertainties are not included in the final NACO-NACO catalogue. The full version of both tables is available electronically from the cds database333Full data tables are available from the journal webpage..
3 Proper motion analysis
In this section we derive the orbital motion of the Quintuplet cluster. We will then use the knowledge of the 3D velocity of the cluster to constrain the cluster orbit in the central Galactic potential. An upper limit to the internal velocity dispersion is also provided.
3.1 Quintuplet’s orbital motion
The proper motion diagram with all 226 central sources is shown in Fig. 4 (left panel), and the proper motion distribution of all stars in the extended NACO field is shown in Fig. 4 (right panel). As cluster members are on average brighter, they dominate the dense clump of stars around the origin, which implies zero motion with respect to the cluster reference frame as defined above. Hence, these stars are cluster member candidates, denoted cluster members for simplicity in the following. The absolute motion of the cluster with respect to the field is obtained for the two proper motion samples individually. The NIRC2-NACO sample provides the more accurate astrometric measurements while being limited to a small number of field reference stars. The NACO-NACO sample, on the other hand, contains a ten times larger number of stars while being limited by the larger proper motion uncertainties. In the case of the field stars used to derive the relative motion between the cluster and the field population in the inner bulge, the uncertainty in each individual measurement does not influence the fit to the ensemble substantially. The velocity dispersion, however, is derived from the standard deviation of cluster members, and is therefore strongly influenced by the individual motion uncertainties. It is crucial for the derivation of an upper limit to the velocity dispersion that the sample with the smallest proper motion uncertainties be used, such that the motions are reliably determined. We therefore employ the NACO-NIRC2 sample of the central cluster to derive both the absolute motion of the Quintuplet with respect to the field and to constrain the velocity dispersion. From the NACO-NACO sample of the extended field, an independent estimate of the absolute cluster motion is obtained using a large sample of field reference stars.
3.1.1 Fitting the cluster proper motion
Following the procedures developed in our previous investigation of the Arches cluster (Clarkson et al. 2012), we have employed a binning-independent fitting method to the proper motion distribution using Expectation Maximization (EM). As a statistical method, EM is particularly useful for sparse or incomplete datasets. This is particularly the case for the low number of field stars as compared to cluster stars in the NIRC2-NACO sample. This method allows us to derive the probability of a star occupying a given location in proper motion space to belong either to the cluster or to the field distribution (see Clarkson et al. 2012, equ. 1). Taking into account the proper motion uncertainty of each star, individual membership likelihoods are also derived. The distribution of sources in the proper motion diagram is modelled by two bivariate gaussian functions, and the best-fit model is derived from EM fitting following Bishop (2006, Chapter 9, see also Press et al. 2007, Chapter 16, pp. 842).
Two elliptical gaussian functions are fitted to the ensemble of field and
cluster stars in the proper motion plane,
with one gaussian representing the cluster and one the field. Cluster and field
distributions are allowed to overlap. No further constraints need be assumed
a priori for the fit. Even with relatively large deviations
of the initial guess from the final solution,
the two gaussians converge towards the same cluster and field solution.
The peak distance between the two elliptical gaussians yields the absolute motion
between the cluster and the field sample, while
the semi-major axis of the cluster ellipse provides an estimate of,
or an upper limit on, the internal velocity dispersion.
The fitting method is described in numerical detail in Clarkson et al. (2012)
and follows the procedures established for the Quintuplet cluster in
Hußmann (2014), and only the major features are recaptured here.
In addition, the membership probability of each star is derived taking into
account the individual uncertainties in the proper motion of each star
following the procedures in Kozhurina-Platais et al. (1995).
In the minimization procedure to fit the relative motion of the Quintuplet
with respect to the field,
all stars are included in the fit of the cluster and field motion ellipses,
and no distinction is made between cluster and field stars. Hence, for the
derivation of the motion the membership probabilities are not relevant.
Nevertheless, these membership indicators are included in Tables 3
and 4 for future reference.
As outliers tend to skew the elliptical fit, especially to the field distribution, stars significantly distant from the Galactic plane were removed from the fit. Stars were rejected if their proper motion vertical to the Galactic Plane was larger than mas/yr, or if their motion parallel to the plane was larger than mas/yr or more negative than mas/yr to remove outliers from the field sample (Fig. 5, see also Hußmann 2014 for a detailed explanation). Only stars with proper motion uncertainties of less than 1.5 mas/yr are included in the NIRC2-NACO source list (see Sec. 2.4), such that the scattered distribution of stars beyond the selection limits does not originate from particularly large proper motion uncertainties in these objects. Therefore, these stars are likely rapidly moving foreground interlopers. All remaining stars were then fitted with a field and cluster ellipsoid in the shape of two bivariate gaussian functions simultaneously, where both minor and major axes parameters and centroids as well as position angles are unconstrained. In Fig. 6, we show the two bivariate gaussian fits to the proper motion diagram, and fitting parameters are given in Table 5. Likely cluster members are shown in red. The Quintuplet’s proper motion is measured as the distance between the centroids of the field and the cluster ellipsoids. Fitting all remaining 215 stars in the NIRC2-NACO sample yields a bulk motion of mas/yr for the Quintuplet cluster with respect to the field, which corresponds to 120 km/s at the GC distance of 8.0 kpc. Including only the 119 stars measured in 3 epochs, and hence the most accurate proper motion ensemble from linear motion fitting, results in a bulk motion of mas/yr or 147 km/s. The large difference between the two values reflects the sensitivity of the bulk motion to the centroid of the extended field ellipse, which is particularly sensitive to changes in the distribution of field stars in the proper motion plane and hence the sample selection. The left panel of Fig. 6 illustrates the sparse field population contributing to the centroiding distance between the cluster and the field ellipse. The 3-epoch sample yields the maximum proper motion of the cluster along the Galactic plane, and hence suggests this value is an upper limit to the true 1D motion of the Quintuplet. The position angle of the field ellipse is fitted to be 32 to 33 degrees in all samples, which is in excellent agreement with the position angle of 34.8 degrees of the Galactic plane. The proper motion of the Quintuplet is therefore consistent with a cluster orbit oriented along the Galactic plane, with no evidence for a significant motion component out of the Galactic plane.
Given the sensitivity of the fit to the sample selection, we have used the wider, albeit less well resolved, NACO field coverage to verify the derived velocity of the cluster with respect to the field. The same proper motion selection was applied as above (Fig. 5, right panel), as less restrictive selection criteria did not influence the fit. Only stars with proper motion uncertainties of mas/yr were included in the fit. From the 1968 stars with mag selected in the central 1 pc square Quintuplet field, a bulk motion of 3.08 mas/yr or 117 km/s is found, and the motion is again with a position angle of 33 degrees aligned along the Galactic plane. The larger proper motion uncertainties intrinsic to the NACO observations are reflected in the more extended cluster member distribution around the origin as compared to the member candidates in the NIRC2-NACO sample (upper vs. lower panel in Fig. 6). Correspondingly, a larger number of cluster stars scatter into the field population. The centroid of the field ellipse is therefore pulled towards the center of the cluster ellipse (i.e. the origin of the proper motion plane, Fig. 6), such that the absolute motion of the cluster with respect to the field is estimated to be smaller than in the case of the Keck data. This value can hence be considered a lower limit to the cluster motion along the Galactic plane.
Combining all three fitted values provides an absolute uncertainty to the orbital motion of the Quintuplet cluster. We therefore conclude that the 2D motion of the Quintuplet cluster, i.e. the relative motion of stars in the cluster reference frame with respect to the surrounding field population, is found to be km/s along the Galactic plane. This 3D velocity is similar to the orbital velocity of the Arches cluster and is oriented along the Galactic plane, as illustrated in Figure 7.
3.1.2 Quintuplet’s 3D orbital motion
In order to derive the 3D orbital motion of the Quintuplet cluster with respect to the field, we assume that the field is on average at rest. As we discussed in Stolte et al. (2008), the relative motion between blue and red fore- and background stars in the Arches field sample was found to be in excellent agreement with the velocity deviation observed in bulge giants (Sumi et al. 2003, see especially the red clump sample in their Fig. 8). This consistency implies that the field population consists of a representative sample of bulge motions along the line of sight, which are on average at zero velocity with respect to the Sun. We therefore concluded that the mean motion of the detected field stars is consistent with the field being at rest. As the Quintuplet field sample is very similar in velocity space and in number to the Arches field sample, as expected from the identical observational setup, the field sample is also considered to be at rest, with the cluster moving with respect to this field. A detailed discussion of the field contribution in the center of the Quintuplet cluster is provided in Hußmann et al. (2012). The CMD of field stars is entirely dominated by red bulge giants at the faint end, mag, and red clump stars at intermediate magnitudes, mag (see their Fig. 8, left panel). Only very few Galactic disk sources, clearly discerned due to their blue colors at mag, contaminate the field sample. These Galactic disk sources are expected to be on the flat part of the Galactic rotation curve and tend to have comoving orbital velocities of km/s, on the same order as the clusters with respect to the bulge population. We therefore assume that the centroid of the reference velocity ellipsoid is not biased by disk stars. As they comprise a minor fraction of field stars of at most a few percent, they do not influence the derivation of the relative motion between the cluster and the field. With the assumption that the field reference sample is on average at rest, the mean apparent proper motion of the field in the proper motion plane represents the absolute 2D motion of the cluster through the bulge.
The radial velocities of stars in a wider Quintuplet field were reported by Liermann et al. (2009). In order to deduce the mean radial velocity of the young cluster population, we include only the early-type cluster members from their sample and we exclude the Wolf-Rayet stars and other stars with uncertain radial velocity measurements. From this sample with reliable velocity measurements, the mean radial velocity of the 52 early-type cluster members is found to be km/s (the standard deviation of 13 km/s is divided by sqrt(52) to obtain the standard error of the mean, whic hwe use as the radial velocity uncertainty). Note that the standard deviation of the radial velocity measurements is dominated by the fitting accuracy to the line centroids in the spectral fits (see Liermann et al. 2009 for details), and does not provide an independent estimate of the (radial) velocity dispersion of the cluster. Combining the proper motion of km/s with this radial velocity, we derive the present-day 3D orbital velocity of the Quintuplet cluster to be km/s. This 3D velocity is similar to the orbital velocity of the Arches cluster and is oriented along the Galactic plane, as illustrated in Figure 7.
3.2 Quintuplet’s velocity dispersion
As discussed above, the most accurate proper motions least affected by residual astrometric uncertainties are given by the 3-epoch sample. Of the 119 stars in this sample, 55%, or 65 stars, are found to be likely proper motion members (red points in Fig. 6). For these cluster candidates, the velocity dispersions in the x- and y-direction are measured to be mas/yr and mas/yr, corresponding to 10.3 km/s and 9.3 km/s, respectively. The mean proper motion uncertainties for this sample of cluster members are with mas/yr and mas/yr, about the same as the fitted dispersions, suggesting that the dispersion measurement is dominated by the individual motion uncertainties. The values therefore comprise an upper limit to the intrinsic velocity dispersion of the Quintuplet cluster.
The fact that the mean uncertainty of 0.253 mas/yr in the y-direction is larger than the apparent velocity dispersion measured in cluster members suggests that the individual uncertainties are slightly overestimated. The uncertainties used to weight each motion measurement in the 3-epoch fit contain both the individual positional uncertainties as well as the rms residuals of the transformation. However, the transformation rms is comprised of the derivation of the mapping solution at each point, and therefore includes a contribution from the individual astrometric uncertainties. Because the astrometric uncertainties and the transformation residuals are a function of x,y position on the images, the two components cannot be separated. The overestimated uncertainties in each motion fit is likely caused by this combination of transformation residual error with the individual astrometric uncertainties in the transformed epochs. In the standard procedure when deriving the velocity dispersion from proper motions, the mean astrometric uncertainty would be subtracted in quadrature. As this mean is larger especially in the y-direction than the dispersion value, the velocity dispersion cannot be reduced from the astrometric uncertainties in this way. The slightly lower median errors of mas/yr and mas/yr would lead to a reduced velocity dispersion of mas/yr (4.53 km/s) and mas/yr (3.39 km/s), and hence a mean 1D velocity dispersion of km/s. Nevertheless, the fact that the mean astrometric uncertainties are larger than the measured dispersion values suggests that the 3-epoch sample is just not accurate enough to provide a realistic dispersion measurement.
In summary, an upper limit of the velocity dispersion of km/s is obtained for the core of the Quintuplet cluster. The photometric mass in the cluster center was recently measured by Hußmann et al. (2012) to be for within a radius of 0.5 pc. Inverting the equation for the virial mass within radius , within 0.5 pc of the cluster center (where is the gravitational constant), the expected 3D velocity dispersion would be on the order of km/s, and could be as small as km/s. Such a low central velocity dispersion would be consistent with the measurements in other young, massive clusters such as the Arches ( km/s 444This value is deduced from the dispersion measurement of 0.15 mas/yr for a GC distance of 8.0 kpc., Clarkson et al. 2012) and NGC 3603 ( km/s, Rochau et al. 2010). Further proper motion epochs are therefore required to alleviate the constraints on the derived upper limit.
3.3 Orbit simulations
Orbital simulations were carried out following the prescription in Stolte et al. (2008). With the measurement of the 3D orbital velocity and the two spatial coordinates on the plane of the sky, the only unknown is the line-of-sight distance to the cluster (from the Sun), which is represented in the following as the line-of-sight distance between the cluster and the Galaxy’s center of mass (henceforth called “line-of-sight distance” for simplicity). As the cluster is evolved in the gravitational potential of the inner Galaxy, no assumption needs to be made about the absolute distance between the GC and the Sun. As shown in the case of the Arches cluster, orbits at large radii become increasingly self-similar, as expected at larger distances within the tidal field of the inner Galaxy. Dramatic changes do occur in the orbital characteristics, and in particular in the closest approach of the cluster to the supermassive black hole (Sgr A∗), if the cluster is located at small seperations from the center of the potential, which implies that its present-day projected distance is close to its true distance from the Galaxy’s center of mass. We evolved a set of orbits with line-of-sight distances between -200 pc and +200 pc from the Galactic center. As in the case of the Arches cluster, the Quintuplet was assumed to be a point mass orbiting in the gravitational potential of the inner central molecular zone. The potential consists of the central black hole, the nuclear stellar cluster (pc), the nuclear stellar disk ( pc), beyond which the flattened potential is smoothly transitioned into the potential of the Galactic bar.555The Galactic bar is mesaured to have a pattern speed of , where is the local angular rotation velocity of the Milky Way (Gardner & Flynn 2010). For an observer at the solar circle, this pattern speed implies a rotation period of 124 Myr for the bar, which might influence the orbital motion for cluster distances beyond 200 pc from the GC. This period is long compared to the lifetime and the orbital timescale of each cluster ( Myr), such that we have not incorporated bar rotation in our orbital simulation. For a detailed set of parameters and the fit to the enclosed mass, see Stolte et al. (2008).
The Quintuplet orbital family is calculated using the 3D velocity derived in the previous section as the boundary condition for the cluster’s present-day motion (Fig. 8). For clarity, the left panel shows the orbits in the case that the cluster is located in front of the Galactic center today, while orbits for a present-day location behind the GC are shown in the right panel. Note that there is weak evidence from the extinction towards the Quintuplet ( mag, Hußmann et al. 2012), which is lower than the extinction of sources in the vicinity of Sgr A∗ ( mag, Schödel et al. 2010) and in the Arches cluster ( mag, Habibi et al. 2013), that the cluster is situated in front of the GC today. A location in front of the GC implies that the Quintuplet is on a prograde orbit, which is also consistent with the gas velocities in the central molecular zone (e.g., Dame et al. 2001, see especially their Fig. 3) and with the angular precession of the Galactic bar (Binney et al. 1991).
Assuming an age of 4.0 Myr (Figer et al. 1999b, but see also Liermann et al. 2010), the orbital motion was integrated backwards in time to the point of the Quintuplet’s expected origin. Within this time, the cluster concluded approximately one orbital revolution for most present-day line-of-sight distances. Only on the two innermost orbits would the Quintuplet have completed several revolutions within its present lifetime. The past and future orbits and the cluster’s approach to the center of the gravitational potential are analysed in Fig. 9.
If the cluster is located within the central molecular zone, pc, its initial distance from the supermassive black hole ranged from 20 to 230 pc (Fig. 9, top panel). Only in a narrow range of orbital solutions was the cluster located close to the supermassive black hole during its first circumnuclear passage (see dashed line in Fig. 9, top panel). Especially on the innermost orbits, the natal cloud of the Quintuplet had to approach the GC to within less than 100 pc, well inside the central molecular ring. Even if the progenitor cloud was a member of the central molecular zone, it did not follow the Keplerian orbits with moderate velocities as found in the central star-forming ring (Molinari et al. 2011). Instead, the innermost orbits require that the Quintuplet’s parental cloud had an improbable inward velocity that let to a strong deviation from a circular orbit (see Fig. 8).
The uncertainty in the proper motion of the cluster, km/s, is used to model the uncertainty in the orbital parameters. Minimum velocity orbits were calculated assuming a present-day proper motion of 117 km/s, and maximum velocity orbits were derived from a present-day proper motion of 147 km/s. The present-day 3D minimum and maximum orbital velocities then correspond to 155 and 180 km/s when combined with the radial velocity of 102 km/s. The uncertainty in the closest and furthest approach to Sgr A∗ and the initial cluster velocity at its presumed birth time are displayed as grey areas around the lines, which represent the orbital parameters for the measured proper motion of km/s. It is particularly striking that the closest and furthest approach from Sgr A∗ do not change substantially given the uncertainty in the velocity measurement. This is true for both the initial orbit (integrated backwards to the cluster’s presumed origin) and the next revolution around the GC (see Fig. 9). The maximum velocity in the next (future) orbit is most sensitive to the velocity uncertainty on the few innermost orbits where the cluster is proceeding very close to Sgr A∗, as expected. The largest uncertainty is observed in the initial velocity. The initial velocity depends severely on the exact point of the cluster’s origin. If the velocity is read off slightly earlier along the orbit (for a faster orbit or a slightly older cluster age, see also Fig. 8), the cluster will have moved to a different location in the gravitational potential. Likewise, if the initial velocity is read off closer to its present position (for a slower orbital motion or a slightly younger cluster age), the velocity can have changed substantially. As a consequence, the grey areas in the second panel of Fig. 9 partially represent a phase shift. For the minimum velocity orbit with km/s the slow cluster motion implies a stronger influence from the gravitational potential, and hence more variation in the velocity at each position. In summary, while the exact value of the initial velocity of the Quintuplet is sensitive to the uncertainty in the present-day proper motion, both the minimum and maximum velocities as well as the closest and furthest approach from the center of the Galaxy are robust against the measured proper motion uncertainty.
3.4 The Quintuplet’s approach to SgrA∗
Early after the discovery of the central clusters, Gerhard (2001) suggested that inspiraling clusters might fuel the young stellar population surrounding the supermassive black hole. Follow-up simulations by Kim & Morris (2003) and Portegies Zwart et al. (2002) suggested that clusters need be on eccentric orbits or need extreme properties in terms of cluster density and mass in order to deposit stars near Sgr A∗. The eccentric orbits suggested by our simulations for the Quintuplet might provide the necessary setup for the cluster to closely approach the nucleus. In order to evaluate how close the Quintuplet could possibly have come to the central parsec, the properties of the next full orbit after the present-day location are also shown in Fig. 9. There is only one extreme case where the cluster would migrate into the inner few parsecs. For a line-of-sight distance of 20 pc behind the GC today, the cluster could have come as close as 2 pc to Sgr A∗ during its 4 Myr lifetime (at an age of 1.1 Myr), and it would again pass Sgr A∗ with a minimum distance of pc with a 3D orbital velocity of 380 km/s at an age of 7.2 Myr on this orbit. According to these simplistic simulations, the cluster would need to be at a line-of-sight distance between 10 and 40 pc behind the GC today in order to reach the central 10 pc around Sgr A∗. The high velocity of 300-400 km/s of the cluster during the passage through the inner few parsecs limits the number of stars that could have been tidally stripped. Even in the case of the most eccentric orbit, the nuclear population of more than 80 young, early-type stars residing in the central parsec today (Bartko et al. 2010, Do et al. 2013) could not easily be explained by tidal stripping from the Quintuplet cluster. Given its likely location in front of the GC today, an interaction between the cluster and the nuclear population or the supermassive black hole seems quite unlikely.
3.5 Orbital inclination
In Fig. 10, the minimum and maximum elevations above the Galactic plane are compared for both the Arches and the Quintuplet clusters. These extrema are derived for the entire duration of each cluster’s orbit from its origin (2.5 and 4.0 Myr ago, respectively) until 8 Myr into the future from their present-day location. For most orbits, the Quintuplet cluster remains closer to the Galactic plane than the Arches. This results directly from the current location of the Quintuplet very close to the disk plane, and the negligible out-of-the-plane motion component. The typical out-of-the-plane () motion is similar for all orbits where the Quintuplet remains far from the nucleus. Here, the cluster stays within pc of the Galactic plane for most orbits, and in some cases at line-of-sight distances of 100-200 pc behind the GC today reaches a maximum -elevation of 12 pc. Only for orbits where the cluster enters the zone of influence of the nuclear cluster and black hole, migrating to distances of a few parsecs from the gravitational center, is the orbit heavily perturbed. In these cases, the orbital motion can reach altitudes of as much as 60 pc below and 40 pc above the Galactic plane (Fig. 10). Exclusively at present-day line-of-sight distances of 20 to 30 pc behind the GC, does the Quintuplet penetrate as close as 2 to 4 pc into the gravitational center. The high velocities cause the cluster to experience sling-shot perturbations out of the Galactic plane.
This general pattern is similar for the Arches orbit (Fig. 10). Yet, the Arches’s current position 10 pc above the plane causes the maximum elevation to remain at 10 to 20 pc for most orbits, such that the cluster crosses the Galactic plane multiple times during one orbit. Even with the revised, and slightly lower, 3D orbital velocity of 172 km/s, which facilitates the inward motion of the cluster, the Arches never penetrates the inner 5 pc of the nucleus. The Arches therefore does not experience equally dramatic sling-shot perturbations, and stays within distances of pc above and below the Galactic plane during all orbits up to the considered timescale of 8 Myr.
4 Discussion
4.1 Deviation from a circular orbit
The 3D orbital velocity of the Quintuplet cluster appears high in comparison to the circular velocity at its projected distance of 31 pc from the GC. Assuming the enclosed mass estimates from Launhardt et al. (2002), the circular velocity at pc is only 90 km/s for an enclosed mass of , and stays below 150 km/s out to a galactocentric radius of 100 pc (). Between 100 and 200 pc distance from the GC, the Keplerian velocity theoretically increases to 190 km/s according to an increase in the enclosed mass from at 100 pc to at 200 pc. Note, however, that such velocity values are not measured in objects located in the central molecular zone. The study of OH/IR stars by Lindqvist et al. (1992) constrained terminal radial velocities to less than 120 km/s at all radii (see also the detailed discussion in Stolte et al. 2008). Likewise, radio surveys of dense clouds in the inner central molecular zone indicate velocities below 120 km/s for the x2 orbital family (Dame et al. 2001, their Fig. 3, see also Binney et al. 1991). From this observational evidence, a 3D orbital velocity of 167 km/s is substantially higher than maximum radial velocities observed in both clouds and stars in the central molecular zone. The simulations of the cluster orbit support the expectation that the motion of the cluster is not consistent with a circular orbit. One could argue that the cluster might be located several hundred parsecs in front of the Galactic center. However, the recently obtained HST/NICMOS Paschen alpha survey of the Galactic center (Wang et al. 2010, Dong et al. 2011) clearly shows strong interaction between the massive cluster stars and the nearest cloud (Fig. 11). The pillars and fringes at the cloud edge in front of the cluster’s motion indicate that the ionising radiation and wind pressure from the Wolf-Rayet cluster members is eating into the cloud towards which the cluster is presently moving.
Three-dimensional hydrodynamic simulations of clumpy cloud surfaces exposed to ionising radiation from a single nearby O-type star result in pillared structures on timescales of 2 to yrs (Mackey & Lim 2010). Comparing the radial velocity of the Quintuplet, km/s, with the cloud velocity of km/s at the location of the Sickle (Molinari et al. 2011, see their Fig. 4), the cluster would move 15 pc for a relative velocity of km/s within yrs. However, the Quintuplet is located only 2-3 pc from the illuminated cloud rim in projection at the present epoch. The higher radiation and wind pressure of O-type and Wolf-Rayet stars (Liermann et al. 2009, Hußmann et al. 2012) might accelerate the carving of the pillars, and the fact that no ionised rims are observed behind the direction of motion of the Quintuplet, where the cluster might have cleared its path, corroborates the suggestion that the cluster is moving towards the ionisation rim. The increasing flux incident on the cloud rim during the cluster’s approach might cause additional instabilities aiding in the formation of the pillars. Such a scenario was suggested for the individual, rapidly moving star Per (Elmegreen & Elmegreen 1978), and will be enhanced for the large number of high-mass stars in the Quintuplet. These authors already suggested a shortened formation timescale for pillared structures in the case of relative motion between the ionising star and the cloud, accelerated further by instabilities forming at the cloud rim. It would be interesting to probe whether the cluster-cloud interaction is capable of triggering the next generation of star formation. Right now, however, there is no direct evidence for young stellar objects in the compressed cloud. The interaction provides stringent evidence that the Quintuplet cluster is indeed moving through the CMZ, implying a location at a radial distance of less than 200 pc from the GC at the present time and a non-circular motion of the Quintuplet with significant differences between the cluster’s apocenter and pericenter passages.
4.2 Comparison with the Arches cluster
A revised version of the Arches orbits for a proper motion of 172 km/s for the cluster with respect to the field (Clarkson et al. 2012) is shown in Fig. 12. Only orbits where the Arches is located in front of the GC today are directly compared with the respective orbits of the Quintuplet cluster. The orbits where the Arches cluster is behind the GC today are very similar albeit less chaotic and even more regularly nested than the orbits of the Quintuplet cluster shown for a location behind the GC today in Fig. 8. For a location behind the GC today, both clusters would have to be on retrograde orbits, and orbiting against the rotation direction of the Galactic bar. However, the ionisation rim near the Quintuplet along the Galactic plane in the direction of motion as well as the apparent interaction of the Arches moving into a nearby cloud observed in the radio regime (Lang et al. 2003) suggest that both clusters are comoving. A formation scenario for massive clusters on retrograde orbits would be even harder to find. While the Arches velocities suggest a family of self-similar, nested orbits, the Quintuplet orbital family displays more intersection points. It is striking that especially the approach of the Arches and Quintuplet clusters to the supermassive black hole is very sensitive to the differences in their 3D orbital velocities. In the case of the Arches, the simulations forced us to conclude that the cluster is not able to reach the central parsec before it disperses into the GC field ( pc at all times and for all line-of-sight distances, see also the discussion in Stolte et al. 2008). The particular motion vectors of the Quintuplet, on the other hand, and its location on the Galactic plane, promote extreme orbits for line-of-sight distances of 20-30 pc behind the GC today, where the cluster approaches the center of gravity to within 2-4 pc at closest approach. Yet, as discussed above, this would require the Quintuplet to be on a retrograde orbit.
The fact that both the Quintuplet and the Arches cluster appear far from a circular orbit solution has severe implications for their dynamical evolution. N-body simulations treating self-consistently the stellar component of the inner Galaxy and the internal dynamics of a dense star cluster have recently shown that clusters on eccentric orbits develop chaotic tidal tails (Fujii et al. 2008, see especially their Fig. 2). According to Kim & Morris (2003) and Fujii et al. (2008), clusters on eccentric orbits migrate faster towards the center than the clusters in earlier circular orbit models (e.g., Kim et al. 2000, Portegies Zwart et al. 2002). The development of chaotic tidal tails additionally implies that tidally stripped stars can end up in positions far away from the position of the cluster orbit, as might be evidenced in the population of dispersed Wolf-Rayet stars in the GC (Mauerhan et al. 2010b, M. Habibi et al. 2014).
Because of the more chaotic behaviour of the Quintuplet orbital family as compared to the Arches orbits and because of its older age, the location of the Quintuplet’s origin is less constrained. For the Arches, the orbit simulations suggest that the cluster likely emerged toward the upper left quadrant of the motion plane or close to the x2 orbital family (red ellipse in Fig. 12). A similar origin close to the outermost x2 orbit is likely for the Quintuplet if it is located at a line-of-sight distance of -50 to -200 pc in front of the GC today. Especially near a present line-of-sight distance of -150 to -200 pc, the origin of the Quintuplet was close to the tangent point of the x2 orbital zone indicated as the solid ellipse in Figs. 8 and 12. As we already noted in the discussion of the Arches orbit (Stolte et al. 2008), a location near the outermost x2 orbit is consistent with a formation region between the x1 and x2 orbits of the Galactic bar. This transition region is located at the outer edge of the central molecular zone, where instreaming and circumnuclear clouds are prone to collisions. This formation scenario is also consistent with both clusters being on prograde orbits, which implies a location of both clusters in front of the GC today.
Both on orbits located further inward and on orbits where the Quintuplet is located behind the GC today, the cluster would have emerged from its natal cloud at vastly different locations from the most likely place of birth of the Arches. One should keep in mind, however, that these conclusions are sensitive to the assumed Quintuplet cluster age of 4.0 Myr (one to a few orbital periods for outer and inner orbits, respectively), and that the embedded phase during which the cloud fragmented and the cluster contracted into its current dynamical state are not accounted for. Most of the orbits where the cluster is located in front of the GC today, with the exception of the innermost cases, would be consistent with a formation locus near one of the x1/x2 transition points if the cluster were slightly older ( Myr). For the case that both clusters have emerged at one of the end-points of the x2 orbital family (see Fig. 12), a consistent formation scenario of these two massive clusters is presented in the next section.
4.3 The origin of the GC clusters
The close proximity of the Arches and Quintuplet clusters in the central molecular zone, at a projected spatial separation of only 12 pc from each other, and their similar motion parallel to the Galactic plane, raise the question of whether these two clusters have a common origin, or, at least, have originated in a similar fashion. It is striking that the Arches and the Quintuplet are the only compact, massive young clusters in the central region outside the nucleus. Previously, with cluster ages of Myr for the Arches and Myr for Quintuplet, the age discrepancy was considered too large for both clusters to originate from the same molecular cloud. At the time when the Arches must have formed, the Quintuplet’s most massive stars would already have excavated the native cloud substantially, such that the formation of a second, equally massive twin would seem unlikely. This argument is somewhat diminished by the recent age dating of five hydrogen-rich Quintuplet WN stars by Liermann et al. (2010), suggesting that these stars have ages between 2.4 and 3.6 Myr, and that the main sequence OB population is in the age range of 3.3-3.6 Myr (Liermann et al. 2012). Such ages would bring both clusters much closer in their evolution, and hence would render a common origin more likely. Nevertheless, one has to bear in mind that Wolf-Rayet evolutionary models still harbour significant uncertainties. In addition, the luminosity of these objects might be biased if the WNs are located in binary systems (Liermann et al. 2010), as is the case for the Quintuplet WC members (Tuthill et al. 2006). In this case, the WNs would be affected by binary mass transfer and hence appear rejuvenated as compared to the main sequence population (see Liermann et al. 2012 for a discussion). Despite the known uncertainties in the age determination of Wolf-Rayet stars, the fact that the carbon-rich variety of WC stars is already heavily present in the Quintuplet cluster, and in fact led to its early discovery by Okuda et al. (1990) and Nagata et al. (1990), suggests a more evolved evolutionary stage than the Arches population. The WC evolutionary stage is expected to follow the WN phase after a brief hydrogen-free WN period (Crowther 2007, Martins et al. 2008). Especially the dust-rich interacting-wind binaries resolved into spectacular spiral patterns by Tuthill et al. (2006) are entirely absent in the Arches cluster. Indeed, spectral analysis suggests that all of the Arches WN population are of types WNh6-7 close to or on the high-mass main sequence, with strong hydrogen emission line spectra (Martins et al. 2008). Hence, while the exact age difference between the Arches and Quintuplet clusters is still not well established, there is strong evidence that both clusters did not form at the same time, but at least 0.5 to 1 Myr apart.
Even if the Arches and Quintuplet did not emerge from the same cloud, we may be able to identify a consistent formation scenario for both clusters that might explain their similar orbits and their present-day proximity. In extragalactic circumnuclear rings, the endpoints of the inner bar were shown recently to bring forth star clusters at regular intervals. Especially striking is the case of the spiral galaxy NGC 613, where a string of circumnuclear clusters with ages between 2-10 Myr is found emerging from both fueling points of the inner ring of circumnuclear clouds (Böker et al. 2008). This ring of young star clusters displays a continuous age sequence of clusters being formed every 2-3 Myr on each side of the inner bar. At these points, N-body simulations show strong cloud-cloud collisions after gas has efficiently streamed in through the outer bar potential (Regan & Teuben 2003, Rodriguez-Fernandez & Combes 2008, Kim et al. 2011, see also the early gas flow models by Athanassoula 1992). In these simulations, dust lanes form along the inner x1 orbit, and meet infalling clouds in the circumnuclear ring at the contact points between the x1 and x2 orbital families. The efficiency of this mechanism suggests that this scenario should be present in most, if not all, gas-rich barred spirals, at least in the case that an inner bar, or circumnuclear ring, is formed from the in-streaming material. In fact, numerous galaxies are found to have circumnuclear rings lined with young star clusters (Mazzuca et al. 2008, and references therein), with 50% of their sample displaying a systematic age sequence. As pointed out in the detailed discussion of Mazzuca et al. (2008), the youngest Hii regions frequently emerge near the contact points between the observed dust lanes and the circumnuclear rings, as expected from the simulations.
In the Milky Way, the existence of an inner bar is still disputed, as such characteristics are much more difficult to corroborate by observations through the dense Galactic plane (see the discussion in Rodriguez-Fernandez & Combes 2008). Nevertheless, the circumnuclear ring of molecular clouds observed in extragalactic systems can be identified with the central molecular zone, which is comparable in its spatial dimensions ( pc) to the circumnuclear rings in other spiral galaxies (see Table 1 in Mazzuca et al. 2008). In addition, the presence of a star-forming ring was recently postulated by Molinari et al. (2011), and several of the dense, compact clouds along this ring are expected to form massive clusters comparable to the Arches and Quintuplet systems (Longmore et al. 2012, 2013). If the large outer bar is responsible for fueling the central molecular zone, the points where infalling clouds are colliding with the existing circumnuclear ring at a radius of about 200 pc would be a pre-destined place for cluster formation. In this scenario, the most massive clusters would form in pseudo-regular intervals, whenever a cloud having a sufficient mass reservoir collides with material in the central molecular zone. This would naturally explain how both clusters could have inherited similar velocities and orbital motions. In addition, if an inner bar exists, the endpoints of this bar would be the places where gas is channeled in. As seen in extragalactic systems, in-streaming clouds collide with the circumnuclear ring of molecular clouds at these contact points (Mazzuca et al. 2008), rendering them preferred cluster-formation loci. Following the discussion in Molinari et al. (2011) and Longmore et al. (2013), Sgr B2 and Sgr C represent the overdensities at the endpoints of the star-forming ring, which would then trace the cluster formation loci in the Milky Way’s CMZ. The approximate starting points of the orbits (thick triangles in Fig. 8 and Fig. 12) suggest that both clusters formed at different loci near the outer boundary of the CMZ. In this case, the spatial proximity of the clusters would be a coincidence, but would be reconciled by the fact that they formed at similar Galactocentric radii, and hence again are found on similar orbits.
While the recent observations support cluster formation from dense CMZ clouds, it remains an open question how these clouds migrate into the central region. One possibility to channel gas into the CMZ, and possibly to smaller radii, is provided by models of nested bars. A nested bar model with a 3.5 kpc outer bar and a nested 150 pc inner bar can explain several of the kinematic features in the longitude-velocity diagram towards the inner Galaxy in a self-consistent gas flow model (Rodriguez-Fernandez & Combes 2008, see also Namekata et al. 2009). In particular, the molecular cloud complex corresponds in this model to the far branch of an inner two-arm spiral pattern that channels gas from the 300-800 pc HI ring into the central molecular zone. The lack of a counterpart of the complex is interpreted as only one of the two theoretically predicted spiral arms being active at the present time. Intriguingly, this complex is located in the same quadrant where the Quintuplet and Arches orbit simulations suggest a possible formation locus of these star clusters. The projected distance of the complex from the Galactic center is 180 pc, consistent with the formation of the star clusters at the edge of the x2 orbital zone.
The present set of large-scale simulations of the fueling of the central molecular zone in the framework of barred potentials cannot trace particles down to the spatial scales required to probe star formation. Due to efficiency and the large spatial scales involved, self-gravity and feedback effects have so far been ignored. Recent high-resolution simulations of the inner few hundred parsecs conducted by Kim et al. (2011) include self-gravity and feedback for the first time. It will be intriguing to see whether these N-body simulations of infalling cloud particles can account for the formation of massive clusters on non-circular orbits, such as suggested from the Arches and Quintuplet orbital solutions.
5 Summary and Conclusions
We obtained the proper motion of stars in the Quintuplet cluster and the field population along the line of sight towards the Galactic center from three epochs of high-spatial resolution near-infrared imaging with Keck and VLT. The relative proper motion of the cluster with respect to the field is derived to be km/s from two-dimensional fits to the proper motion density distribution. The motion axis is consistent with the Quintuplet cluster moving along the Galactic plane, while the motion perpendicular to the plane is negligible. Combining the proper motion with the known radial velocity leads to a 3D orbital motion of km/s, with the cluster moving outwards from the Galactic center and receding from the Sun. This orbital motion is surprisingly similar to the orbital motion of the Arches cluster (Stolte et al. 2008, Clarkson et al. 2012).
Simulations of the cluster orbit in a multi-component potential of the inner Galaxy suggest that the orbit of the cluster is non-circular if the cluster is located in the central molecular zone ( pc). A revised orbit solution for the Arches cluster is also presented. Tracing the orbital motion of both clusters back for 2.5 and 4.0 Myr to the possible points of origin, a common cluster formation scenario for the Arches and Quintuplet clusters is identified if the Quintuplet is at a line-of-sight position in front of the GC today. In this scenario, the cluster-forming clouds are located inside the inner 200 pc of the CMZ and at the far side of the Galactic center, towards increasing Galactic longitudes. When compared to simulations fueling the central molecular zone with nested bar potentials, this location is intriguingly similar to the tentative collision point of the rearward spiral arm of the inner bar. Today, the ° molecular complex has accumulated a total mass of at this position (Oka et al. 1998). Although there are presently no signposts of star formation in the form of HII regions in this complex, it is conceivable that the next compact, massive cluster will be forged in the near future at this exceptional locus. Further simulations might provide insight as to whether the collisional properties of the infalling gas into the central molecular zone are sufficient to explain the high velocities of the Arches and Quintuplet clusters, and their non-circular orbits.
The current velocity measurement provides the basis for a new set of simulations to reconstruct the tidal losses over each cluster’s lifetime. Especially the diffusion of high-mass stars from the young population might have given rise to the population of apparently isolated young, high-mass stars in the GC. These simulations would solve the mystery of apparently isolated high-mass star formation in the GC environment. Observationally, increasing the proper motion accuracy with more epochs over a longer time baseline will lead to the measurement of the internal velocity dispersion of the Quintuplet cluster, for which we obtain an upper limit of km/s. An accurate measurement of the internal velocity dispersion will additionally constrain the virial state and the long-term dynamical stability of the young star cluster in the Galactic center tidal field.
This work is based on observations obtained at the VLT Paranal and Keck, Mauna Kea observatories, and the authors are most grateful to the support teams of both facilities. This work would not have been possible without the intense effort and dedication of the Keck LGS-AO staff. We are deeply greatful for their support enabling these observations. The W. M. Keck Observatory is operated as a scientific partnership among the California Institute of Technology, the University of California, and the National Aeronautics and Space Administraction. The Observatory was made possible by the generous financial support of the W. M. Keck Foundation. The authors wish to recognize and acknowledge the very significant cultural role and reverence that the summit of Mauna Kea has always had within the indigenous Hawaiian community. We are most fortunate to have the opportunity to conduct observations from this mountain. We also sincerely thank the VLT/NACO staff for their substantial efforts to provide high-quality observations across our multi-epoch campaigns.
| UT Date | Instrument | pixscale | FOV | Filter | [s] | coadds | [s] | FWHM [mas] | Strehl | ||
|---|---|---|---|---|---|---|---|---|---|---|---|
| 2003 July 23 | VLT/NACO | 27.1 | 27′′ | 2.0 | 30 | 16 | 16 | 960 | 75-83 | 7-10% | |
| 2003 July 22 | VLT/NACO | 27.1 | 27′′ | 20.0 | 2 | 16 | 16 | 640 | 71-82 | 3-5% | |
| 2008 July 24 | VLT/NACO | 27.1 | 27′′ | 2.0 | 15 | 44 | 33 | 990 | 73-81 | 4-12% | |
| 2008 May 14 | Keck/NIRC2 | 9.942 | 10′′ | 1.0 | 30 | 58 | 33 | 990 | 57-70 | 20-34% | |
| 2009 May 3-4 | Keck/NIRC2 | 9.942 | 10′′ | 1.0 | 30 | 117 | 60 | 1800. | 50-62 | 28-47% |
The pixel scale is given in milliarcseconds/pixel, FOV is the field of view, is the exposure time of the individual integration, coadds the number of co-added individual exposures in each frame, the total number of frames observed, the total number of high-quality frames entering the deep drizzled image, and is the total integration time in seconds of this deep image. FWHM provides the resolution of the deep image after drizzling in milliarcseconds, and Strehl an estimate of the Strehl ratio.
| PM data set | Number of sources | notation |
|---|---|---|
| NACO 2003 & NIRC2 2008 & NIRC2 2009 | 119 | 3-epoch sample |
| NACO 2003 & NIRC2 2009 | 107 | 2-epoch sample |
| NACO 2003 & NIRC2 2008 & 2009 all | 226 | cluster center sample |
| NACO 2003 & NACO 2008 | 2137 | extended field sample |
| Seq | RA | DEC | Kp2009 | eK2009 | Kp2008 | eK2008 | Ks2003 | eK2003 | |||||
|---|---|---|---|---|---|---|---|---|---|---|---|---|---|
| [”] | [”] | [mas/yr] | [mas/yr] | [mas/yr] | [mas/yr] | [mag] | [mag] | [mag] | [mag] | [mag] | [mag] | ||
| 1 | -0.000 | 0.000 | -0.1561 | 0.1853 | -0.4454 | 0.1522 | 9.404 | 0.144 | 9.302 | 0.154 | 9.858 | 0.157 | 0.845 |
| 2 | -0.092 | -2.244 | 0.0557 | 0.3342 | 0.4961 | 0.2287 | 8.412 | 0.143 | 8.252 | 0.154 | 8.914 | 0.163 | 0.840 |
| 3 | -4.317 | 0.541 | -1.0946 | 0.2427 | 0.0388 | 0.2179 | 7.606 | 0.164 | 7.738 | 0.154 | 7.930 | 0.159 | 0.142 |
| 4 | 0.697 | 3.326 | 0.1949 | 0.1281 | 0.4563 | 0.2261 | 9.256 | 0.140 | 9.295 | 0.154 | 9.591 | 0.133 | 0.908 |
Positions are given as offsets relative to the Quintuplet proper member Q12 (RA 17:46:15.13, DEC -28:49:35.07). The proper motion corresponds to the motion in the East-West direction (, with Right Ascension and Declination), corresponds to the North-South motion of each star. Photometry of all three epochs is also provided, with photometry of stars with mag taken from the NACO 2003 2s exposures, while fainter photometry is supplemented from the deep 20s integrations. Columns 5 and 7 contain the proper motion uncertainties in each direction, and columns 9, 11, and 13 contain the photometric uncertainties in each epoch. Column 14 provides a membership probability indicator. Monte Carlo simulations of the proper motion plane for one of the outer cluster fields (the Pistol field, Field 2 in Hußmann 2014) suggest that cluster and field stars are most efficiently separated with a formal probability threshold of (see Sections 4.2.2.1 to 4.2.2.3 in Hußmann (2014) for details). Table 3 is published in its entirety in the electronic edition of ApJ, with the first rows shown here as guidance regarding its form and content.
| Seq | RA | DEC | Ks2003 | eK2003 | Ks2008 | eK2008 | |||||
|---|---|---|---|---|---|---|---|---|---|---|---|
| [”] | [”] | [mas/yr] | [mas/yr] | [mas/yr] | [mas/yr] | [mag] | [mag] | [mag] | [mag] | ||
| 1 | 10.754 | -3.031 | -0.1680 | 1.0420 | 0.1060 | 0.9900 | 9.359 | 0.139 | 9.040 | 0.015 | 0.303 |
| 2 | 3.622 | 0.268 | -0.2560 | 0.4310 | -0.3700 | 0.5930 | 9.379 | 0.051 | 8.970 | 0.007 | 0.579 |
| 3 | -0.300 | 5.447 | -3.0900 | 0.2830 | -0.6450 | 0.7540 | 9.385 | 0.064 | 9.511 | 0.007 | 0.000 |
| 4 | 0.695 | 3.338 | -0.3330 | 0.2210 | 0.1230 | 0.3020 | 9.415 | 0.024 | 9.278 | 0.003 | 0.838 |
As in Table 3, positions are given relative to the Quintuplet proper member Q12 (RA 17:46:15.13, DEC -28:49:35.07). The proper motion corresponds to the motion in the East-West direction (, with Right Ascension and Declination), corresponds to the North-South motion of each star. Photometry is provided for both NACO epochs, with photometry of stars with mag taken from the NACO 2003 2s exposures, while fainter photometry is supplemented from the deep 20s integrations. Columns 5 and 7 contain the proper motion uncertainties in each direction, and columns 9 and 11 contain the photometric uncertainties in each epoch. Column 12 provides a membership probability indicator (see notes to table 3 for explanation). Table 4 is published in its entirety in the electronic edition of ApJ, with the first rows shown here as guidance regarding its form and content.
| Data set | NIRC2-NACO all | 3-epoch | NACO-NACO |
|---|---|---|---|
| 215 | 119 | 1968 | |
| East-West cluster [mas/yr] | -0.04 | -0.05 | 0.01 |
| North-South cluster [mas/yr] | 0.03 | 0.07 | 0.08 |
| East-West field [mas/yr] | 1.61 | 2.09 | 1.69 |
| North-South field [mas/yr] | -2.66 | -3.16 | -2.32 |
| separation [mas/yr] | 3.16 | 3.87 | 2.93 |
| GP angle [degrees] | 33.0 | 32.3 | 32.8 |
| semi-major axis cluster [mas/yr] | 0.63 | 0.54 | 0.88 |
| semi-minor axis cluster [mas/yr] | 0.61 | 0.49 | 0.62 |
| semi-major axis field [mas/yr] | 5.28 | 4.66 | 5.75 |
| semi-minor axis field [mas/yr] | 2.67 | 2.39 | 2.41 |
| fraction of cluster stars | 0.37 | 0.55 | 0.27 |
Columns represent the () position of the fitted cluster and field ellipses ( East-West cluster, North-South cluster, East-West field, North-South field), the separation of the centroids, the angle of the field ellipse indicating the orientation of the Galactic plane, the semi-major and -minor axes of the cluster and field ellipses (2-sigma gaussian parameters of each fit), and the fraction of cluster stars relative to the fitting sample size. The separation between the fitted cluster and field ellipses denotes the relative motion of the Quintuplet cluster with respect to the field.
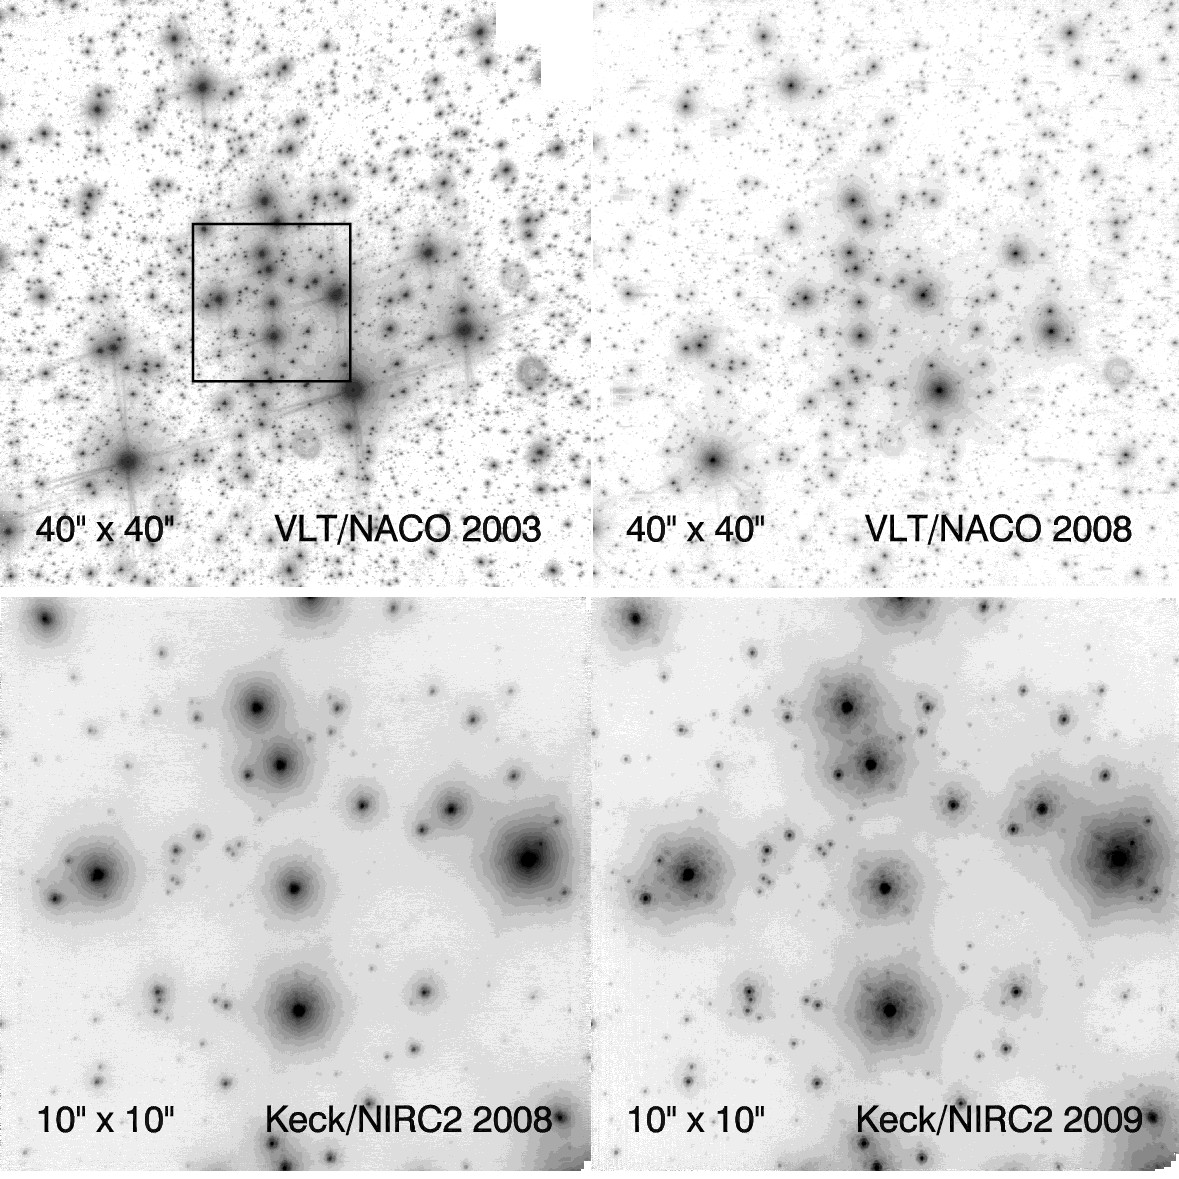
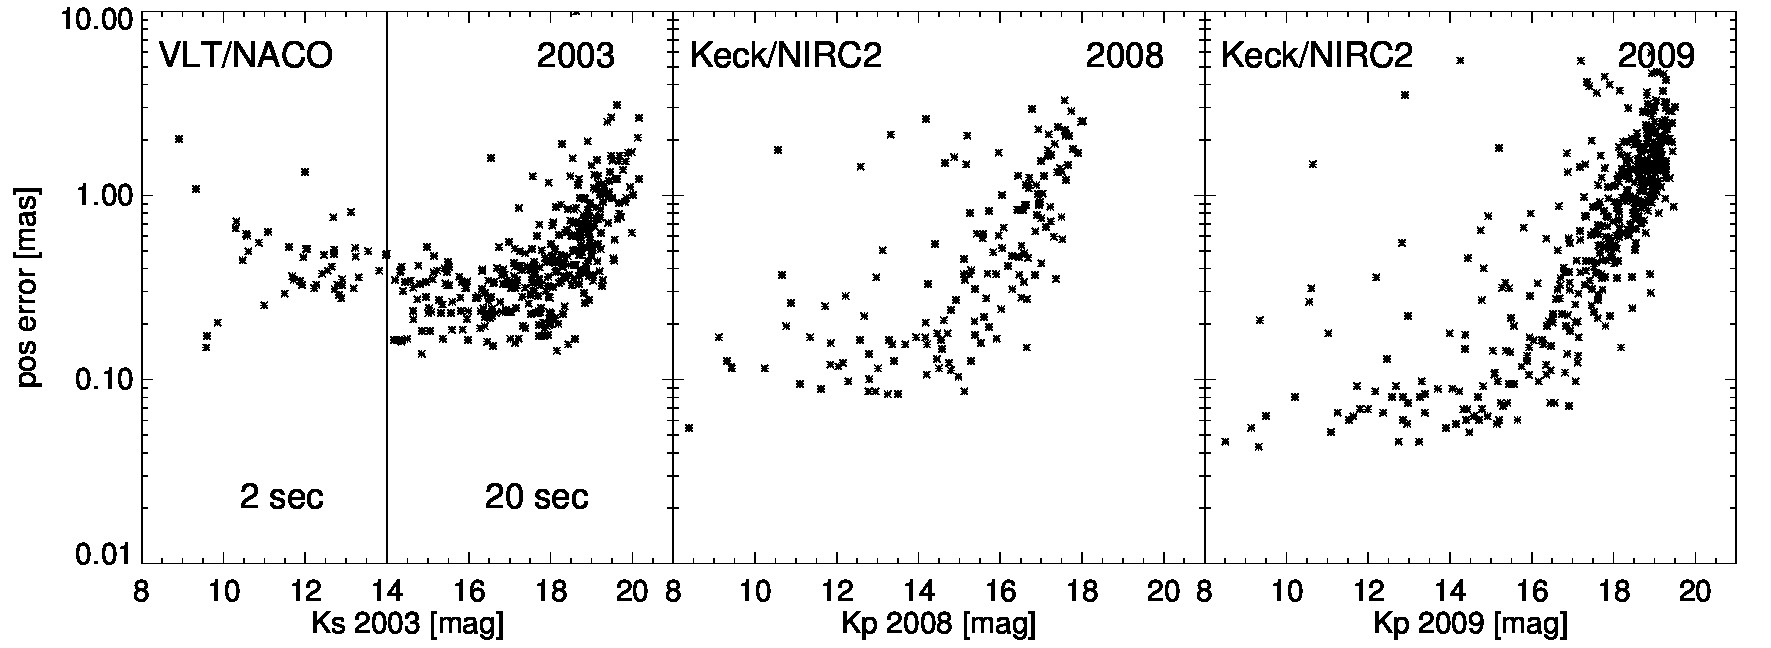
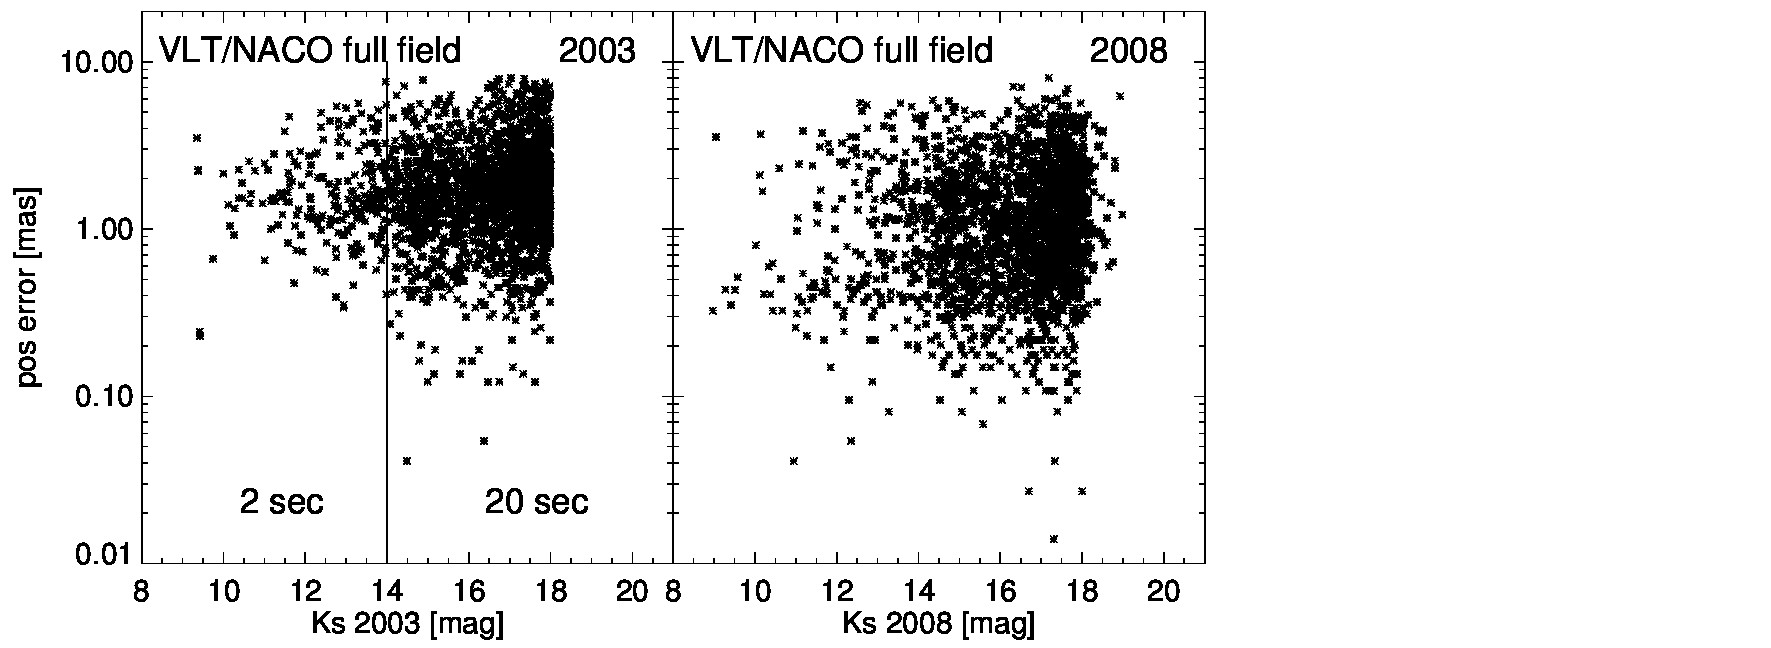
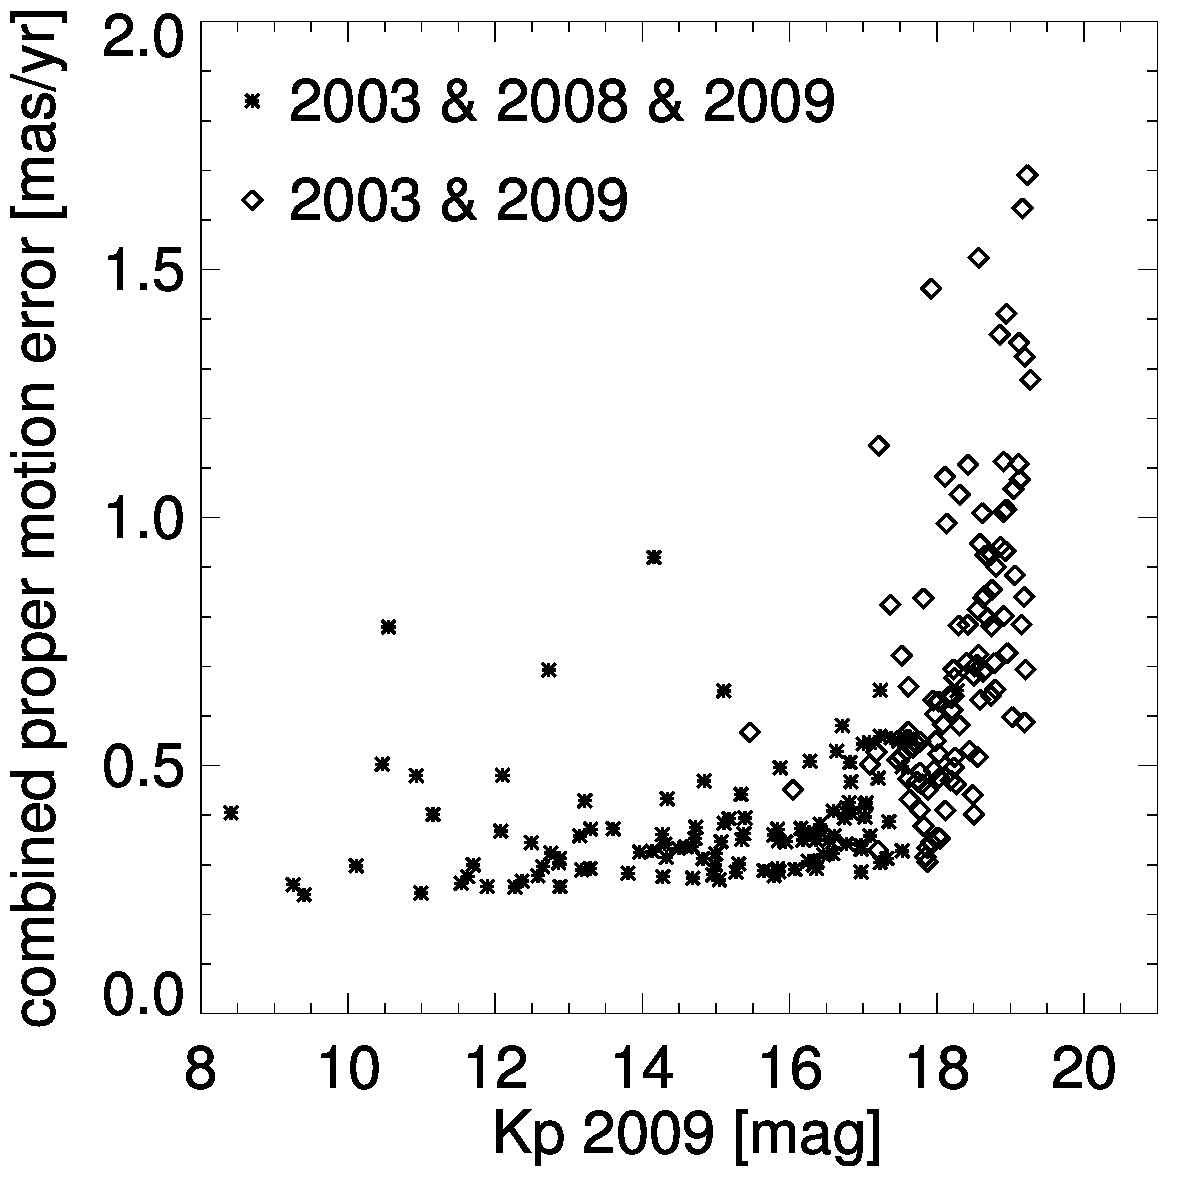
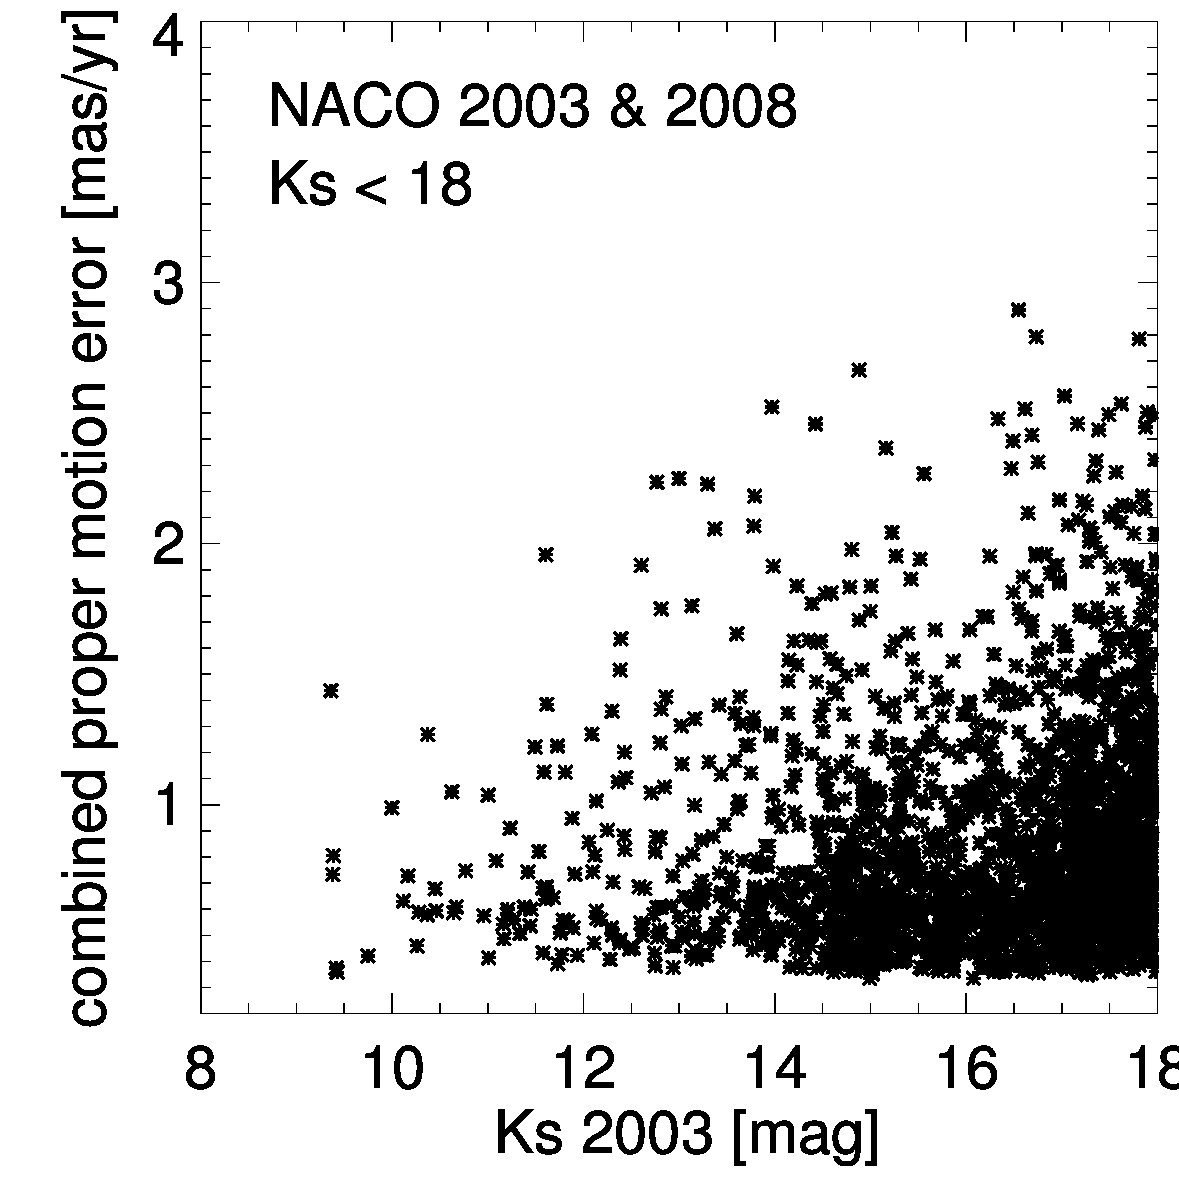
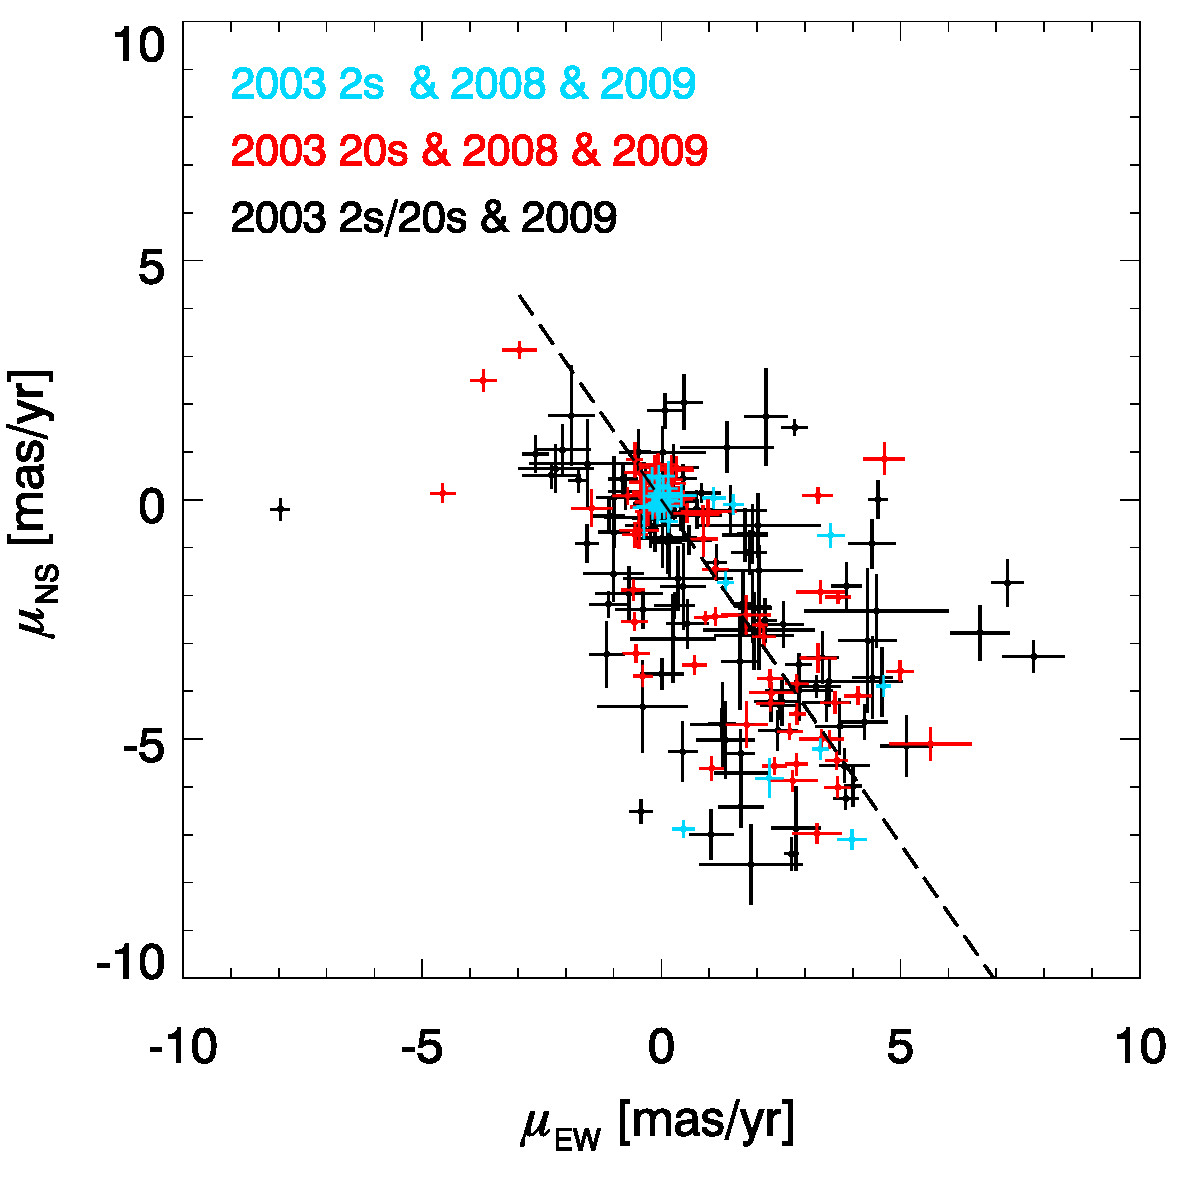
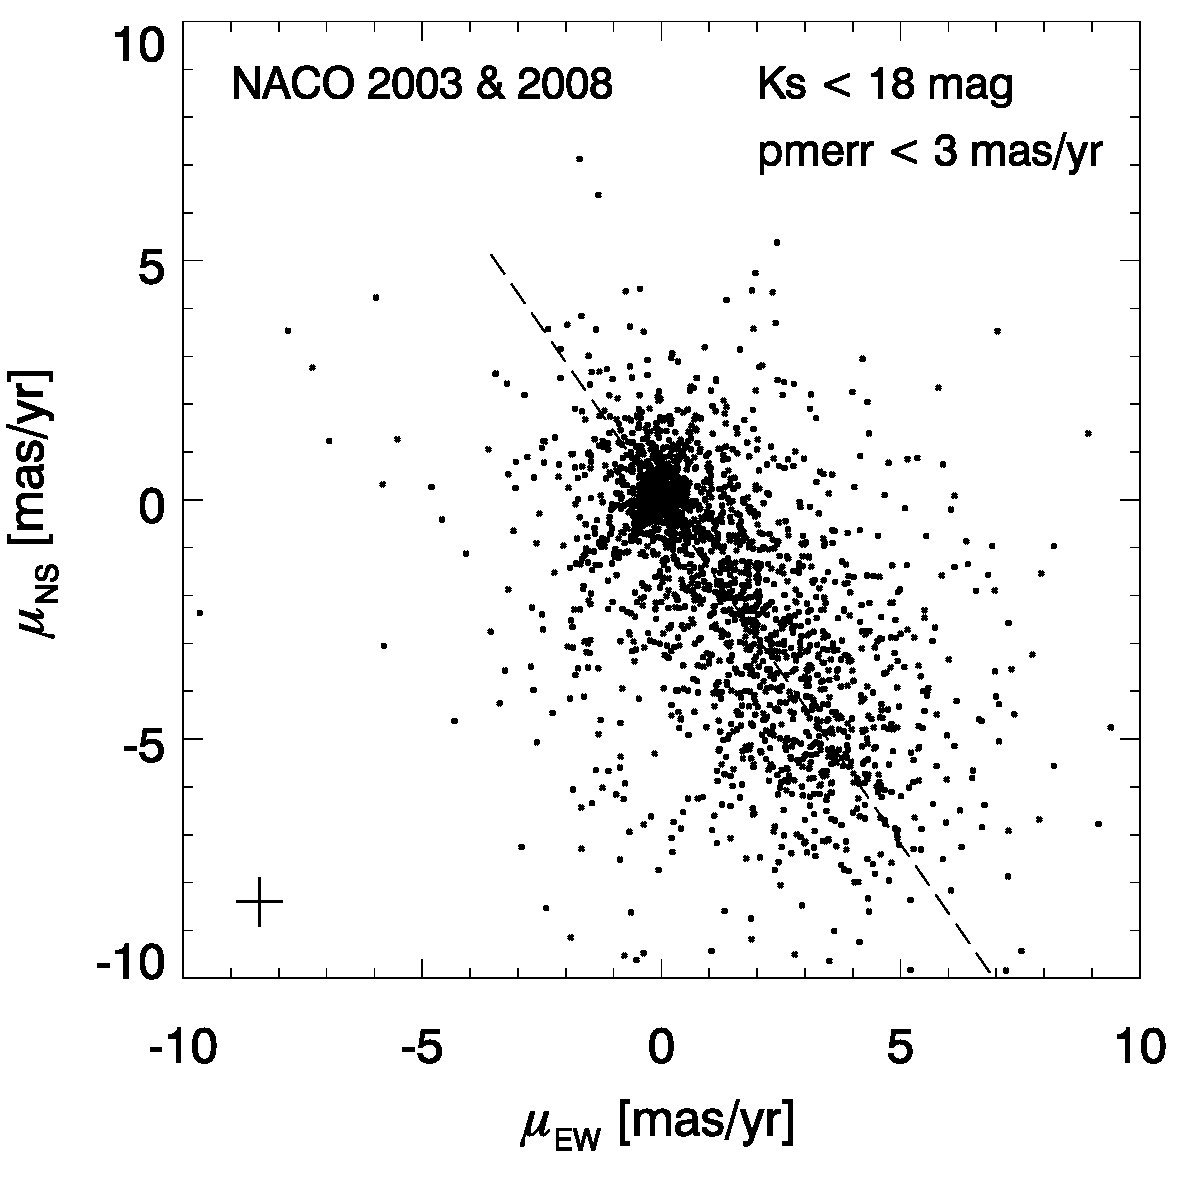
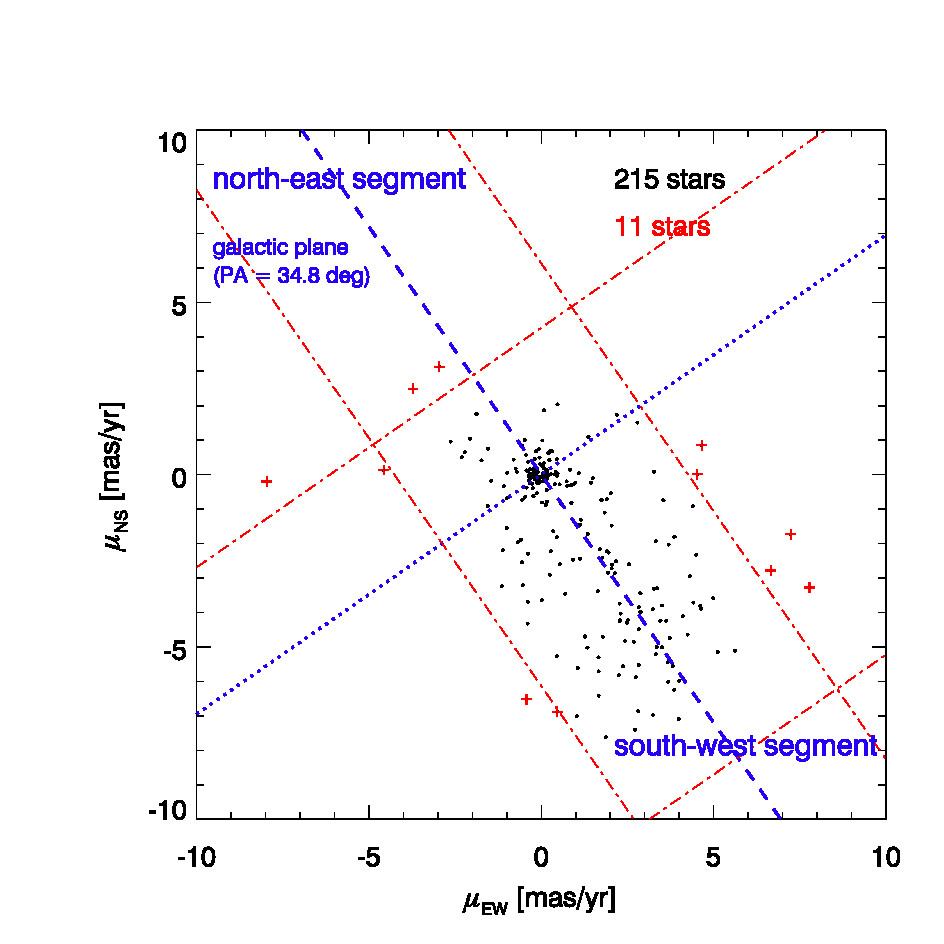
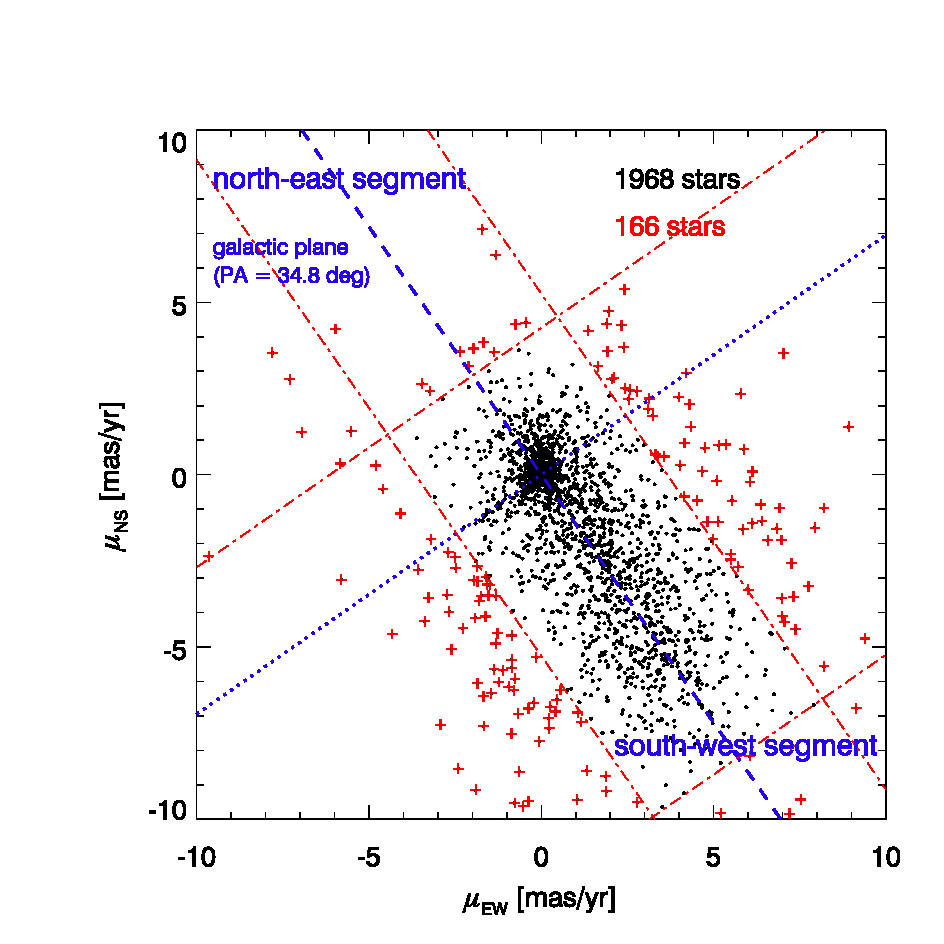
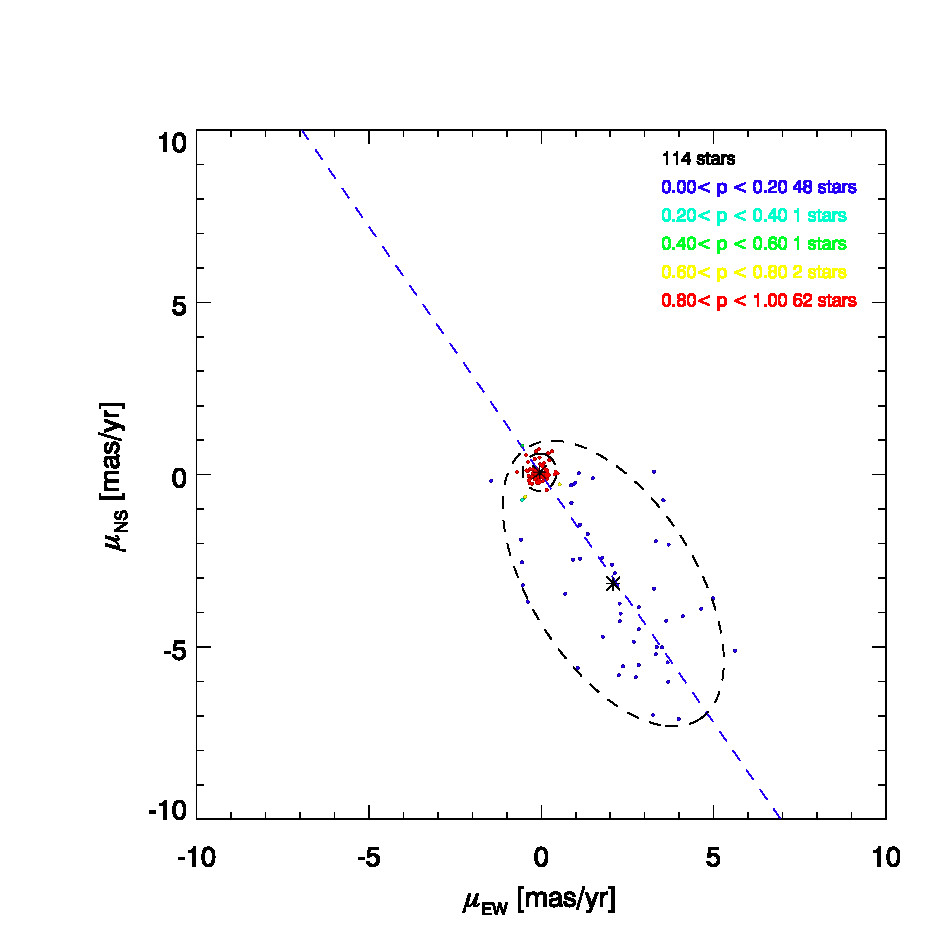
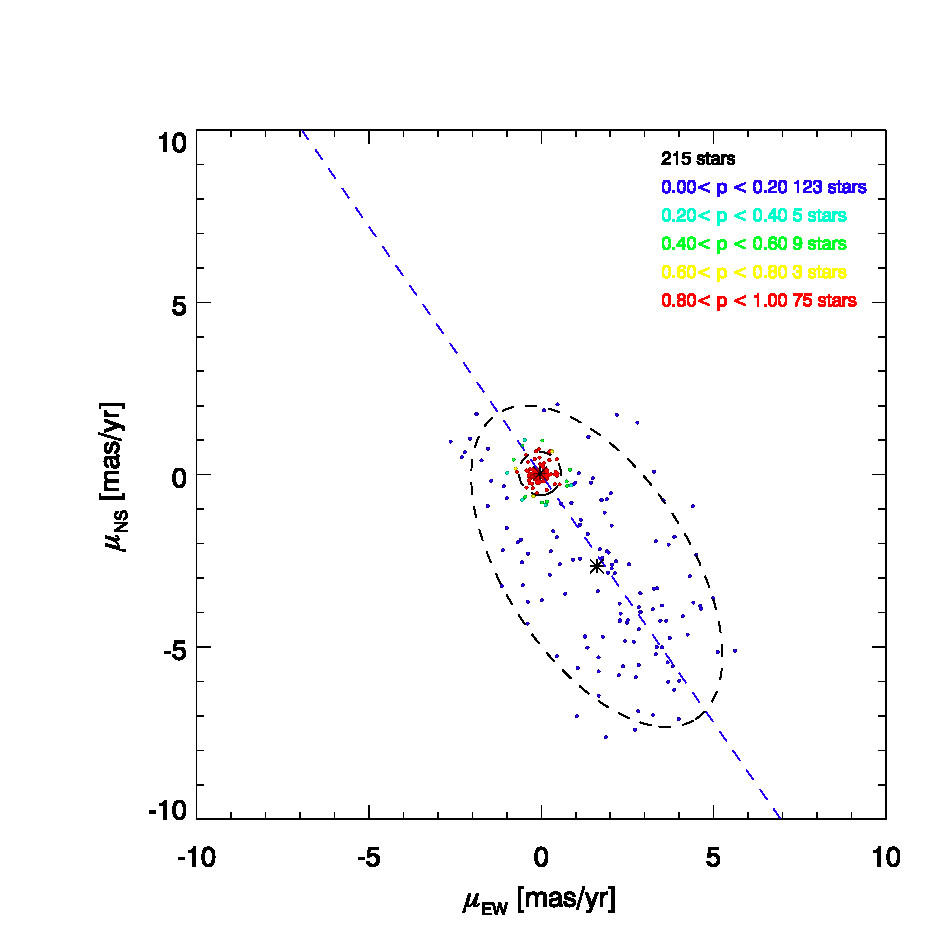
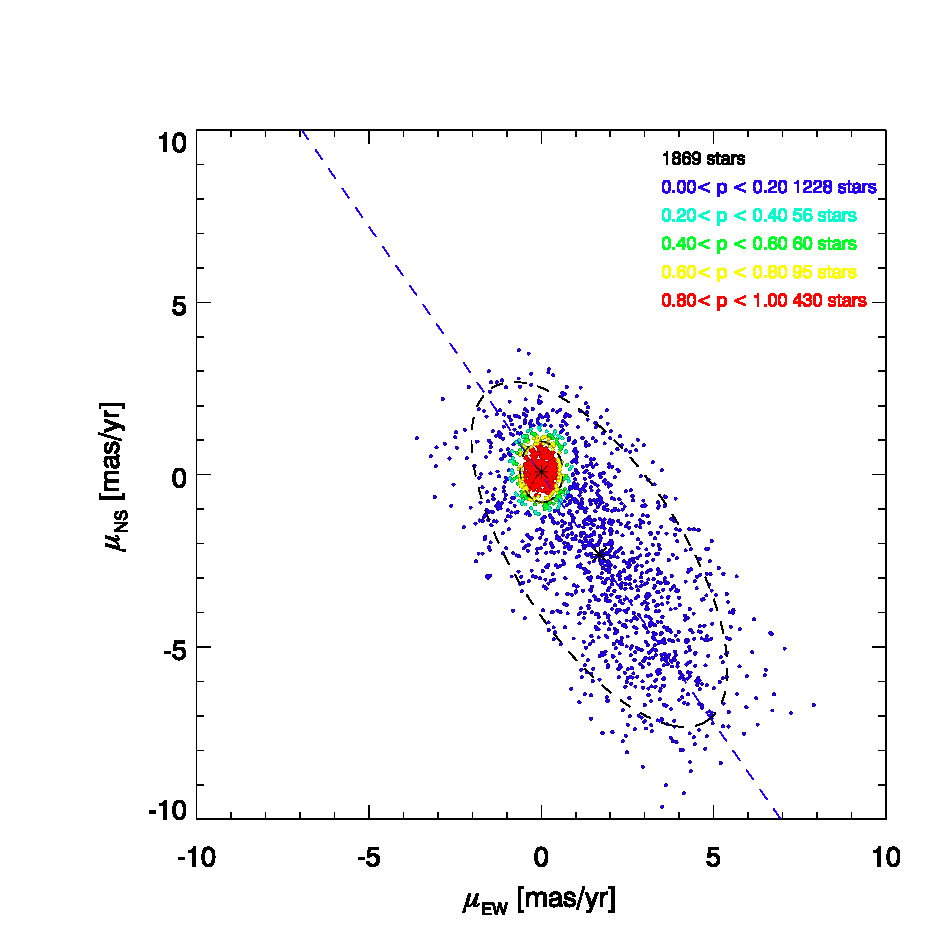
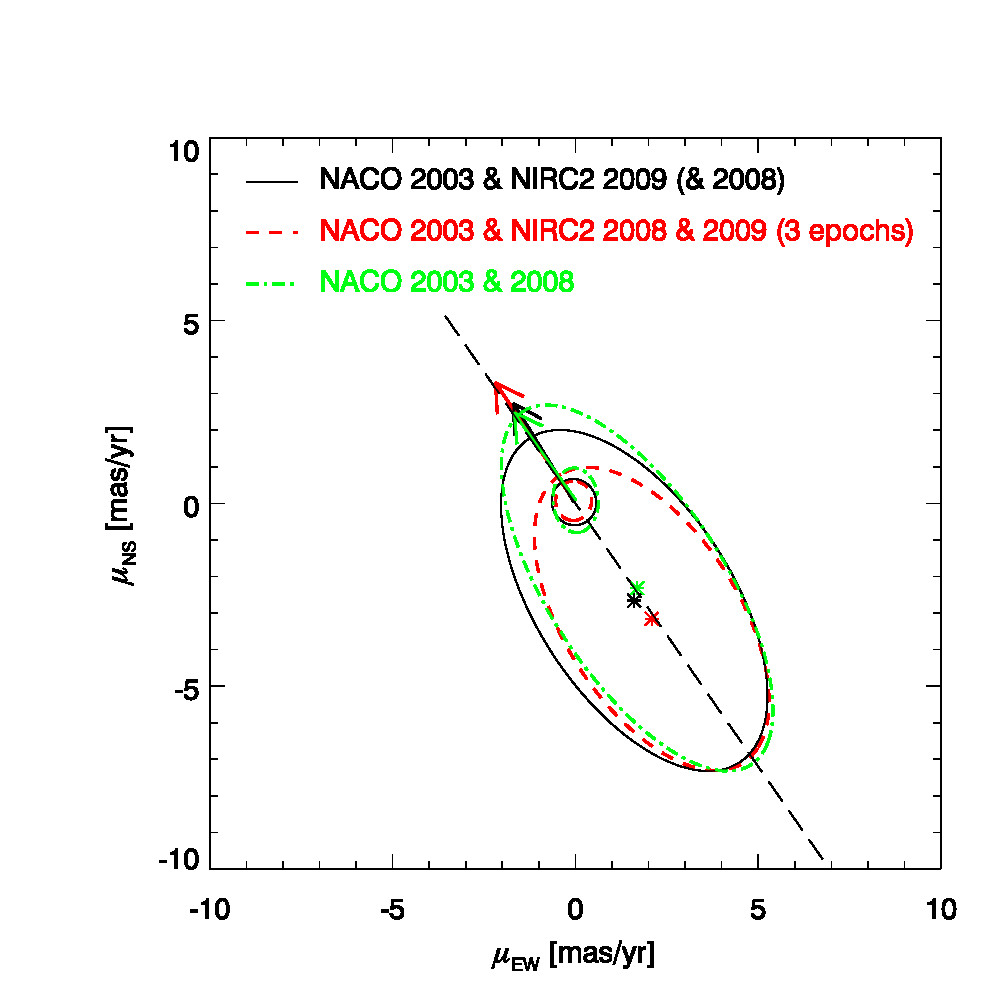
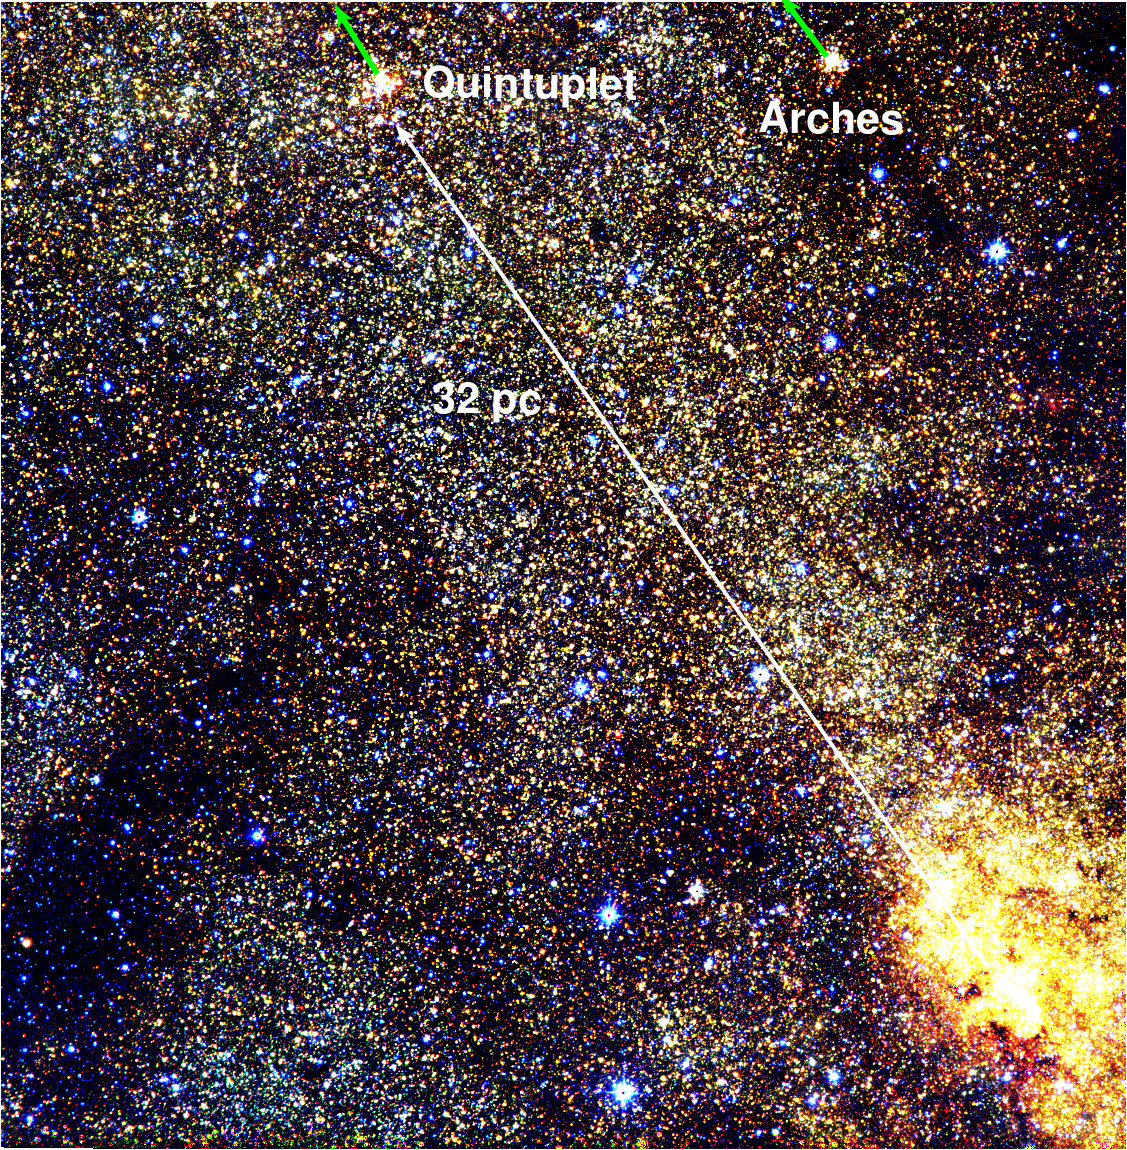
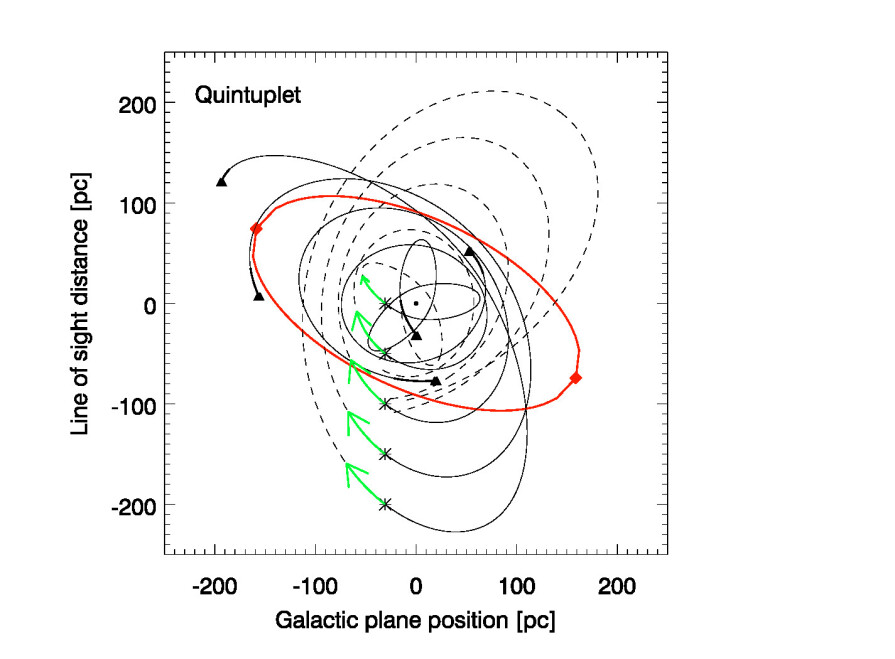
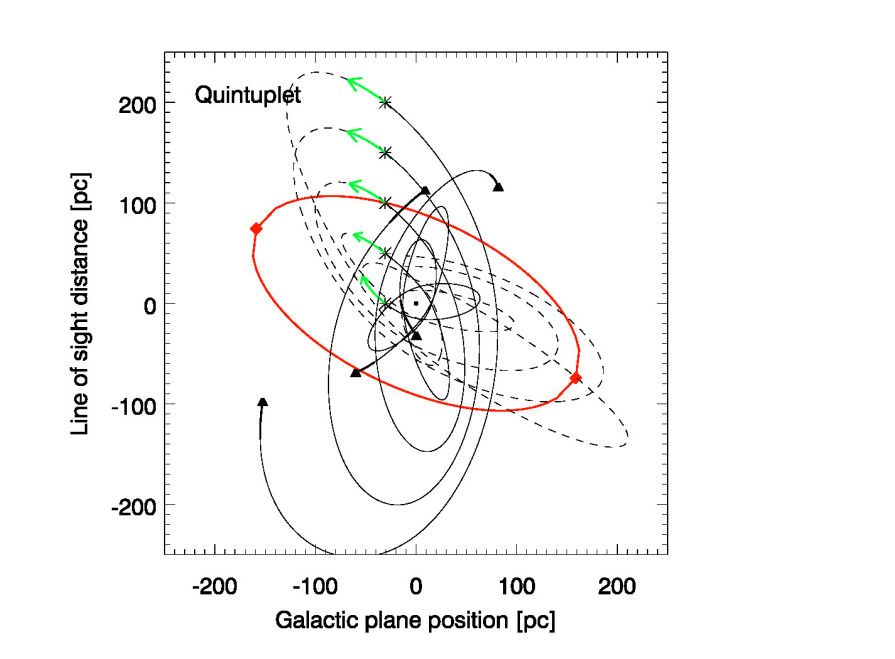
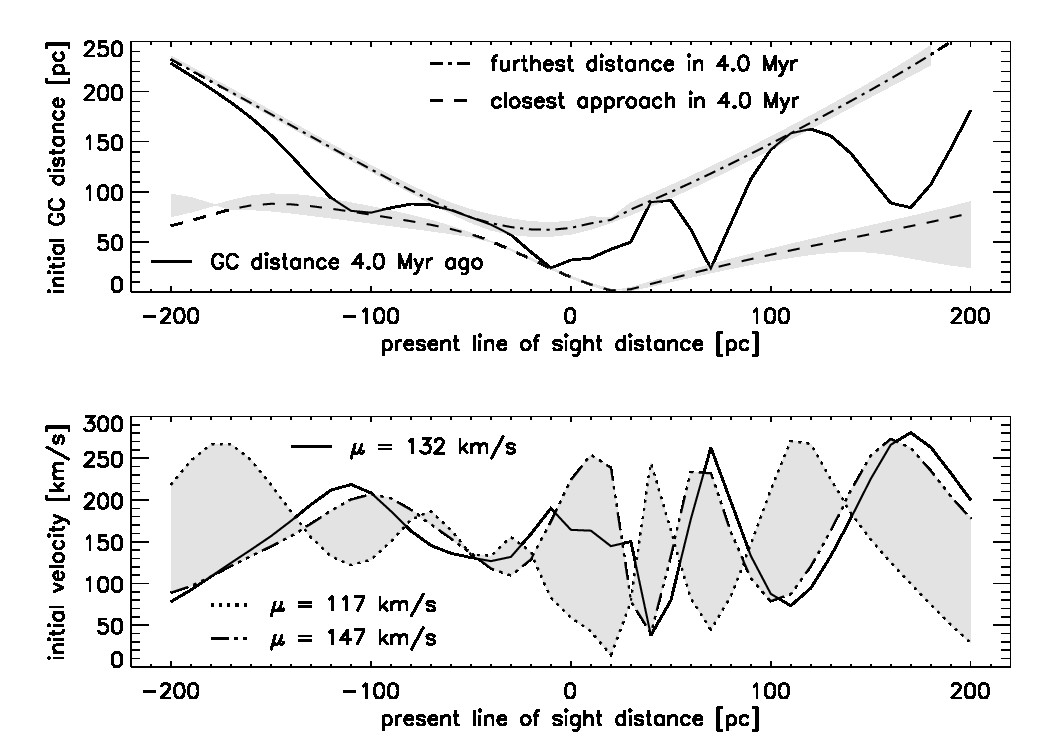
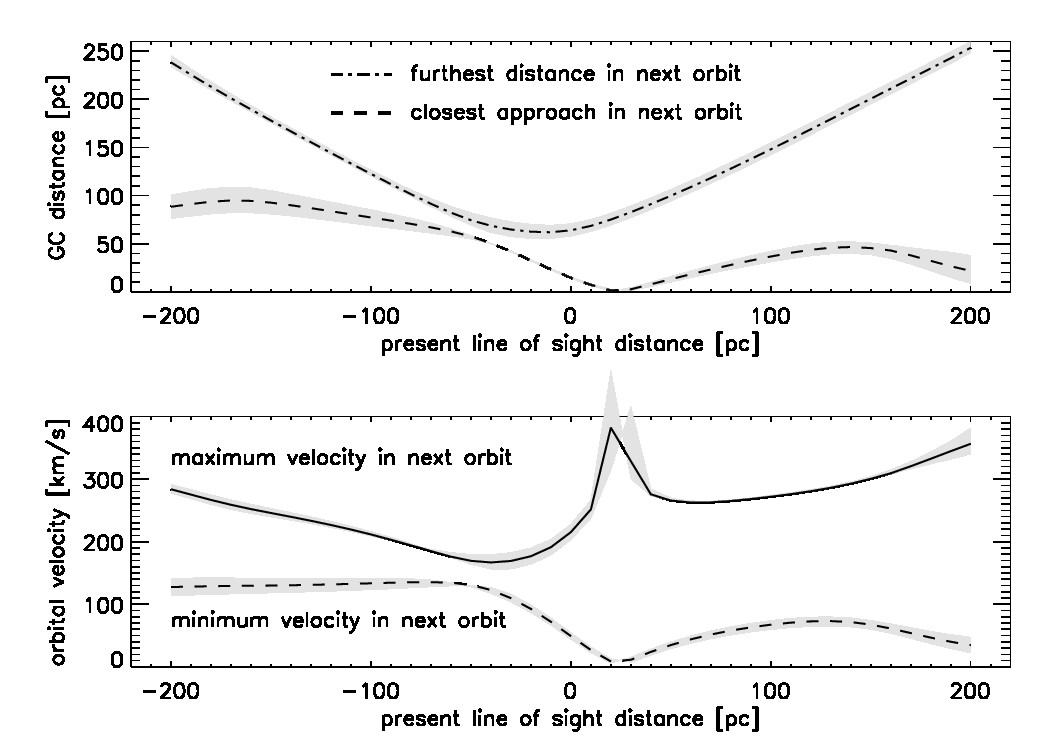
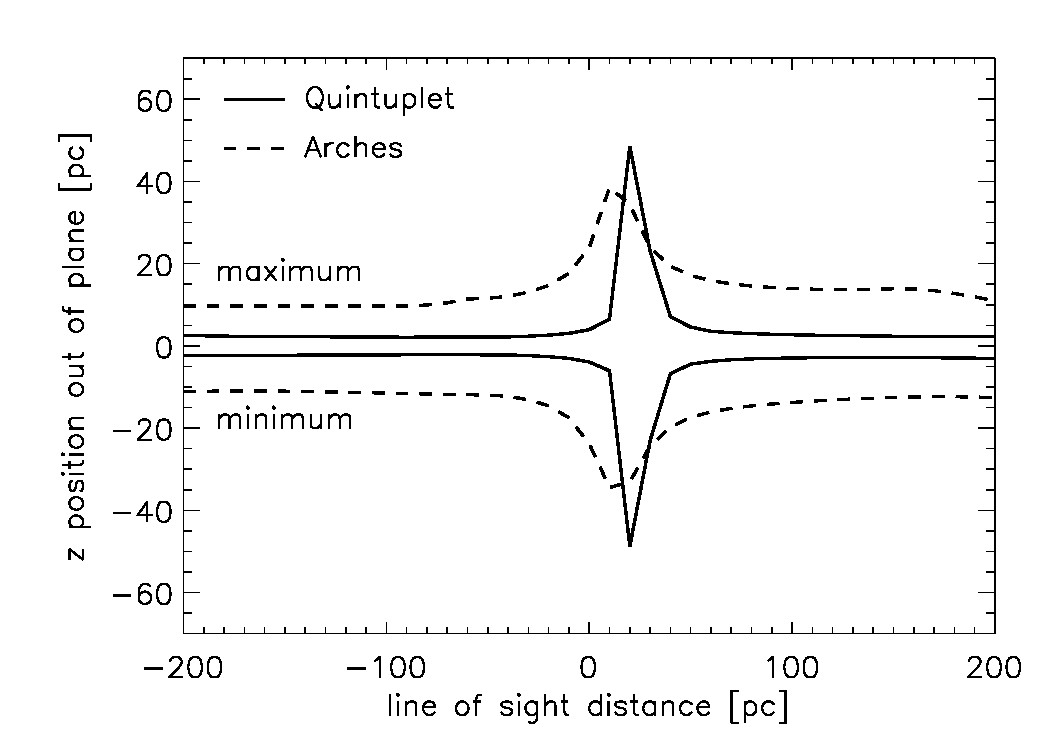
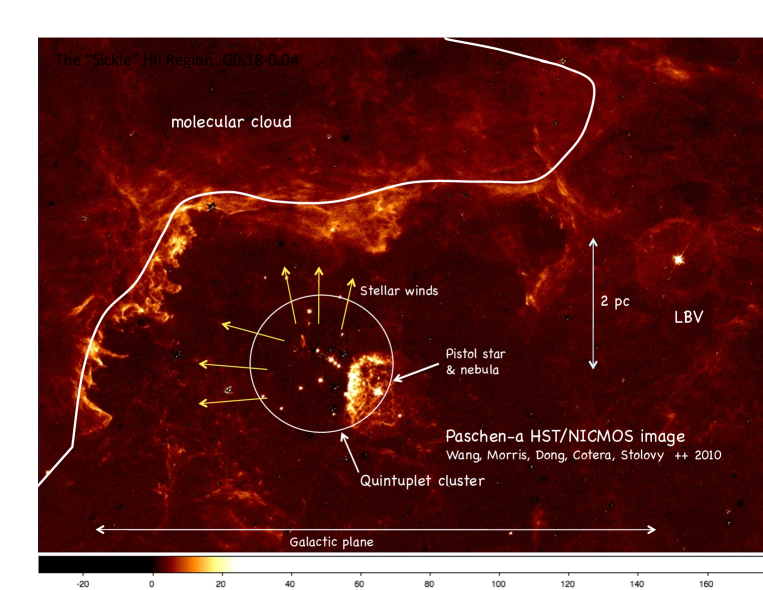

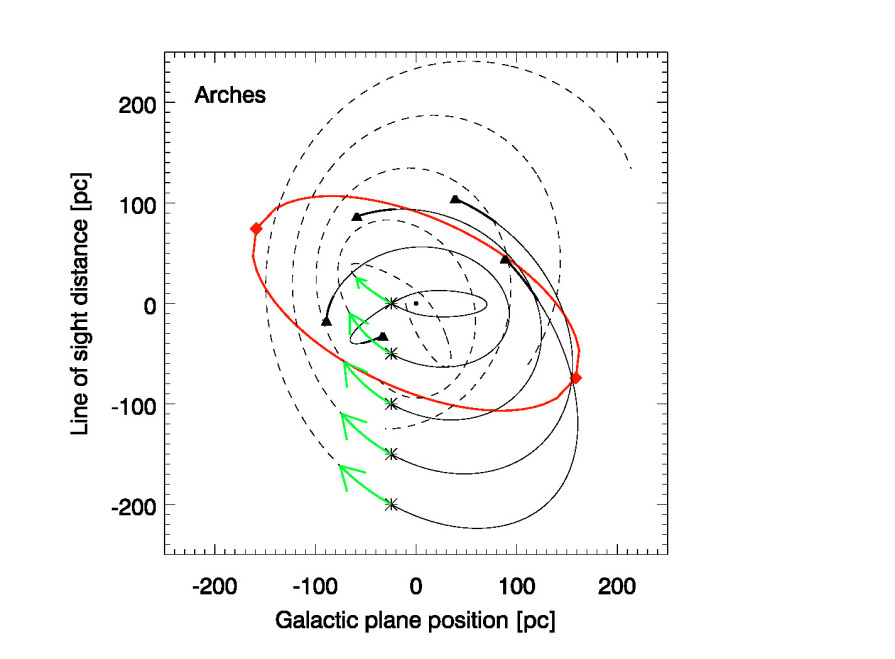
References
Athanassoula, E. 1992, MNRAS, 259, 345
Bartko, H., Martins, F., Trippe, S., Fritz, T. K., et al. 2010, ApJ, 708, 834
Binney, J., Gerhard, O. E., Stark, A. A., et al. 1991, MNRAS, 252, 210
Bishop, C. M. 2006, Pattern Recognition and Machine Learning, (New York, NY: Springer, 1st ed.)
Böker, T., Falc’on-Barroso, J., Schinnerer, E., Knapen, J. H., Ryder, S. 2008, AJ, 135, 479
Clarkson, W., Ghez, A. M., Morris, M., Lu, J. R., McCrady, N., Stolte, A., Do, T., Yelda, S. 2012, ApJ, 751, 132
Cotera, A. S., Erickson, E. F., Colgan, S. W. J., Simpson, J. P., Allen, D. A., Burton, M. G. 1996, ApJ, 461, 750
Crowther, P. A. 2007, ARA&A, 45, 177
Dame, T. M., Hartmann, D., Thaddeus, P. 2001, ApJ, 547, 792
Diolaiti, E., Bendinelli, O., Bonaccini, D., et al. 2000, A&AS, 147, 335
Do, T., Ghez, A. M., Morris, M. R., Lu, J. R., Matthews, K., Yelda, S., Larkin, J. 2009, ApJ, 703, 1323
Do, T., Lu, J. R., Ghez, A. M., Morris, M. R., Yelda, S., Martinez, G. D., Wright, S. A., Matthews, K. 2013, ApJ, 764, 154
Dong, H., Wang, Q. D., Cotera, A., Stolovy, S., Morris, M. R., Mauerhan, J., Mills, E. A., Schneider, G., Calzetti, D., Lang, C. 2011, MNRAS, 417, 114
Elmegreen, D. M., Elmegreen, B. G. 1978, ApJ, 219, 105
Espinoza, P., Selman, F. J., Melnick, J. 2009, A&A, 501, 563
Figer, D. F., Kim, S. S., Morris, M., Serabyn, E., Rich, R. M., McLean, I. S. 1999a, ApJ, 525, 750
Figer, D. F., McLean, I. S., Morris, M. 1999b, ApJ, 514, 202
Fruchter, A. S., Hook, R. N. 2002, PASP, 114, 144
Fujii, M., Iwasawa, M., Funato, Y., Makino, J. 2008, ApJ, 686, 1082
Gardner, E., Flynn, C. 2010, MNRAS, 405, 545
Genzel, R., Schödel, R., Ott, T., Eisenhauer, F., et al. 2003, ApJ, 594, 812
Gerhard, O. 2001, ApJL, 546, 39
Ghez, A. M., Salim, S., Hornstein, S. D., Tanner, A., Lu, J. R., Morris, M., Becklin, E. E., Duchêne, G. 2005, ApJ, 620, 744
Glass, I. S., Moneti, A., Moorwood, A. F. M. 1990, MNRAS, 242, 55
Habibi, M., Stolte, A., Brandner, W., Hußmann, B., Motohara, K. 2013, A&A, 556, A26
Habibi, M., Stolte, A., Harfst, S. 2014, A&A, 566, A6
Hußmann, B., Stolte, A., Brandner, W., Gennaro, M., Liermann, A. 2012, A&A, 540, A57
Hußmann, B., 2014, PhD Thesis, University of Bonn, http://hss.ulb.uni-bonn.de/2014/3485/3485.htm
Kim, S. S., Figer, D. F., Lee, H. M., Morris, M. 2000, ApJ, 545, 301
Kim, S. S., Morris, M. 2003, ApJ, 597, 312
Kim, S. S., Saitoh, T. R., Jeon, M., Figer, D. F., Merritt, D., Wada, K. 2011, ApJ Letters, 735, 11
Kozhurina-Platais, V., Girard, T. M., Platais, I., van Altena, W. F., Ianna, P. A., Cannon, R. D. 1995, AJ, 109, 672
Lang, C. C., Cyganowski, C., Goss, W. M., Zhao, J.-H. 2003, ANS, 324, 1
Launhardt, R., Zylka, R., Mezger, P. G. 2002, A&A, 384, 112
Lawrence, A., Warren, S. J., Almaini, O., Edge, A. C., et al. 2007, MNRAS, 379, 1599
Lenzen, R., Hartung, M., Brandner, W., Finger, G., et al. 2003, Proc. SPIE, 4841, 944
Liermann, A., Hamann, W.-R., Oskinova, L. M. 2009, A&A, 494, 1137
Liermann, A., Hamann, W.-R., Oskinova, L. M., Todt, H., Butler, K. 2010, A&A, 524, A82
Liermann, A., Hamann, W.-R., Oskinova, L. M. 2012, A&A, 540, A14
Lindqvist, M, Winnberg, A., Habing, H.J., Matthews, H.E. 1992, A&AS, 92, 43
Longmore, S. N., Rathborne, J., Bastian, N., et al. 2012, ApJ, 746, 117
Longmore, S. N., Kruijssen, J. M. D., Bally, J., et al. 2013, MNRAS Letters, 433, 15
Lu, J. R., Ghez, A. M., Hornstein, S. D., Morris, M. R., Becklin, E. E., Matthews, K. 2009, ApJ, 690, 1463
Lu, J. R., Do, T., Ghez, A. M., Morris, M. R., Yelda, S., Matthews, K. 2013, ApJ, 764, 155
Lucas, P. W., Hoare, M. G., Longmore, A., Schröder, A. C., et al. 2008, MNRAS, 391, 136
Mackey, J., Lim, A. J. 2010, MNRAS, 403, 714
Martins, F., Hillier, D. J., Paumard, T., Eisenhauer, F., Ott, T., Genzel, R. 2008, A&A, 478, 219
Mazzuca, L. M., Knapen, J. H., Veilleux, S., Regan, M. W. 2008, ApJS, 174, 337
Molinari, S., Bally, J., Noriega-Crespo, A., et al. 2011, ApJ Letters, 735, 33
Mauerhan, J. C., Morris, M. R., Cotera, A., Dong, H., et al. 2010a, ApJL, 713, 33
Mauerhan, J. C., Cotera, A., Dong, H., Morris, M. R., et al. 2010b, ApJ, 725, 188
Nagata, T., Woodward, C. E., Shure, M., et al. 1990, ApJ, 351, 83
Nagata, T., Woodward, C. E., Shure, M., Kobayashi, N. 1995, AJ, 109, 1676
Namekata, D., Habe, A., Matsui, H., Saitoh, T. 2009, ApJ, 691, 1525
Oka, T., Hasegawa, T., Hayashi, M., et al. 1998, ApJ, 493, 730
Okuda, H., Shibai, H., Nakagawa, T., et al. 1990, ApJ, 351, 89
Paumard, T., Genzel, R., Martins, F., Nayakshin, S., et al. 2006, ApJ, 643, 1011
Portegies Zwart, S. F., Makino, J., McMillan, S. L. W., Hut, P. 2002, ApJ, 565, 265
Press, W. H., Teukolsky, S. A., Vetterling, W. T., Flannery, B. P. 2007, Numerical recipes in C++ : the art of scientific computing, (Cambridge University Press; 3rd ed.), Chpt. 16, pp. 842
Regan, M. W., Teuben, P. 2003, ApJ, 582, 723
Rochau, B., Brandner, W., Stolte, A., Gennaro, M., et al. 2010, ApJL, 716, 90
Rodriguez-Fernandez, N. J., Combes, F. 2008, A&A, 489, 115
Rousset, G., Lacombe, F., Puget, P., Hubert, N. N., et al. 2003, Proc. SPIE, 4839, 140
Schödel, R., Eckart, A., Alexander, T., Merritt, D., et al. 2007, A&A, 469, 125
Schödel, R., Najarro, F., Muzic, K., Eckart, A. 2010, A&A, 511, A18
Stolte, A., Ghez, A. M., Morris, M., Lu, J. R., Brandner, W., Matthews, K. 2008, ApJ, 675, 1278
Sumi, T., Eyer, L., Woźniak, P. R. 2003, MNRAS, 340, 1346
Tuthill, P., Monnier, J., Tanner, A., Figer, D., Ghez, A., Danchi, W. 2006, Science, 313, 935
Wang, Q. D., Dong, H., Cotera, A., Stolovy, S., Morris, M., Lang, C. C., Muno, M. P., Schneider, G., Calzetti, D. 2010, MNRAS, 402, 895
Warren, S. J., Hambly, N. C., Dye, S., Almaini, O., et al. 2007, MNRAS, 375, 213
Yelda, S., Lu, J. R., Ghez, A. M., Clarkson, W., Anderson, J., Do, T., Matthews, K. 2010, ApJ, 725, 331