A high-pressure hydrogen time projection chamber for the MuCap experiment
Abstract
The MuCap experiment at the Paul Scherrer Institute performed a high-precision measurement of the rate of the basic electroweak process of nuclear muon capture by the proton, . The experimental approach was based on the use of a time projection chamber (TPC) that operated in pure hydrogen gas at a pressure of 10 bar and functioned as an active muon stopping target. The TPC detected the tracks of individual muon arrivals in three dimensions, while the trajectories of outgoing decay (Michel) electrons were measured by two surrounding wire chambers and a plastic scintillation hodoscope. The muon and electron detectors together enabled a precise measurement of the atom’s lifetime, from which the nuclear muon capture rate was deduced. The TPC was also used to monitor the purity of the hydrogen gas by detecting the nuclear recoils that follow muon capture by elemental impurities. This paper describes the TPC design and performance in detail.
1 Introduction
The MuCap experiment MuCapTP:1996 ; MuCapTP:2001 ; Andreev:2007wg ; Andreev:2012fj measured the rate s-1 for the basic electroweak process of nuclear muon capture by the proton, . This unprecedented precision determined the least well known of the nucleon’s charged-current form factors, the induced pseudoscalar coupling , to 6.8% Bernard:1994wn ; Bernard:2001rs ; Czarnecki:2007th . MuCap collected data from 2004–2007 at the Paul Scherrer Institute (PSI) in Switzerland using a time projection chamber (TPC; see Hilke:2010 for a review) to detect low-energy muons ( 35 MeV/) arriving from the facility’s E3 beamline. Tests of early prototype chambers were reported in 2001 Maev:2001 ; Maev:2001yx and 2002 Maev:2002sn . The experiment’s first result was published in 2007 Andreev:2007wg , based on data collected in 2004. An abbreviated paper on the final TPC design was published in conference proceedings in 2011 Egger:2011zz . The experiment’s final results, based on data collected in 2006 and 2007, were published in 2013 Andreev:2012fj .
1.1 Experimental requirements
The most precise method for determining the capture rate from the singlet ground state of the atom is the lifetime technique. In this method, the bound-state disappearance rate and the free decay rate are determined separately by measuring the time spectrum of decay electrons from each. The singlet capture rate is deduced from the difference . Other methods, such as direct measurement of the absolute neutron yield from nuclear captures in the system, are not able to achieve a comparable precision. However, in order to make a precision measurement using the lifetime technique, the experimental setup had to be capable of collecting very high statistics—namely, muon decay events for a measurement of to 10 parts per million (ppm). When combined with the 1 ppm measurement of from the MuLan experiment Tishchenko:2012ie , this level of statistics determined to 1%.
The measurement had to be performed in low-density hydrogen gas in order to minimize distortions to the lifetime from formation of muonic molecules Andreev:2007wg . The MuCap target gas density was 1% of liquid hydrogen; this corresponds to a gas pressure of 10 bar at 300 K.
The hydrogen gas had to be kept very clean, with concentrations of other elements ppb. This stringent requirement was necessary because a muon will preferentially transfer from the atom to a heavier element due to its larger binding energy, and the capture rates for and systems can differ by orders of magnitude due to the fact that the nuclear muon capture rate increases with . Using ultra-pure hydrogen gas therefore reduced unwanted contributions to the lifetime spectrum from nuclear captures by impurities. The TPC itself was used to monitor the purity of the gas, using a technique described in sect. 3.3.4.
It was essential to clearly identify muons that stopped in the hydrogen gas target because accepting muons that stopped in materials would have distorted the lifetime spectrum for the reasons described above.
The hydrogen gas had to be depleted of deuterium, a naturally abundant isotope (150 ppm), to 100 ppb. Such isotopically pure hydrogen is commonly referred to as protium. The presence of deuterium introduces a potential systematic error because a muon will preferentially transfer from the atom to the more tightly bound deuterium atom, and the resulting atom can diffuse large distances due to a Ramsauer-Townsend minimum in the cross section. As a result, the muon would be lost to the data analysis in a time-dependent manner, or possibly transported to surrounding detector materials to undergo capture there. Either of these possible effects would distort the measured lifetime.
1.2 Detector concept
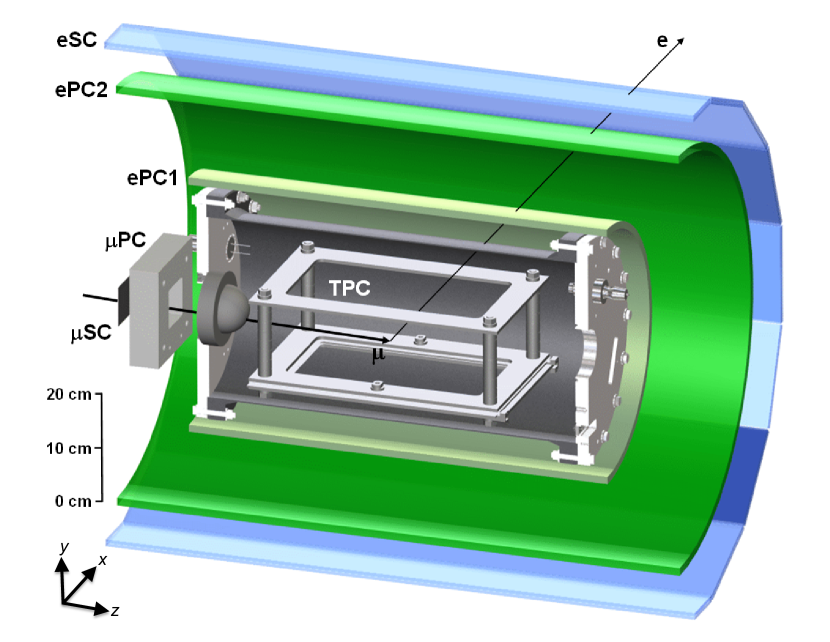
To simultaneously satisfy the experiment’s many technical requirements, an apparatus (fig. 1) containing three main functional groups was constructed:
-
1.
A muon beam telescope, which registered the arrival time of each muon and thus the start of its lifetime clock. The telescope consisted of a plastic scintillation counter, SC, for fast timing and an - grid wire chamber, PC, to provide position information and a measure of detection redundancy. Preceding this telescope was a veto scintillator, SCA (not shown), for beam collimation; it had a 35-mm-diameter hole and was followed by a sheet of lead of the same shape to ensure that errant muons were captured quickly.
-
2.
The TPC, which operated in pure protium gas at 10 bar inside a cylindrical pressure vessel and tracked incoming muon trajectories in three dimensions.
-
3.
A series of concentric electron detectors, which surrounded the pressure vessel and measured the emission time and trajectory of outgoing decay electrons, with solid-angle coverage. The electron detectors consisted of two nested wire chambers, ePC1 and ePC2, and an outer plastic scintillation hodoscope, eSC. The ePC detectors provided information about the three-dimensional trajectory of the decay electron, while the eSC provided fast timing information for the stop of the muon lifetime clock.
A description of the MuCap physics results can be found in refs. Andreev:2007wg ; Andreev:2012fj , and the experiment is described in detail in refs. Banks:PhD ; Clayton:PhD ; Kiburg:PhD ; Knaack:PhD . This paper focuses primarily on describing the TPC and related infrastructure.
Located in the center of the apparatus, the TPC was the crucial detector that made a high-precision muon capture rate measurement possible. Its primary purpose was to detect the trajectory of each incoming muon and thereby enable the unambiguous identification of muons that stopped in the protium gas. In this way, unwanted contributions to the decay time spectrum from muon stops in surrounding materials were dramatically suppressed. The TPC and ePCs in conjunction enabled reconstruction of each - decay event vertex, providing a powerful method for suppressing accidental backgrounds. The TPC was a versatile instrument which could also register signals from exotic processes such as nuclear muon capture. Indeed, its response to the nuclear recoils from captures by elements in the protium gas proved essential during data taking as a means for in-situ monitoring of the contamination levels.
1.3 Hydrogen wire chambers
The first TPC (detector IKAR) operating in pure hydrogen was developed in Gatchina Vorobyov1974509 , and it was successfully used in the Coulomb interference experiments WA9 and NA8 at CERN Burq1983285 . This TPC operated in ionization mode without gas amplification. The same mode was used later in the MAYA Demonchy2007341 and CF muCF experiments. The MuCap TPC was designed to operate with gas amplification in pure hydrogen, a regime in which there was little world experience. TREAD, a cylindrical TPC operating in hydrogen at a pressure of 15 atm, was used to study photon diffraction dissociation in Fermilab E612 Chapin:1981zz ; Chapin:1984uk ; it was the first TPC used with pure hydrogen that had gas gain. We are not aware of any others, except for a TPC that was demonstrated as a directional neutron detector, designed to monitor fissile material for nuclear security applications Jovanovic .
Pure hydrogen is a difficult chamber gas with no quenching of ultraviolet photons. High gas pressures require higher voltages at the amplification stage than conventional chambers. The TREAD group parameterized and confirmed measurements PhysRev.59.850 ; PhysRev.104.273 of the first Townsend ionization coefficient , which characterizes the electron multiplication in the Townsend avalanche (). They fit the data to the formula Chapin:1984uk
| (1) |
where is the pressure, is the electric field magnitude, cm-1 Torr-1 and V cm-1 Torr-1. This parameterization agrees well with the values calculated by the Magboltz Biagi:1999nwa program within the Garfield Veenhof tool that we used to simulate the MuCap TPC. At a pressure of 10 bar as in MuCap, rises steeply through 1 cm-1 at V/cm; this is therefore the critical field to trigger gas amplification.
2 Apparatus
2.1 Design
A prototype MuCap TPC of near full size was built in Gatchina, Russia, in 1997 and tested from 1998–2000 in a muon beamline at PSI Maev:2001 ; Maev:2001yx ; Maev:2002sn . These tests demonstrated the feasibility of stopping a muon beam inside a TPC operating in 10 bar hydrogen. While the experimental setup did not meet the gas purity requirements for MuCap, the prototype TPC provided information essential to the design and construction of the next detector.
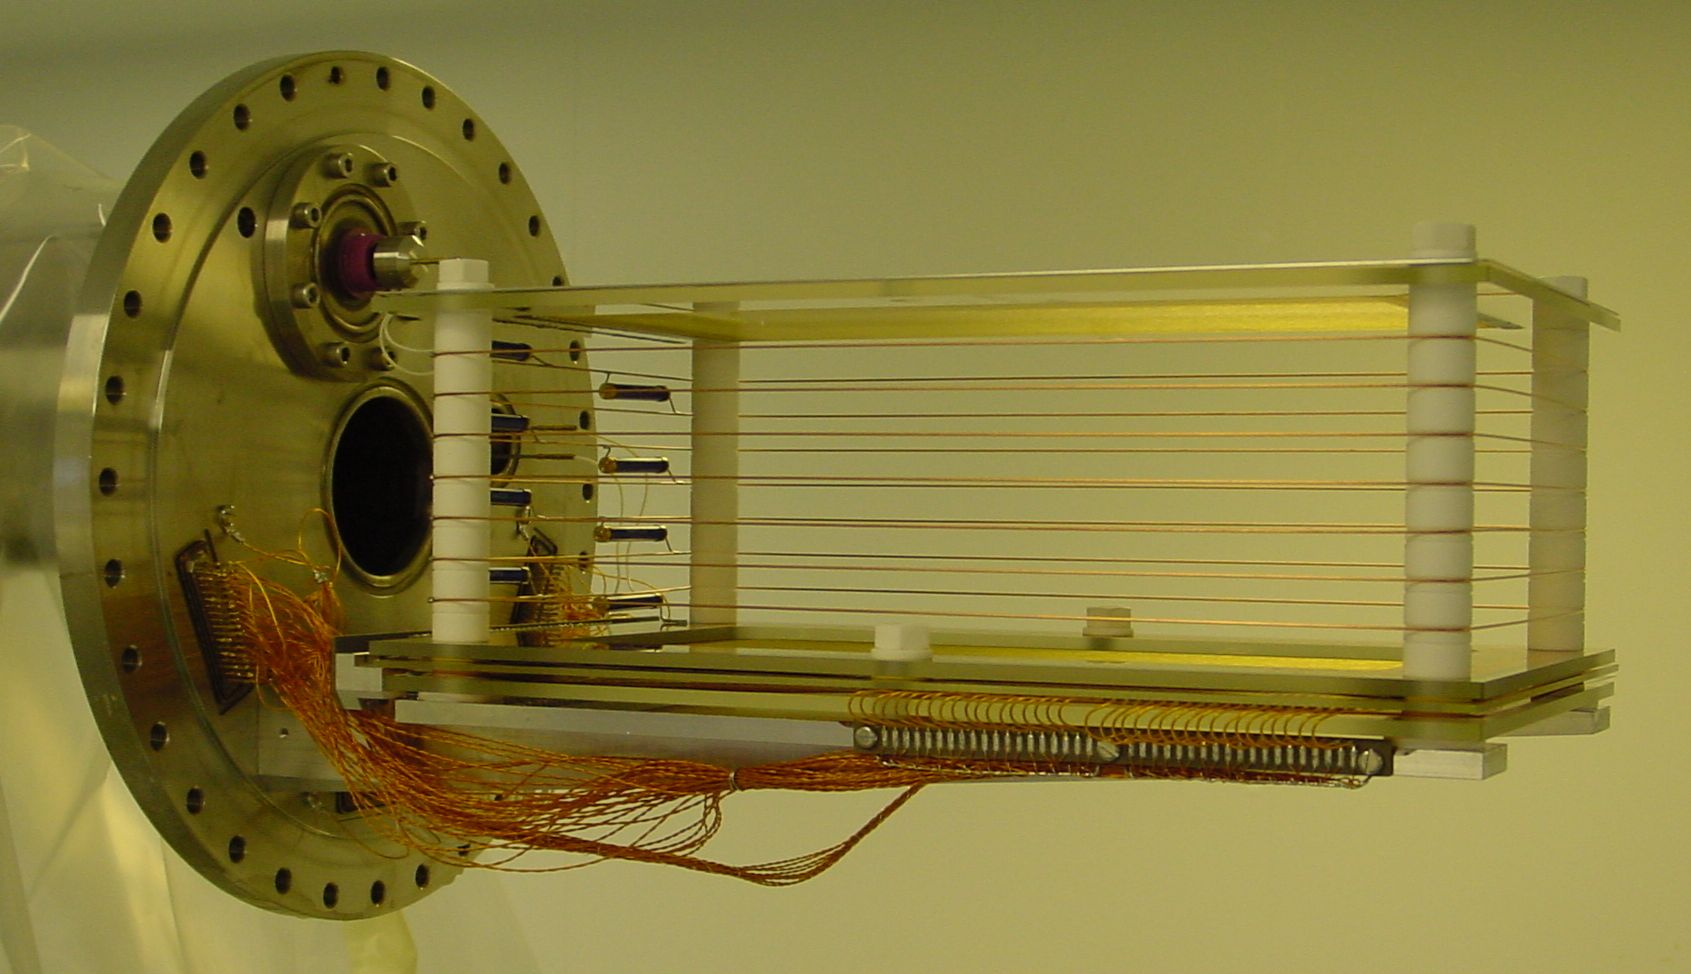
The final MuCap TPC was constructed and tested at PSI from 2000–2003. A photograph of the device shortly after its first assembly in 2003 is shown in fig. 2.
A number of novel features were incorporated into the TPC in order to meet the experiment’s need for high-purity protium gas. Bakeable, UHV-compatible materials were used for all interior surfaces and components. The materials were mostly metals (Be, Al, Cu, W, Au, stainless steel), metal oxides (ceramics), glass, and Kapton-insulated wires; a small amount of epoxy was used to seal the feedthroughs.
The TPC volume had dimensions cm3, as defined by the rectangular frame of the high-voltage (HV) drift cathode at the top of the detector and the rectangular frames of the multiwire proportional chamber (MWPC) at the bottom of the detector. As shown in fig. 1, the TPC was designed to be oriented with its long edge parallel to the incoming muon beam. The frames were made from Borofloat glass111SCHOTT Technical Glass Solutions GmbH, 07745 Jena, Germany. and were held in place by four Macor metal-oxide pillars, one at each corner. The MWPC consisted of three separate frames—an upper cathode, an anode, and a lower cathode—spaced 3.5 mm apart and each having outer dimensions 230 mm 380 mm and inner dimensions 150 mm 300 mm. The MWPC cathode frames were 5 mm thick, while the anode frame was 2.5 mm thick. Each MWPC cathode frame was instrumented with 50-m-diameter wires oriented parallel to the (beam) direction at 1.0 mm pitch; the wires on the cathode planes were soldered together at their ends in adjacent groups of four per soldering pad to produce 35 channels (“strips”) in total. The two cathode wires closest to each edge were larger, with a diameter of 100 m, to smooth the field gradient. Only the signals from the lower MWPC cathode frame were read out; all pads on the upper MWPC cathode were simply connected together to distribute the high voltage. The anode plane had 69 25-m-diameter wires oriented in the direction at 4.0 mm pitch. An additional three anode wires (two 50-m and one 100-m in diameter) on each end smoothed the field gradient. The electric field around these larger-diameter wires was not large enough to produce gas amplification, so the length of the sensitive region along the direction was effectively reduced to 28 cm. The wires were made of gold-plated tungsten, with 3% rhenium. They were soldered under mechanical tension to Ti-Au-Ni pad structures implanted on the glass surfaces. These soldering pads were developed in close consultation with the vendor222IMT Masken und Teilungen, CH-8606 Greifensee, Switzerland. to ensure there was no cracking or separation of the pads after heating cycles, a problem that had been encountered previously. The pad layers were carefully chosen for their bonding properties: a deposition of a few nm of Ti provided good adhesion to the glass frames, followed by successive coatings of 0.5 m of gold, 2 m of nickel, and 0.1 m of gold, where the uppermost gold layer was used for soldering to wires.
During operation, voltages of kV and kV were typically applied to the HV and MWPC cathode planes, respectively, while the anode was held at ground potential. This configuration generated a drift field of 0.2 kV/mm over the 120 mm vertical distance between the HV frame and the upper MWPC cathode frame. Seven 1-mm-diameter copper field wires, wound around the Macor pillars at equal vertical spacings and connected in series by eight high-impedance 5-G resistors, created a homogeneous electrostatic potential, which ensured field constancy in the sensitive volume to within 1%.
When a muon came to a stop in the hydrogen gas, it deposited energy along its path, which ionized surrounding hydrogen atoms. If this occurred inside the sensitive volume of the TPC, the positive ions and electrons were pulled in opposite directions by the detector’s uniform electric drift field. The ionization electrons drifted downwards at a constant speed of 5.5 mm/s until they reached the MWPC region, where they were accelerated by its high electric fields to produce an electron avalanche. For a 5-kV MWPC field in hydrogen, the resulting signal amplified the initial charges by a gain factor of 125.
The MWPC anode wires provided -position information (i.e., along the muon beam direction) while the lower cathode wires provided -position information (i.e., perpendicular to both the muon beam direction and the vertical drift field). The coordinate was calculated from the vertical drift time of the ionization charges, as determined by the elapsed time between the muon arrival registered in the SC detector and the amplification of ionization charges in the MWPC. In this way, the TPC enabled three-dimensional reconstruction of the trajectories of muons passing through its sensitive volume.
The detector had -, -, and -position resolutions of 4.0 mm, 4.0 mm, and 1.1 mm, respectively, which were determined by the wire spacing and electronic sampling period. Magboltz Biagi:1999nwa predicts electron diffusion coefficients of 65 m/ (longitudinal) and 89 m/ (transverse) in the drift field, so in principle a substantially better position resolution would have been possible. However, such fine spatial resolution was not needed for this experiment. It should be mentioned that the manner in which the TPC entangles time and space in the dimension can produce subtle effects which must be carefully addressed in a high-precision experiment such as MuCap. These issues are discussed in detail in sect. 3.3.3.
The TPC was mounted on an aluminum fork affixed to the stainless steel flange at the downstream end of the pressure vessel. The flange contained electrical feedthroughs for the high voltage and signal lines. All of the TPC’s signal preamplifiers were attached to the outside of the flange and were mounted as close to it as possible to minimize noise pickup and wire capacitances. The flange was attached at its center to a cantilevered tube that both supported the pressure vessel assembly and functioned as a high-vacuum conduit during evacuation and baking operations before the protium gas was loaded.
The TPC sat in the center of the cylindrical pressure vessel, which was made of 4-mm-thick Anticorodal-110 aluminum and had length 600 mm and inner diameter 282 mm. The stainless steel flange on the upstream end of the vessel contained the beam entrance window, a beryllium half-sphere of thickness 0.5 mm and radius 35 mm. The beryllium window and the pressure vessel’s bare aluminum wall were made as thin as safely possible in order to minimize scattering of incoming muons and outgoing decay electrons, respectively.
While the MuCap setup was designed to detect negative muons and their decay electrons, it was essential that the apparatus also be able to measure the lifetime of positive muons as a control experiment. Positive muons remain polarized after they stop, and the distribution of the decay positrons is peaked in the direction of the muon’s spin. Rather than allow the muon spins to precess in an unknown and possibly variable ambient magnetic field, it was better to impose a known magnetic field to rotate the spins in a controlled way. A dual saddle-coil magnet, wound around the pressure vessel from 6.4-mm-diameter aluminum tubes carrying a current of 125 A, provided a 5 mT field, uniform at the level of 10% over the sensitive volume.
In addition to the TPC that was used for the physics measurement, a second one of the same general design was constructed and tested as a spare. It was tested with a 90Sr beta source up to 6 kV MWPC high voltage, and it remained stable for one week at a working voltage of 5.5 kV.
2.2 Electronics
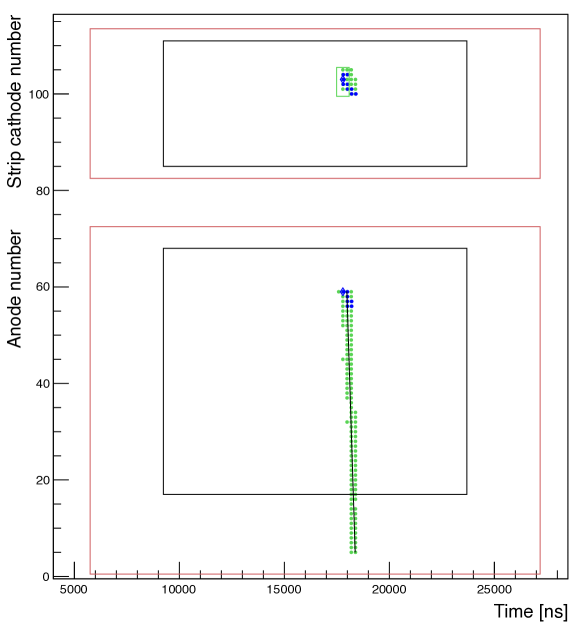
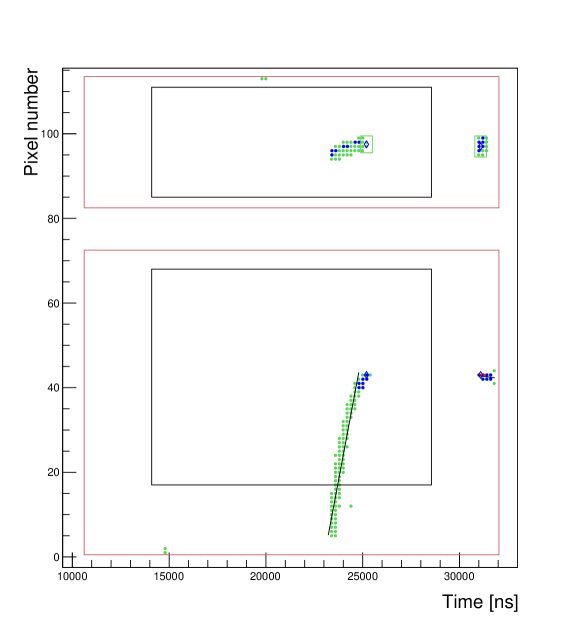
The amplified TPC signals were processed by VME64 time-to-digital-converter (TDC) modules built for the MuCap experiment. These PSI-designed electronics modules, model TDC400, recorded time-stamped hit patterns (48 bits for data, 16 bits for time) from the MWPC wires at a rate of 5 MHz and at three signal thresholds, which served to reduce data volume. The optimal settings for the three discriminated signal levels—designated Energy Low (EL), Energy High (EH), and Energy Very High (EVH)—varied according to the hydrogen gas density and the TPC’s operating voltage, so they were tuned by eye using a graphical event display (fig. 3) and trend plots prior to data taking. Whenever an energy threshold was triggered, all lower-energy thresholds were also triggered. A TDC400 module was typically used to instrument each 16-channel sector of the TPC anodes, the 48 data bits being used for the EL, EH, and EVH signals from that sector.
The TPC operated in proportional mode, so its signals were proportional in voltage to the energy deposited per unit length by ionizing particles. The EL threshold was set just above the noise so that each incoming muon generated a trail of EL pixels along its ionizing track. The EH threshold was tuned slightly higher, so that the track terminated in a cluster of EH pixels at the muon’s stopping point where there was a large Bragg peak in the energy deposition. The EVH threshold was generally set just above the 250 keV high-energy tail of the Bragg peak in the muon stopping distribution to render the detector sensitive to signals from exotic high-energy processes—namely, nuclear muon capture by impurities, which typically produced recoil nuclei in the 200–800 keV energy range. During 2006 data taking typical threshold settings were in the vicinity of EL=6 keV, EH=75 keV, and EVH=340 keV.
During the 2004 experimental run, the central 16-wire TPC sector (anodes 33–48) was also instrumented with 8-bit flash ADC (FADC) VME modules (Struck DL401). The FADCs provided analog information on the TPC anode signals, albeit at a limited data rate compared to the TDC400s, as the FADCs were only read out on infrequent occasions when the impurity capture trigger logic fired. In subsequent years, all of the TPC channels were instrumented with FADC modules custom designed for the experiment. These modules, built around the Maxim MAX1213 device, transmitted data directly over an Ethernet interface. In comparison to the previous setup, they provided full channel coverage, 12-bit resolution, and a higher allowed trigger rate.
2.3 Gas system
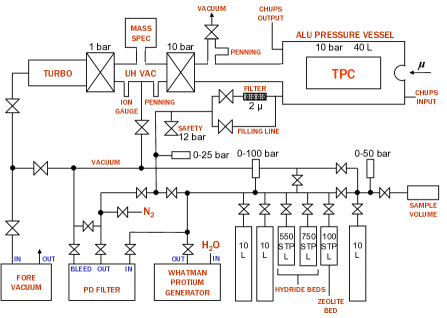
A combination high-vacuum/gas-handling system (fig. 4) was used to store the ultra-pure protium and to vacuum pump and then fill the pressure vessel with protium gas at the start of every physics run.
Prior to each run, the pressure vessel (with TPC installed inside) was high-vacuum pumped while being baked to 110–130∘C to remove impurities. The low temperature-expansion coefficient of the TPC’s glass frames prevented excess tension on the wires during these heating cycles, and no cracking or separation of the custom wire-soldering pads was observed after repeated heatings.
After a baking cycle, a residual pressure below mbar could be maintained in the pressure vessel by high-vacuum pumping, using a 200 L/s turbomolecular pump in combination with oil-free forevacuum pumping. The main pumping of the pressure vessel was conducted through the 600-mm-long, 71 mm-inner-diameter support tube attached to the center of the downstream flange. All vacuum connections were sealed with metallic gaskets except for the two end flanges of the pressure vessel, in which Viton O-rings were used. A purely metallic valve with a 70 mm aperture isolated the portion of the system under vacuum from the high-pressure part. The vacuum was monitored by Penning and Pirani gauges, and a quadrupole mass spectrometer was used to monitor the composition of the residual gas.
The protium gas handling system consisted exclusively of stainless steel components that could be baked out in parallel with the pressure vessel and could tolerate pressures up to 60 bar. The system contained the following gas-storage devices:
-
•
Hydride storage beds: Each of these 2-liter containers stored protium gas bound as a hydride at residual pressures of 1–10 bar, depending on the filling state and temperature. Typical storage capacities were 500–800 STP-liters per container.
-
•
A zeolite bed: At liquid nitrogen temperature, this 1-liter-volume bed adsorbed up to 120 STP-liters of protium. At room temperature the protium gas was desorbed and then pressurized up to 100 bar so that it could be filled into stainless steel bottles.
-
•
Stainless steel bottles: Each of these 10-liter bottles could be filled with pressurized gas and had a maximum storage capacity of 600 STP-liters. Smaller one-liter volumes were used for gas mixing and sampling duties.
The protium gas was produced via electrolysis of commercially purchased protium water333Ontario Power Generation, Ontario, Canada using a Whatman generator. The gas’s residual deuterium level of 1.44 ppm, though quite low, nevertheless necessitated a significant correction to the data collected during the experiment’s first physics run in 2004 Andreev:2007wg . An isotope separation column was therefore built in 2005 to further reduce the deuterium content of the hydrogen gas for subsequent measurements. The separation column employs hydrogen liquefaction and evaporation cycles to purify the protium by exploiting the different evaporation rates of hydrogen isotopes; a complete description of the system is given in ref. Alekseev:2006 . A sample of ultra-depleted protium gas produced by the column and used in the TPC was analyzed by the ETH AMS facility Synal:2006 and found to contain less than 6 ppb deuterium. Both the isotopic purity and the sensitivity of the analysis are unprecedented, representing significant advances in the state of the art.
During storage the protium accumulated impurities due to outgassing from its containers, so the gas had to be cleaned prior to its injection into the pressure vessel through the single 6-mm-OD/4-mm-ID stainless steel tube. Initial cleaning was accomplished by passing the protium through a palladium filter, which is effective at removing non-hydrogen elements. Although the resulting hydrogen gas was of ultra-high purity, continued cleaning was required because the vessel’s interior and the TPC continually outgas impurities. Even after the vessel and TPC had been heated and pumped for several weeks the system still exhibited an impurity outgassing rate of 1 ppm/week; analysis of gas samples revealed that nitrogen and water vapor were the primary impurities Banks:PhD ; Clayton:PhD . To overcome this problem, the Circulating Hydrogen Ultra-high Purification System (CHUPS) was operated during data taking. This system—which worked on the basis of thermodynamic adsorption and desorption cycles using activated carbon—continuously circulated the protium gas through the pressure vessel via dedicated lines (consisting of an inlet in the upstream flange and an outlet in the downstream flange) and scrubbed the protium of impurities by pushing it through zeolite filters in a liquid nitrogen environment. A detailed description of CHUPS and its performance can be found in ref. Ganzha:2007uk .
Several ports were installed to allow gas from inside the pressure vessel to be sampled (up to 10 STP-liters) from the single connecting tube and stored in bottles for later offline analysis. The impurity content of the gas was analyzed using gas chromatography, which is capable of detecting small admixtures of light elements (N2, O2) down to 10 ppb. The humidity content was measured online using a Pura hygrometer.444Kahn Instruments, Wethersfield, CT, USA
In the 2004 physics run, the gas-handling setup was also used to take samples of the gas inside the pressure vessel and to inject precise admixtures of impurity gases for calibration studies, using ports connected to the single stainless steel tube between the gas handling system and the pressure vessel. In subsequent runs these tasks were performed using ports within the separate CHUPS system, which allowed for cleaner operations.
3 Performance
3.1 Wire chamber properties
3.1.1 Gas amplification
A wire chamber with a high gas gain separates small signals more effectively from the noise. We characterized the gas gain in several prototype chambers before building the MuCap TPC. Measurements of the gain of Gatchina-built MWPC prototypes were reported in Maev:2001yx . One of these chambers had a similar geometry to the corresponding region of the MuCap TPC. The measurements were made using an alpha source, so the recombination effects significantly reduced the charge collection and therefore the apparent gain. Consequently, these results were not directly comparable to the conditions of the MuCap experiment.
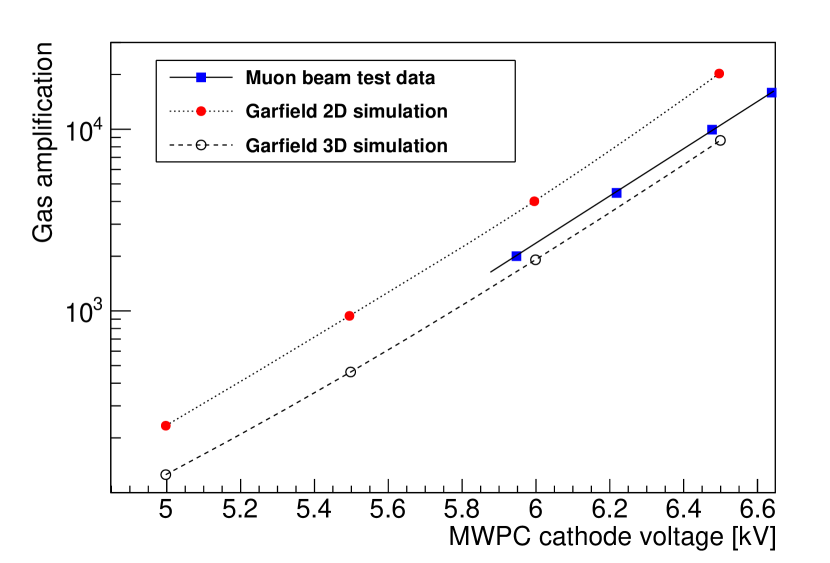
However, a PSI-built MWPC prototype with the same geometry as the final detector was also tested with a 50 kHz beam of 32 MeV/ muons at PSI. The energy deposited by each muon passing through the 7 mm depth of the MWPC region was calculated to be 42 keV; since each ion pair requires 37 eV in hydrogen, the primary ionization current was A. The ratio of the cathode power supply current to this value of ionization current was defined as the gas amplification. These values are plotted in fig. 5, where they are compared with the results of Garfield calculations, both in the traditional two-dimensional approximation where the cathodes and anodes are treated as parallel, and in a realistic three-dimensional geometry calculated by neBEM Majumdar:2006jf , where the anode and cathode directions are perpendicular.
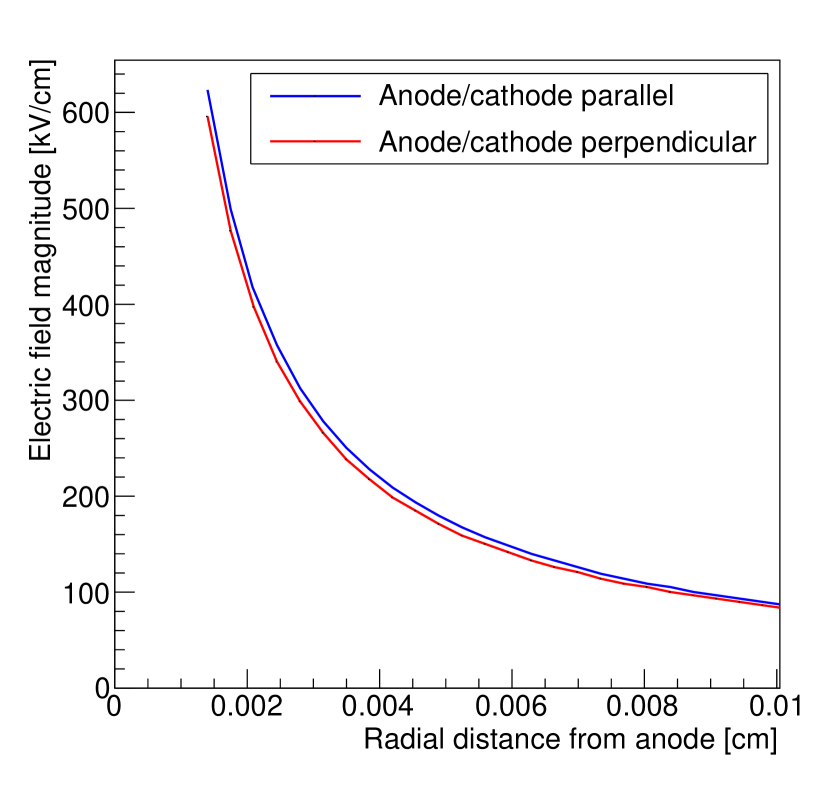
The experimental results agreed within 15% with the three-dimensional calculation, which gave a result that is a factor of 2 smaller than the two-dimensional calculation. Clearly, in this case, the relative orientation of the anode and cathode wires (parallel or perpendicular) has a significant effect. Because the Townsend coefficient rises very sharply with the electric field magnitude as described by eq. 1, a difference in near the anode of a few percent was sufficient to account for this discrepancy. This radial dependence of with respect to the center of the anode is plotted in fig. 6.
3.1.2 Ion transparency
In high-rate experiments with particle fluxes at the level of Hz/cm2 or more, it is essential to minimize the transparency of the amplification stage of a gaseous detector to the ions produced in the avalanche. These ions, if released back into the detection volume (ion feedback), can distort the fields there by their space-charge effect. The question of ion feedback motivates the application of technologies such as GEM Sauli1997531 and Micromegas Giomataris199629 in many detector systems.
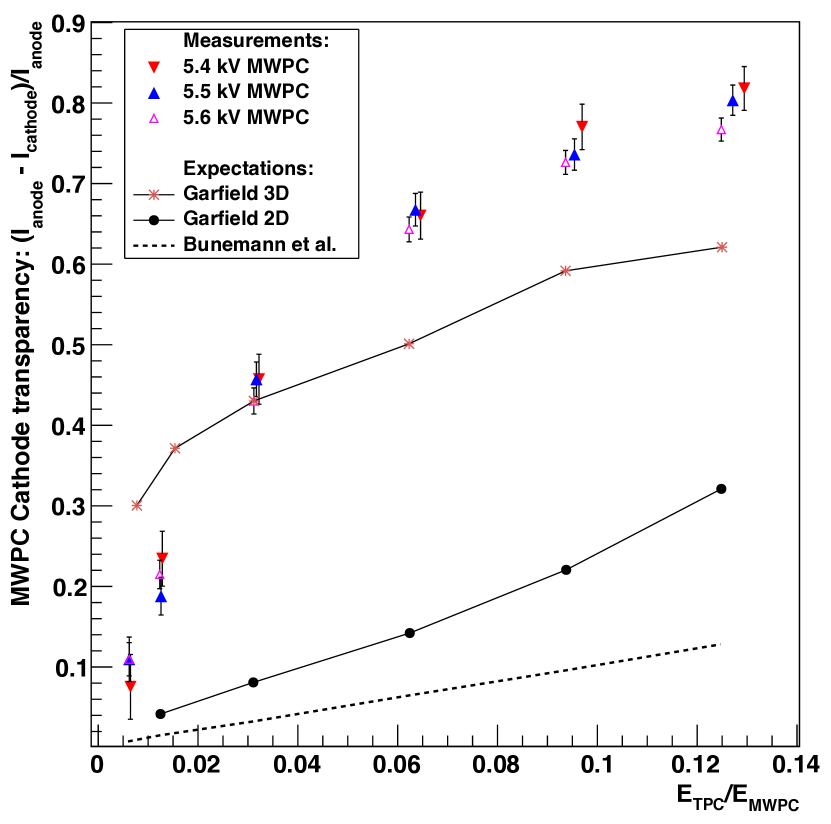
MuCap was not a high-rate experiment in this sense; the incident muon beam rate was only Hz and the gas gain was low, so ion feedback was not a major design consideration. It was nevertheless interesting to investigate the transparency of the MWPC cathode plane in order to understand whether ion feedback may have contributed to the instability of the TPC at higher MWPC voltages, and also to be able to interpret the MWPC cathode current measured during the physics data taking. fig. 7 shows measurements of the ion transparency, made using a 90Sr source, in which the difference between the MWPC anode and cathode currents was examined as the drift field in the TPC was varied. This current imbalance arose because ions that passed through the upper MWPC cathode were collected instead at the drift cathode.
The measured transparency was much larger than naively expected from the calculation in Bunemann , which suggests that the transparency should simply equal the ratio of the electric fields in the drift and MWPC regions, . We note that this calculation is effectively the reciprocal of the problem of electron transmission from the TPC into the MWPC, which is essentially 100% at the MuCap operating conditions, in good agreement with the predictions of Bunemann . However, this relation was derived for electrons drifting in an ionization chamber with a Frisch grid and a planar anode, which does not directly apply to the MuCap TPC. It assumes that the anode wire pitch was much less than the half-gap between anode and cathode planes. This result would not, in principle, be expected to apply to the MuCap TPC, because of its larger wire spacing. The calculation also assumes that the anode and cathode wires are parallel to each other. Also, it describes only the transparency to electric field lines, and not to drifting ions.
A two-dimensional Garfield simulation that traced the field lines predicted a somewhat larger transparency, though still not large enough to match the experimental data. The three-dimensional Garfield simulation revealed the origin of this large ion transparency. The cathodes focused each incident electron onto an location along the anode that was equidistant from the adjacent cathodes. The avalanche developed primarily within 50 m of the anode wire, so it remained localized near this coordinate. Ions therefore generally originated from locations where the electric field lines led out of the MWPC. This “channeling” was seen in the simulation by tracking an electron from the drift region to an anode, then randomly perturbing each component of the track endpoint by 50 m as an approximation to the avalanche volume, and then tracking an ion from that location. This crude model was used because full avalanche tracking in the detailed field map was too computationally intensive, but nevertheless it described the scale of the observed transparency reasonably well.
3.1.3 Drift speed
The TREAD group Chapin:1984uk gave a parameterization of TPC drift speed in terms of electric field and pressure. The MuCap experience suggests that this formula provides a useful first approximation. It predicts mm/s for the MuCap conditions, and this is the same value calculated by Garfield. This number agrees only at the level of 3 with the speed of 5.5 mm/s observed from the distribution of drift times, which does match the experience of the CF experiment muCF .
3.2 Experimental operation
The MWPC part of the TPC was designed to operate at voltages up to 6.5 kV, at which it is in principle capable of detecting not only the tracks of incoming muons but also the tracks of outgoing minimum-ionizing decay electrons. In practice, this design voltage was never sustained because excess currents and sparks typically began to appear in the range 5–6 kV, leading to voltage trips. This behavior was unexpected, since the prototype TPC was able to operate at 6.4 kV, successfully detecting minimum-ionizing and Auger electron signals Maev:2001 ; Maev:2001yx .
At the outset of the 2004 data taking run, the TPC achieved a maximum stable operating voltage of 5.2 kV. Over the ensuing weeks, the maximum voltage gradually deteriorated to 4.8 kV; most of the 2004 data was collected at 5.0 kV. The exact reasons for this behavior remain unclear, though it is hypothesized that dust accumulation on the MWPC wires could be responsible. A 1-mm-thick Al plate was installed underneath the MWPC prior to the 2004 run in an attempt to prevent dust from collecting on its wires.
For the 2006 run, the maximum stable operating voltage was increased to 5.45 kV. This was accomplished through improvements in the procedures for cleaning the TPC between experimental runs, and by conducting more cautious training of the TPC in the months leading up to the runs (e.g., the operating voltage was ramped up very slowly). The half-gaps between the MWPC planes were increased from 3.5 mm to 3.64 mm; this change required the high voltage be increased by 90 V to achieve the same gain as before. Unfortunately, stable operation at the increased operating voltage was not possible in 2007, and it had to be lowered again. These running conditions and the associated gas amplification factors predicted by Garfield are summarized in Table 1. The validation of the Garfield simulations with experimental data is described in sect. 3.1.1.
| Year | 2004 | 2006 | 2007 |
|---|---|---|---|
| Cathode voltage (kV) | 5.0 | 5.45 | 5.1 |
| Half-gap (mm) | 3.5 | 3.64 | 3.64 |
| MWPC gas gain | 125 | 320 | 132 |
Prior to the start of every run period—and also whenever the TPC’s maximum stable operating voltage changed during a run—the three signal energy thresholds (EL, EH, EVH) were manually tuned until incoming muon tracks exhibited the correct appearance in the graphical event display (see fig. 3). During data taking, operators continuously monitored the stopping distribution of beam muons in the TPC using an online display (fig. 8) which relied on a simplified version of the analysis software to process the incoming data in real time. Depending on the beam tune, approximately 55%–65% of the muons passing through the SC detector stopped inside the sensitive volume of the TPC.
3.3 Data analysis
3.3.1 Identification of muon tracks
A good muon stop in the TPC characteristically appeared in the discriminated anode data as a nearly continuous trail of EL pixels terminating in one or more EH pixels (see fig. 3 and the accompanying text). A similar signature appeared simultaneously in the cathode data, though this direction was generally more complex to interpret because it was parallel to the muon velocity; also, the anodes collected the drift charges while the cathodes received only a pickup signal. Our basic approach to identifying muon stop candidates in the TPC, therefore, was to search for clusters of EH pixels in the anode data and then inspect the surrounding anode and cathode data for evidence of an associated EL track.
To facilitate track analysis, the raw TPC data was first placed into a time- and position-ordered array consisting of three stacked layers, where each layer contained hit information from one of the discriminated energy thresholds: EL, EH, and EVH. The track-finding algorithm began by searching the anode EH data for clusters of one or more nearly contiguous pixels. Once the boundaries of an EH cluster had been determined, the software searched in the upstream and downstream directions for an attached track by following any trails of anode EL pixels leading away from the EH cluster. Small gaps between pixels were allowed, and the algorithm was capable of pursuing any number of branches in the trail. In this way, the software ascertained the length and extent of any tracks connected to the EH cluster. Lastly, the algorithm searched for cathode hits coincident with the anode EH cluster (to get the position of the muon stop) and with any tracks downstream of the EH cluster (to identify muons that escaped out of the side of the TPC).
Though simple, this algorithm was consistent and reliable, and it enabled analysis and correction of systematic biases. The analysis of data from the 2004 run used only this approach of counting pixels in EH clusters and connected EL tracks, requiring that they be within the fiducial volume; in that analysis, a correction was applied to account for muons scattered through large angles out of the TPC. This correction was avoided in the analysis of data from the 2006–2007 runs by imposing additional requirements on the muon track. Because the maximum range of the proton following a scattering event was 1 mm, it was able to trigger at most one EH pixel. Consequently, a minimum of two pixels was required to consider an EH cluster as a muon stop. Each track was also required to fit acceptably to either a single straight line or a two-segment bent line that would correspond to a small-angle forward scatter. Cuts were also made requiring a minimum track length and enforcing a maximum distance between the stop location and the track endpoint. While these additional requirements effectively removed the large-angle scattering events, they also increased the sensitivity of the muon stop definition to interference from minimum-ionizing Michel electron tracks if they crossed near the stopping point, requiring a new correction for that effect.
3.3.2 Fiducial volume cuts
To select the desirable muons that stopped inside the TPC’s fiducial volume, a series of cuts were applied to the track information collected for each candidate. In the dimension there had to be cathode hits (EL or EH) coincident in time with the anode EH pixels corresponding to the muon’s ostensible stopping point. Tracks with cathode hits near the edges of the sensitive volume were cut in order to discard muons that might have escaped through the sides of the TPC. Similar considerations applied to the dimension, though in addition there had to be a trail of anode EL hits leading up to the EH pixels of the muon stop.
Fiducial cuts in the dimension required special care, for the following reason: Although outgoing decay electrons did not generate tracks in the TPC, we discovered that they occasionally deposited sufficient energy to trigger the EL threshold, and that this effect was correlated with the direction of emission. As a result, cuts based on the presence of extraneous EL pixels in the immediate vicinity of the muon’s stopping point skewed the observed decay time spectrum in both a time- and space-dependent manner—in particular, they generated a nonstatistical nonuniformity in the decay rates measured by the 16 segments of the surrounding eSC detector. To avoid this distortion, we performed a “double-walled” cut in which all pixels associated with a muon track had to be contained inside a pair of outer boundaries (to ensure the muon did not leave the TPC) while the EH pixels corresponding to the Bragg stop had to lie inside a pair of inner boundaries. The modest spatial separation between these two sets of boundaries accomplished the required fiducial cut while effectively avoiding both systematic distortions and excessive losses in statistics.
The fiducial cut boundaries in all three dimensions are illustrated in fig. 3. More detailed explanations of the muon track topologies and fiducial cuts can be found in refs. Banks:PhD ; Clayton:PhD ; Kiburg:PhD .
3.3.3 Decay time spectrum
The immediate goal of the MuCap experiment was to determine the effective disappearance rate in hydrogen from the measured time spectra of decay electrons. These spectra were constructed by histogramming the elapsed times between muon arrivals and electron emissions, , as established by the SC and eSC detectors.
The TPC was used to select the SC arrival times that corresponded to good muon stops in the hydrogen gas. However, the TPC itself relied on the SC to determine the drift times (and hence positions) of muon tracks. This interdependency led to problems when multiple tracks were present in the TPC at the same time: due to the entanglement of time and position in the dimension, in such cases it was impossible to unambiguously match SC arrival times with muon tracks in the TPC. If left untreated, this ambiguity would have allowed some SC times to be approved by uncorrelated TPC tracks, thereby generating two “wrong-electron” components in the accidental background of the decay time spectrum: an innocuous uniform background, and a wide hump whose peak would lie underneath the decay time spectrum.
To avoid the latter, unwanted distortion in the accidental background, only muons separated in time by 25 s from other muon arrivals were accepted. The pileup protection interval was deliberately chosen to be slightly larger than the maximum TPC drift time of s to ensure there was only one muon track in the TPC in for the full drift period following a muon arrival. In the 2004 run this condition cut the usable statistics by 68%, but it eliminated the possibility for ambiguity when associating SC times with TPC tracks, and it dramatically improved the signal-to-background ratio. The resulting effect on the decay time spectrum is shown in fig. 9.
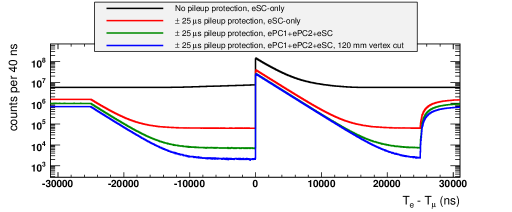
A muon-on-demand kicker apparatus Barnes was installed in the PSI E3 beamline in preparation for the 2005 running period. This device enabled individual muons to be gated into the detector at controlled times, largely avoiding the 2004 pileup losses and increasing the good data collection rate by a factor of 3.
Further suppression of the accidental background in the decay time spectra was achieved by performing a vertex cut on the impact parameter between each decay electron’s trajectory and its parent muon’s stopping point, as shown in fig. 9. It is also worth noting that the concentration of deuterium in the protium gas and its effects could be determined by studying how the decay time spectra vary with the size of the vertex cut Clayton:PhD .
3.3.4 hydrogen gas impurities
The TPC also functioned as an in situ monitor of the levels of unwanted elements in the purified hydrogen gas. This capability proved invaluable, as it enabled us to track contamination levels and evaluate the performance of the hydrogen cleaning and circulation system (CHUPS) in near-real time. The TPC data was also used in the offline analysis to perform a zero-extrapolation correction for the effects of residual impurities on the decay time spectrum.
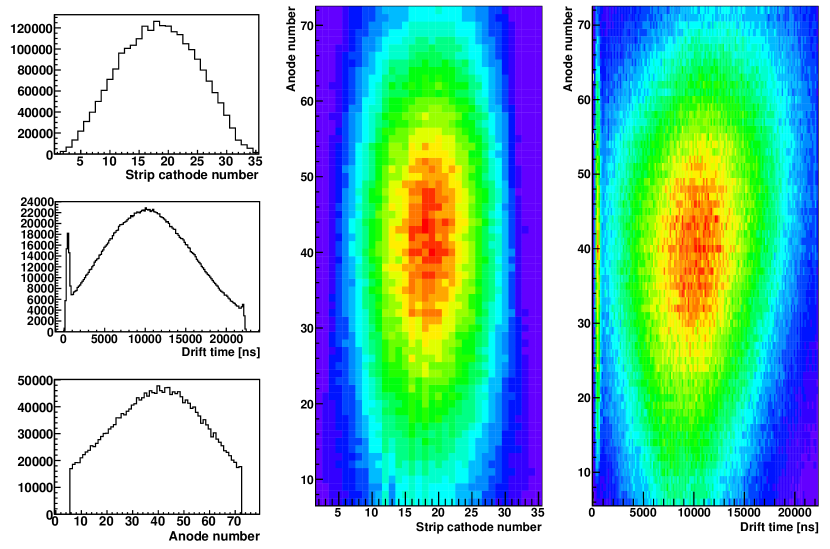
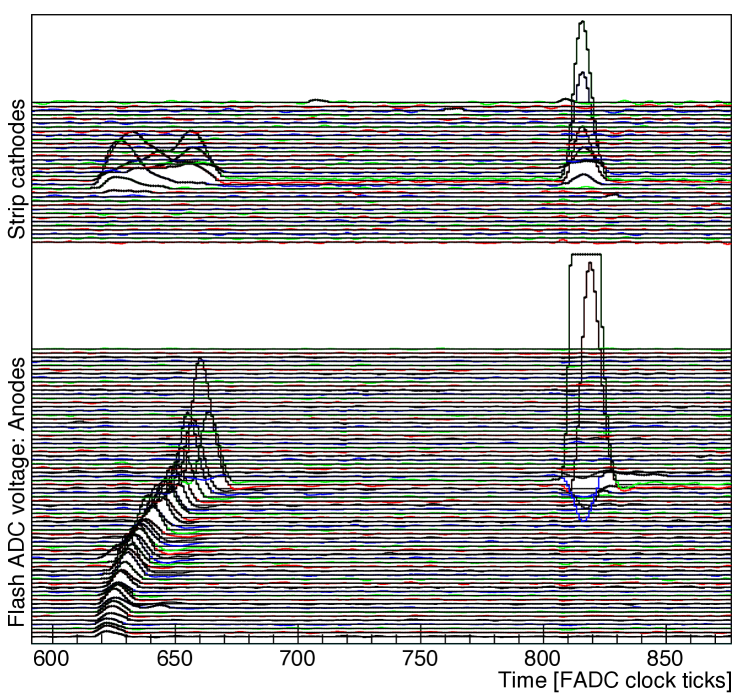
When a muon underwent nuclear capture by a element inside the TPC, the recoiling nucleus could deposit enough energy to trigger the EH and EVH thresholds, depending upon the nucleus and direction of recoil. The signature of such an event was a time-delayed cluster of EH and/or EVH pixels on or near the anode where the muon stopped. The discriminated TDC400 and FADC data from a typical capture event are shown in figs. 10 and 11, respectively.
To identify capture events in the TPC data, we searched for EH and EVH pixels in the time following each 25-s-pileup-protected muon stop that was unaccompanied by a decay electron candidate within a 0–20 s period. The capture search was limited to a 1–10 s time interval and a 3 anode interval (inclusive) from the anode corresponding to the muon stop, as illustrated in fig. 10. The 1 s gap between the end of the muon track and the start of the capture search was necessary to avoid events in which the muon stop signal and an EH capture signal overlapped. The finite time window was sufficient to observe a maximum of 85% of captures, assuming the majority of contaminants were nitrogen and oxygen. As a control on the capture search, a similar search was performed in the opposite direction—that is, leftwards, in the time preceding the muon stop. The “impurity capture” yields () from these control searches in the data were nearly identical to the “capture” yields in the data, supporting the veracity and reliability of the control results.
The impurity capture yields from the TPC data tracked in time with external events in the gas system—namely, changes in the operating status of CHUPS, and the intentional addition of impurities for calibration purposes. When CHUPS was turned on, the TPC capture yield asymptotically approached a level as low as 3.4 ppm, corresponding to a minuscule humidity concentration of about 9 ppb. The yield was observed to shift up or down with changes to the rate at which the gas was purified and circulated. Materials inside the pressure vessel continued to outgas, despite the prolonged baking of the hydrogen system prior to the run; the primary contaminant was oxygen in the form of water.
Although CHUPS was effective in suppressing impurities, nonnegligible levels of contamination were still observed in the hydrogen gas Andreev:2012fj . As a result, it was necessary to perform a zero-extrapolation correction in the offline analysis for the effects of impurities on the muon decay time spectrum. The TPC-based impurity capture yield was the primary observable used to perform this correction. The impurity concentrations always remained well below the limits (roughly 30 ppm for nitrogen and 14 ppm for oxygen) where their effects on the muon lifetime spectrum would start to become nonlinear.
3.3.5 Information derived from the flash ADCs
The FADCs played an auxiliary but valuable role in the experiment. They were used to calibrate the anode energy scales and thresholds, study the gain stability over time, and obtain spectral information about the capture recoils which the primary discriminated signals could not provide. The FADCs were triggered by an FPGA with a prescaled minimum-bias trigger and two triggers selecting rare capture events within the central 48 anode wires of the TPC. One trigger simply fired on any EVH signals, while the other trigger searched for two consecutive EH triggers on the same anode. A pulse finding algorithm defined the time, amplitude and energy of pulses above the software threshold, and these pulses were then matched to the corresponding TDC signals.
The energy spectrum for typical muon stops is shown in fig. 12. Here anode denotes the muon stopping anode identified by the TDC track finding algorithm, and anodes are upstream of that stopping anode by positions. The Bragg curve becomes flatter with increasing distance to the stopping point, and as a result the energies deposited on upstream anodes fell within relatively narrow ranges, as indicated by the well-defined peaks for anode and in fig. 12. The energy deposited on anode , however, could range from 0 to 250 keV, depending how deeply the muon penetrated the 4 mm region covered by the anode. The well-defined energy depositions in anodes through were used used to calibrate the energy scale for all anodes by adjusting their values to predictions from GEANT and SRIM Ziegler . The data in fig. 12 was compiled from muon stops on the central anodes.
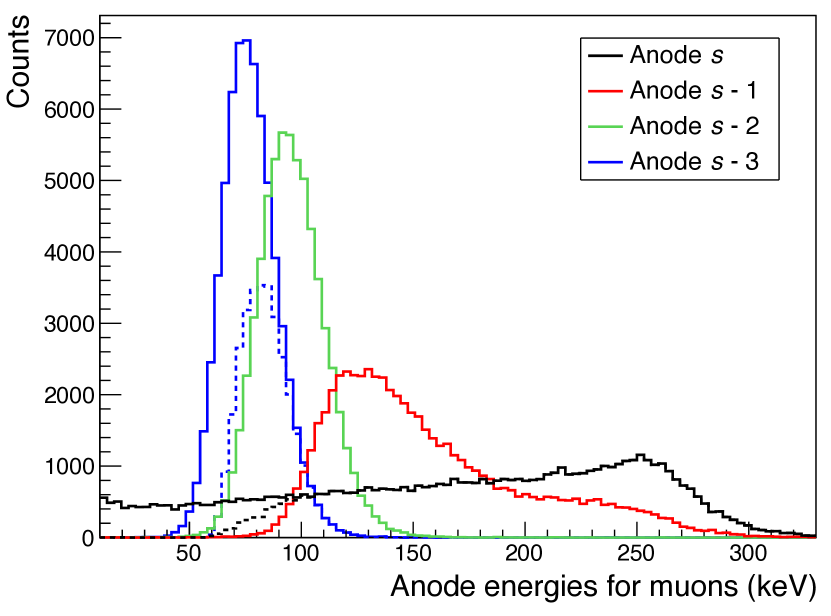
The TDC thresholds were determined for individual wires from the half-height of the threshold curve, obtained by dividing the energy spectra gated by thresholds EL, EH and EVH by the ungated spectra. The value of EL differed depending on the gas gain during each individual data-taking period, as it was set above noise. The EH and EVH thresholds were set according to the muon energy deposition and rarely changed. Typical values obtained by the FADC-based calibration are given in sect. 2.2. The average EH threshold can also be read off fig. 12, where the dashed spectra show the threshold effect on anode and , respectively. The location of the EVH threshold can similarly be determined from fig. 13, which shows the energy spectra from capture events that fired the EH and EVH capture trigger in a nitrogen-doped run. The selection was based on a similar capture search algorithm as described in sect. 3.3.4.
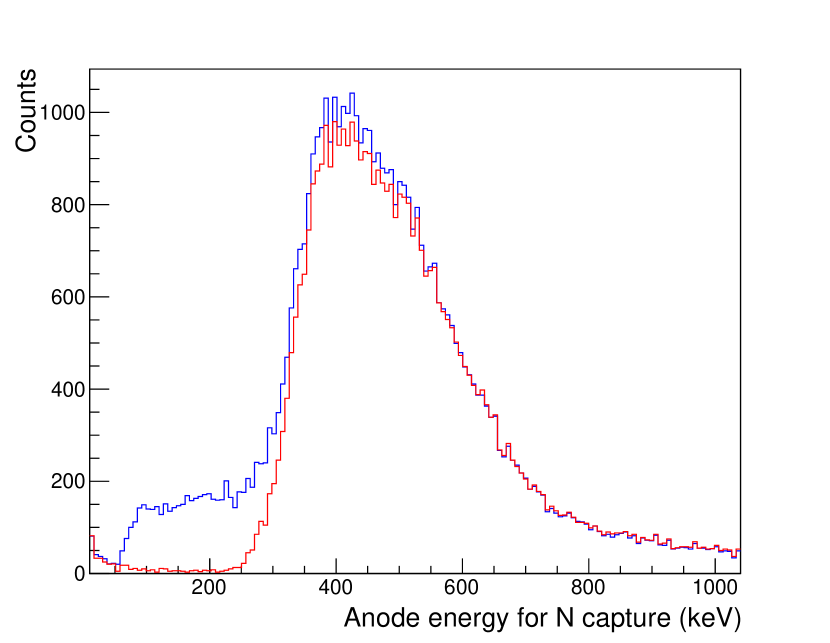
For the impurity capture analysis, the stability and reproducibility of the EVH threshold was most important. The impurity correction was based on the yield of capture events with energies above the EVH setting; the threshold had to be stable within a data-taking run so that the yield measured with a doped calibration mixture could be applied to the pure protium data. The nitrogen calibration was measured in the 2004 and 2006 runs but not in 2007, so threshold consistency across the runs was also required. The EVH setting remained stable to 10% during each run and within 10% between them. Based on the observed capture energy spectra, this was sufficient to apply the impurity correction.
4 Conclusions
The MuCap experiment employed a first-of-its-kind, high-pressure hydrogen-gas TPC as the central detector in a precision measurement of the rate of nuclear muon capture in protium. The device was crucial to the collection of fully tracked muon decay events in hydrogen. The resulting measurement of the lifetime of the singlet atom had a precision of 16 ppm, allowing the nuclear muon capture rate to be determined at the 1% level. The experiment ultimately confirmed precise theoretical predictions from chiral perturbation theory for the value of the weak nucleonic pseudoscalar coupling Andreev:2012fj .
The MuCap experiment also pioneered the use of the TPC as a chemical impurity detector, observing nuclear recoils from capture on elemental impurities in the hydrogen. In this role it enabled precise corrections to be made to the lifetime for effects arising from the presence of nitrogen and oxygen contamination in the hydrogen gas at the 10 ppb level. The TPC provided continuous, in situ monitoring of the impurity level, in contrast to procedures like gas chromatography that operate on discrete samples.
The expertise gained from the operation of the MuCap TPC has been vital to the development of a new -filled TPC for use in the MuSun experiment, which seeks to measure the rate of muon capture in deuterium. This next logical step in the progression of muon capture experiments requires deuterium gas cooled to 30 K Andreev:2010wd ; doi:10.1146/annurev-nucl-100809-131946 . The overall program systematically explores the physics and operation of ultra-pure hydrogen TPCs, covering a density range 10-70 times higher than standard chambers at atmospheric pressure.
Acknowledgments
The authors wish to thank all members of the MuCap collaboration for allowing the experimental data to be used in this publication, as well as all staff who made possible the construction of this instrument. This work was supported by U.S. National Science Foundation, the U.S. Department of Energy, CRDF Global, PSI, the Russian Academy of Sciences, and the Grants of the President of the Russian Federation.
References
- (1) D.V. Balin et al. (MuCap Collaboration), PSI Proposal R–97–05 (1996)
- (2) V.A. Andreev et al. (MuCap Collaboration), PSI Proposal R–97–05.2 (2001)
- (3) V.A. Andreev et al. (MuCap Collaboration), Phys. Rev. Lett. 99, 032002 (2007), 0704.2072
- (4) V.A. Andreev et al. (MuCap Collaboration), Phys. Rev. Lett. 110, 012504 (2013), 1210.6545
- (5) V. Bernard, N. Kaiser, U.G. Meissner, Phys. Rev. D50, 6899 (1994), hep-ph/9403351
- (6) V. Bernard, L. Elouadrhiri, U.G. Meissner, J. Phys. G28, R1 (2002), hep-ph/0107088
- (7) A. Czarnecki, W.J. Marciano, A. Sirlin, Phys. Rev. Lett. 99, 032003 (2007), 0704.3968
- (8) H.J. Hilke, Reports on Progress in Physics 73(11), 116201 (2010)
- (9) E.M. Maev et al., Hyperfine Interact. 138, 451 (2001)
- (10) E.M. Maev et al., Nucl. Instrum. Meth. A515, 288 (2003)
- (11) E.M. Maev et al., Nucl. Instrum. Meth. A478, 158 (2002)
- (12) J. Egger, M. Hildebrandt, C. Petitjean, Nucl. Instrum. Meth. A628, 199 (2011)
- (13) V. Tishchenko et al. (MuLan Collaboration), Phys. Rev. D87, 052003 (2013), 1211.0960
- (14) T.I. Banks, Ph.D. thesis, University of California, Berkeley (2007)
- (15) S.M. Clayton, Ph.D. thesis, University of Illinois at Urbana-Champaign (2007)
- (16) B.E. Kiburg, Ph.D. thesis, University of Illinois at Urbana-Champaign (2011)
- (17) S.A. Knaack, Ph.D. thesis, University of Illinois at Urbana-Champaign (2012)
- (18) A. Vorobyov et al., Nuclear Instrum. Meth. 119, 509 (1974)
- (19) J. Burq et al., Nuclear Physics B217, 285 (1983)
- (20) C. Demonchy et al., Nucl. Instrum. Meth A583, 341 (2007)
- (21) D. Balin et al., Phys. Particles Nuclei 42, 185 (2011)
- (22) T.J. Chapin et al., Nucl. Instrum. Meth. A197, 305 (1982)
- (23) T.J. Chapin et al., Nucl. Instrum. Meth. A225, 550 (1984)
- (24) I. Jovanovic et al., IEEE Trans. Nucl. Sci. 56, 1218 (2009)
- (25) M.E. Rose, S.A. Korff, Phys. Rev. 59, 850 (1941)
- (26) D.J. Rose, Phys. Rev. 104, 273 (1956)
- (27) S. Biagi, Nucl. Instrum. Meth. A421, 234 (1999)
- (28) R. Veenhof, Nucl. Instrum. Meth. A419, 726 (1998)
- (29) I. Alekseev et al., preprint PNPI-2702 (2006)
- (30) H.A. Synal, M. Stocker, M. Suter, Nucl. Instrum. Meth. B259, 7 (2007)
- (31) V.A. Ganzha et al., Nucl. Instrum. Meth. A578, 485 (2007), 0705.1473
- (32) N. Majumdar, S. Mukhopadhyay, Nucl. Instrum. Meth. A566, 489 (2006), physics/0604030
- (33) F. Sauli, Nucl. Instrum. Meth A386, 531 (1997)
- (34) Y. Giomataris et al., Nucl. Instrum. Meth A376, 29 (1996)
- (35) O. Bunemann, T.E. Cranshaw, J.A. Harvey, Can. J. Res. 27(A), 191 (1949)
- (36) M. Barnes, G. Wait, IEEE Trans. Plasma Sci. 32, 1932 (2004)
- (37) J.F. Ziegler, http://www.srim.org/
- (38) V. Andreev et al. (MuSun Collaboration), PSI Proposal R–08–01 (2008), 1004.1754
- (39) P. Kammel, K. Kubodera, Ann. Rev. Nucl. Part. Sci. 60, 327 (2010)