The pressure-induced enhancement of superconducting properties of single-crystalline FeTe0.5Se0.5
Abstract
The pressure dependence, up to 11.3 kbar, of basic parameters of the superconducting state, such as the critical temperature (), the lower and the upper critical fields, the coherence length, the penetration depth, and their anisotropy, was determined from magnetic measurements performed for two single-crystalline samples of FeTe0.5Se0.5. We have found pressure-induced enhancement of all of the superconducting state properties, which entails a growth of the density of superconducting carriers. However, we noticed more pronounced increase in superconducting carrier density under pressure than that in the critical temperature what may indicate an appearance of a mechanism limiting the increase of with pressure. We have observed that the critical current density increases under pressure by at least one order of magnitude.
pacs:
74.62.Fj, 74.70.Xa, 74.25.Op, 74.25.Sv, 74.25.Bt1 Introduction
The discovery of superconductivity in the Fe-based oxypnictide compounds [1] has sparked tremendous interest and opened up new perspectives in the field of superconductivity [2, 3, 4, 5, 6]. Until now, the following groups of Fe-based superconductors are known: REOFeAs, (”1111”, RE = rare earth) [1], AFe2As2 (”122”, A = alkaline earth) [2], LiFeAs (”111”) [3], Fe(Se,Ch) (”11”, Ch = S, Te) [4, 5], and Sr2MO3FePn (”21311”, M = Sc, V, Cr, and Pn = pnictogen) [6]. Within the ”11” group, pure FeSe exhibits superconductivity below 8 K [4]. The tetragonal compounds FeSe and FeTe1-xSex have a quite simple structure, with Fe and Te/Se layers additionally with Fe excess, alternating along the c-axis [4, 7, 8]. These compounds have attracted much interest because of their similarities to the high- iron pnictides. The values of critical temperature in these compounds are much lower than those of FeAs-based superconductors. However, the simplicity of structure and similarity in the Fermi surface among pnictides make studies of FeTe1-xSex potentially useful for understanding of the mechanism of superconductivity in all Fe-based oxypnictides. Partial substitution of Te for Se leads to an increase of up to about 14 K for Fe1-yTe1-xSex with and [7, 9].
The application of external pressure (P) to the pure FeSe has led to a raise of [10, 11, 12, 13] up to 36.7 K at 89 kbar [11]. Interestingly, a similar high 30 K is attained in the iron-selenide family AxFe2-ySe2 by intercalating alkaline earth atoms (A = K, Rb, Cs) between the FeSe layers [14, 15, 16]. However, is found to decrease with pressure and is fully suppressed at 90 kbar for KxFe2-ySe2 [17] and at 80 kbar for CsxFe2-ySe2 [18]. The critical temperature is very weakly dependent on pressure below 10 kbar, suggesting that is almost independent of small variations of the lattice constants.
In the case of FeTe0.5Se0.5, the increases with P [19, 20, 21] up to 26.2 K for P = 20 kbar [19]. It is interesting that at higher pressures (above 20 kbar), decreases [19, 20] down to zero at about 110 kbar [20]. This was explained as a result of the pressure-induced disordering of the Fe(Se,Te)4 tetrahedra, noticed at 110 kbar in X-ray diffraction studies at room temperature [20, 22].
However, the pressure studies of superconductivity in Fe(Se,Ch) system were limited mainly to a tuning of . The pressure dependence of the upper critical field () was investigated for polycrystalline FeSe, only [10]. Still, nothing is known about the pressure dependence of the lower () and the upper critical fields, and their anisotropies for single-crystalline FeTe1-xSex. There is a lack of data on the pressure impact on the critical current density () in FeTe1-xSex. Since we have established earlier [23] that the sharpness of a transition to the superconducting state in FeTe1-xSex is evidently inversely correlated with crystallographic quality of the crystals, we decided to perform pressure studies of two FeTe0.5Se0.5 single crystals of significantly different crystallographic quality.
The lower critical field, related to London penetration depth, provides information about the density of superconducting carriers. The upper critical field, directly related to the coherence length, and its temperature dependence, provide some information about pairing mechanism and pairing strength. Both microscopic quantities, together with the critical current density, are important for application purposes as well. In this paper, the pressure dependence of the lower and the upper critical fields and of the critical current density in FeTe0.5Se0.5, is presented. The hydrostatic external pressure, up to 11.3 kbar, has led to a more pronounced increase in superconducting carrier density than that in the critical temperature, what may indicate an appearance of a mechanism limiting the increase of with pressure.
2 Synthesis and experimental techniques
Single crystals of nominal composition FeTe0.5Se0.5 have been grown using Bridgman’s method. The studied samples were prepared from stoichiometric quantities of iron chips (3N5), tellurium powder (4N), and selenium powder (pure). All of the materials were weighed, mixed and stored in a glove box in argon atmosphere. Double walled evacuated and sealed quartz ampoule with starting materials was placed in a furnace with a vertical gradient of temperature equal to 1.2 oC/mm for the Sample I and 0.6 oC/mm for the Sample II. The material was synthesized for 3 h at temperature 730 oC and next temperature was risen up to 920 oC. After melting, the temperature was held for 3 h, then the sample was cooled down to 500 oC with a rate of 1.5 oC/h (Sample I) or 3 oC/h (Sample II) and next to 200 oC with a rate of 60 oC/h for both samples, and finally cooled down with the furnace to room temperature. As a result, we have obtained two single crystals with different crystallographic quality. In our case, the crystal quality was determined by the value, describing the full width at half maximum (FWHM) of the 004 X-ray diffraction peak, obtained in the scan measurements, since changes in the c-axis lattice constant are very sensitive to the variation in chemical composition of studied materials [23]. The 004 peak is relatively intense and appears at sufficiently large angles to get a good angular resolution. The crystals, with values equal to 10.32 (labeled as Sample I) and to 16.65 (labeled as Sample II) arc min, have been grown with velocities of 1.2 and 5.2 mm/h, respectively. Obtained single crystals exhibit (001) cleavage plane and the Sample I with better crystallographic quality has also well developed (100) natural planes.
The quantitative point analysis on the cleavage plane of the crystals was performed by Field Emission Scanning Electron Microscopy (FESEM) JEOL JSM 7600F operating at 20kV incident energy coupled with the Oxford INCA Energy Dispersive X-ray spectroscopy (EDX). Average chemical composition of the crystal matrix checked by Scanning Electron Microscopy (SEM) and EDX analysis (accuracy ) is Fe1.00Te0.58Se0.42 and Fe1.01Te0.57Se0.43 for the Sample I and for the Sample II, respectively.
The magnetic measurements were carried out on single-crystalline samples of roughly rectangular shape, in the temperature range of 2300 K, with magnetic field up to 50 kOe, using Quantum Design superconducting quantum interference device magnetometer. The magnetic field was applied parallel to the c-axis of the crystal and to the ab (001) plane, which is perpendicular to the c-axis. Hydrostatic external pressure up to 11.3 kbar was applied, using easyLab Technologies Mcell 10 pressure cell with Daphne 7373 oil [24], being considered as the best pressure medium from the point of view of the smallest decrease of pressure with decreasing temperature, at least in the pressure range above 7 kbar [25]. High-purity Sn wire (0.25 mm in diameter) was employed as an in situ manometer. The background signal associated with the pressure cell was subtracted basing on the results obtained under ambient pressure for the sample placed in pressure cell and for the sample without pressure cell. We noted that the background contribution does not influence obtained results. The measurements of ac susceptibility (field amplitude 1 Oe, frequency 10 kHz) were performed with a Physical Property Measurement System (PPMS) of Quantum Design.
3 Results and discussion
3.1 The critical temperature
For single crystals of FeTe0.5Se0.5, noticeable differences between initial and estimated by EDX chemical composition as well as significant difference in FWHM of the 004 X-ray diffraction peak () are visible (see, for example, Ref. [23]). Usually, they are attributed to a separation of phases with different Se/Te ratios, as reported in several papers [9, 26, 27]. However, the data obtained for monophase single crystals of FeTe0.65Se0.35 [23] indicated that the narrowest transition to the superconducting state (width 0.6 K) exhibit single crystals with relatively large values of equal to 6 arc min. Furthermore, the decrease in the value was found to be correlated with the increase of the width of the transition (90%-10% criterion). This correlation suggests that disorder in some sense enhances superconductivity in the FeTe1-xSex system, and properties of the superconducting state of FeTe1-xSex are very sensitive to the defects present in the sample [23].
The main aim of our work was to study the pressure effect on intrinsic superconducting properties of FeTe0.5Se0.5. Since noticeable differences in the crystallographic quality were found among the crystals grown at various conditions, we decided to perform all of the measurements for two crystals of significantly different crystallographic quality, i.e., for the Sample I and for the Sample II with different value for 004 X-ray diffraction peak.
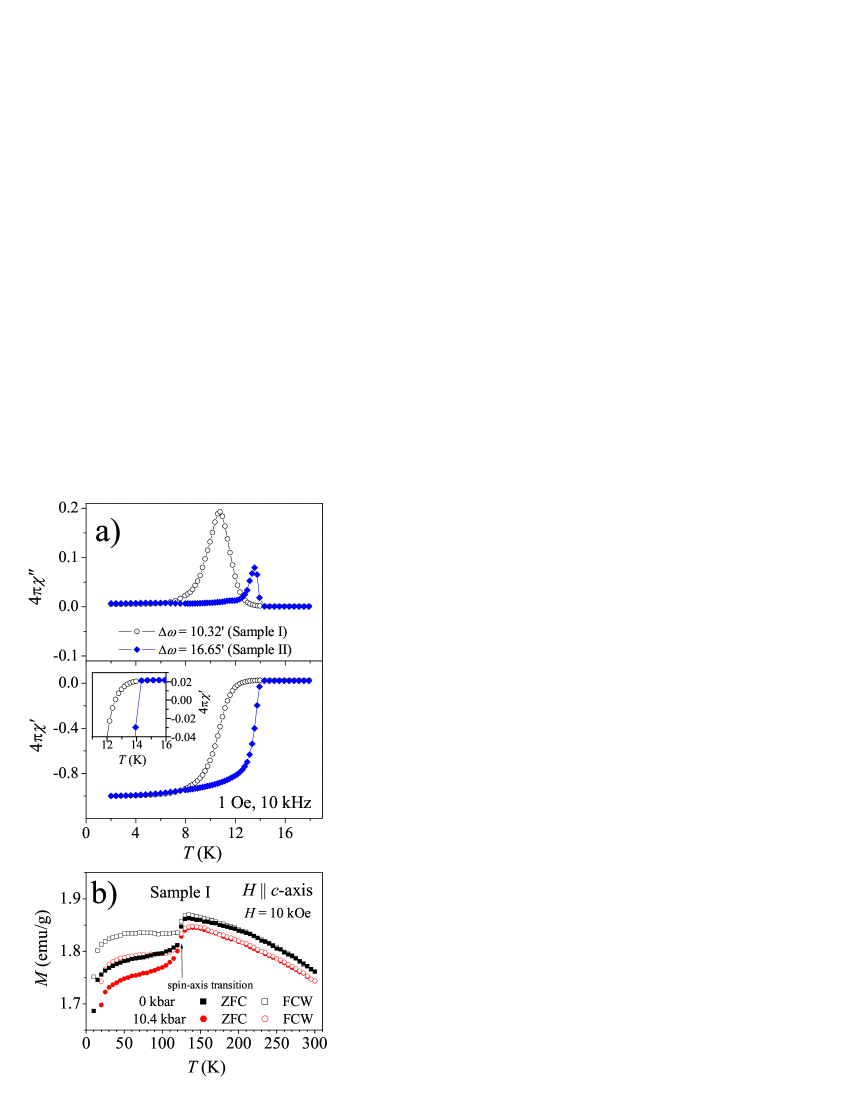
Figure 1a shows temperature dependence of real () and imaginary () parts of ac magnetic susceptibility measured in 1 Oe of ac field with 10 kHz in warming mode for two single crystals, grown with various cooling velocity and vertical gradient of temperature. Presented data were normalized to the ideal value of -1 for the real part of ac susceptibility for better comparison of the susceptibility data obtained for the samples with different shape and therefore subjected to different demagnetizing field. Inset in the lower panel of Fig. 1a shows variation of for the crystals in the vicinity of . It is obvious that, despite of significant difference in the width of the transition to superconducting state, both of the crystals with different crystallographic quality are characterized by almost identical onset of .
Figure 1b presents temperature dependence of dc magnetization measured for the Sample I in wide temperature range up to 300 K in zero-field cooling (ZFC) and field-cooled warming (FCW) modes in magnetic field of 10 kOe, applied parallel to the c-axis of the studied single crystal under ambient pressure and at hydrostatic pressure of 10.4 kbar. Similar behavior not shown was found for the Sample II. In the presented data, there is clearly visible transition at about 130 K, most likely related to spin reorientation of Fe7Se8-type minor phase or to Verwey transition in Fe3O4,[28] coexisting in the crystal with the major tetragonal phase of FeTe0.5Se0.5 [29, 30]. The magnetization does not exceed 1.9 emu/g, therefore the volume fraction of Fe7Se8-type phase or of Fe3O4 should not be greater than few percent. Importantly, both temperature dependences of magnetization, at ambient and at hydrostatic pressure, are characterized by almost identical shape, indicating an absence of structural transition under pressure.
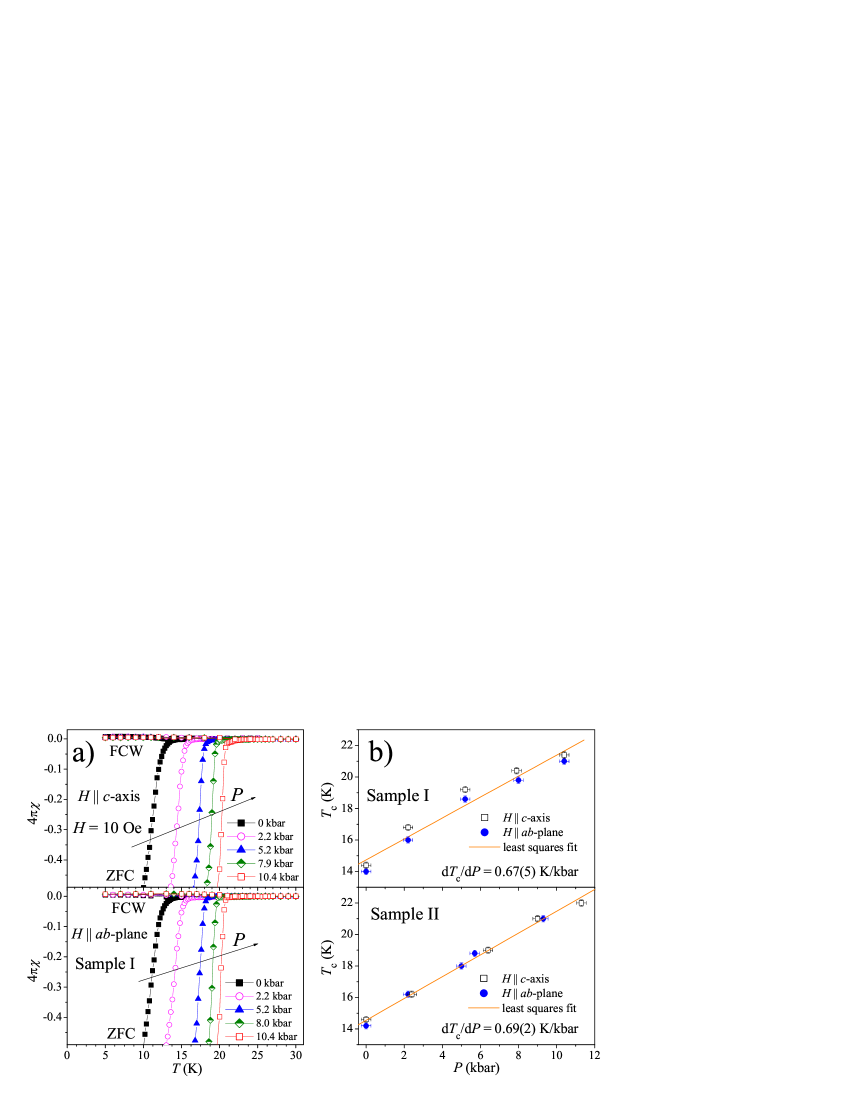
Temperature dependences of magnetic susceptibility in the vicinity of for H c-axis (upper panel) and for H ab-plane (lower panel), measured under ambient pressure and applied hydrostatic pressure up to 10.4 kbar, in dc field of 10 Oe, for the Sample I, are presented in Fig. 2a. The critical temperature was defined as the point at x-axis, where () curve deviates from constant, temperature independent background value. Almost linear dependence of ZFC magnetic susceptibility below , approximated well by parallel lines shifted to lower temperature with increasing pressure, indicates that superconducting transition width is almost unaffected by pressure, at least in the studied, relatively narrow, pressure range. A significant divergence between and curves indicates relatively strong pinning of vortices for both H c-axis and H ab-plane even for the sample of better crystallographic quality (Fig. 2a). It was found that increases linearly with pressure in the investigated pressure range from about 14 K at ambient pressure up to about 21 K at = 10.4 kbar, for both H c-axis and H ab-plane (upper panel of Fig. 2b). This confirms earlier reports on increase, for FeTe0.5Se0.5 compound, in the pressure range of 0-10 kbar [19, 20, 21]. The () dependence for the Sample I, given in the upper panel of Fig. 2b by thick solid line with the pressure coefficient d/d = 0.67(5) K/kbar, is a result of fitting of linear dependence with the least square method applied to the all of the data. Essentially identical data, within an experimental accuracy, were obtained for the Sample II, as it is presented in lower panel of Fig. 2b. The () data for that sample are well approximated by linear dependence with the pressure coefficient d/d = 0.69(2) K/kbar.
3.2 The thermodynamic parameters - the upper and the lower critical fields
In order to estimate the change in the anisotropic thermodynamic parameters of the single crystal of FeTe0.5Se0.5 subjected to hydrostatic pressure, we have evaluated temperature dependence of the upper and the lower critical fields in two geometries, H c-axis and H ab-plane (up to 50 kOe), for the studied samples under ambient pressure and at applied hydrostatic pressure of about 10 kbar.
Temperature dependence of magnetic moment m measured under applied hydrostatic pressure of 10.4 kbar, for selected magnetic fields in the geometry H ab-plane for the Sample I, is presented in Fig. 3a. From the above data we have determined (=const), at the point where () deviates from linear temperature dependence, approximating well magnetic susceptibility in the normal state. The () data determined in this manner for various fields allowed us to plot () dependences for H c-axis and for H ab-plane for the studied samples under ambient pressure and at hydrostatic pressure of about 10 kbar.
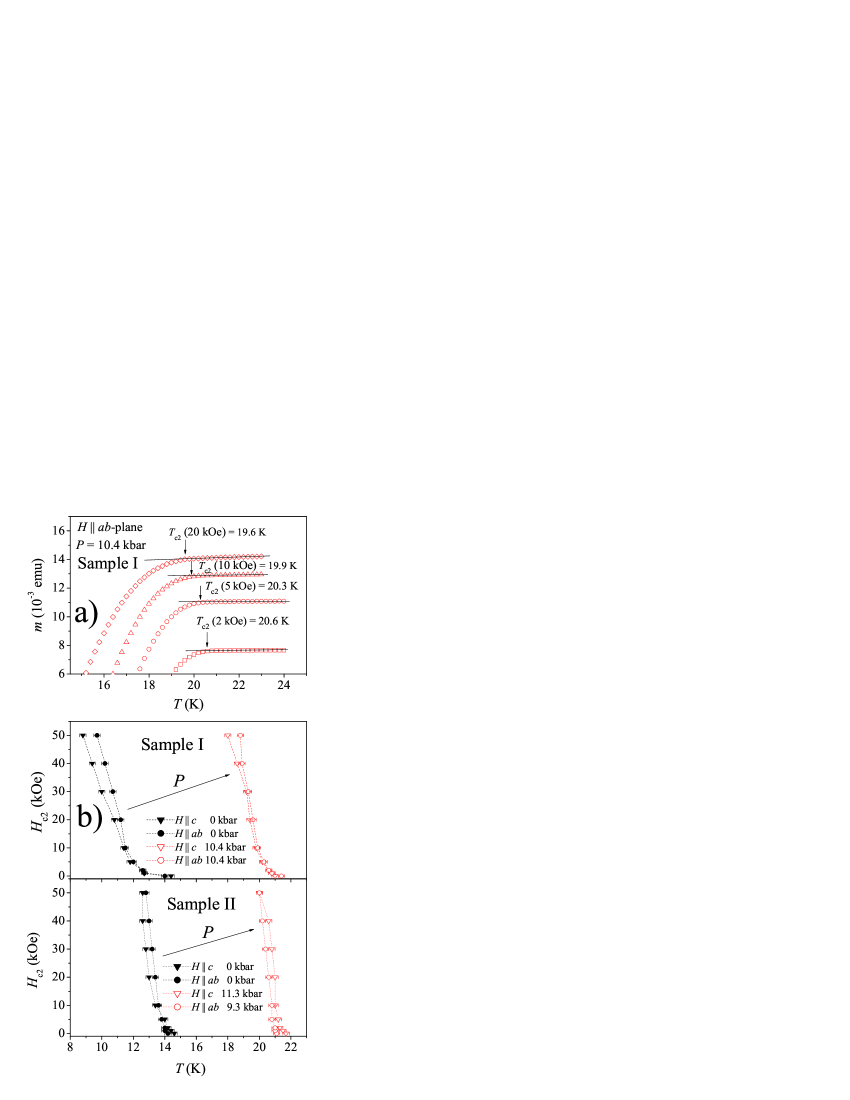
Temperature dependences of the upper critical field for H c-axis () and H ab-plane () for the Sample I at ambient pressure and under hydrostatic pressure of 10.4 kbar are shown in the upper panel of Fig. 3b. Significant increase of the upper critical field under pressure is clearly visible in this figure. Mainly, it results from the increase of by about 7 K under pressure of 10.4 kbar. However, significant increase of the slope d/d in the linear part of () dependence is observed for higher fields. For lower fields, in the vicinity of , one can notice strong curvature. For H c-axis, in the field range between 10 and 50 kOe, we have d/d = 15(1) kOe/K at ambient pressure, which rises up to 22(3) kOe/K under 10.4 kbar. In the case of H ab-plane, an increase from 22(2) kOe/K ( = 0 kbar) up to 34(3) kOe/K under pressure of 10.4 kbar is observed. The anisotropy of the slope d/d in the moderate fields, being equal to about 1.5 for the Sample I under ambient pressure and under pressure of 10.4 kbar, correlates quite well with the anisotropy of the penetration depth in the vicinity of for single crystal of FeTe0.5Se0.5 investigated by Bendele et al[29] under ambient pressure. The estimation of zero-temperature value (0) by extrapolation of the present data, covering a limited temperature range, down to low temperatures [31] is not obvious because of strong curvature of () and possibly multi-band nature of the superconductivity. Nevertheless, assuming that the value of (0) is proportional to and to d/d, determined in relatively wide field range above strong curvature of () in the vicinity of [31], we can estimate a change of (0) from 150 kOe under ambient pressure to 325 kOe under hydrostatic pressure of 10.4 kbar, what corresponds to a decrease of zero-temperature coherence length ab from about 4.7 nm to 3.2 nm, according to relation [32]:
| (1) |
where 0 is elementary flux quantum and ab is the coherence length in the ab-plane.
Lower panel of Fig. 3b presents temperature dependences of the upper critical field for H c-axis and H ab-plane for the Sample II at ambient pressure and under hydrostatic pressure of about 10 kbar. Strong curvature of () in the vicinity of noticed for the Sample I is much more suppressed for the sample with sharper transition to superconducting state (Sample II). Higher values of observed for H c-axis under applied pressure of 11.3 kbar for this sample than those recorded for H ab-plane under pressure of 9.3 kbar are due to the difference in the applied pressure and, therefore, due to the difference in values. The slope d/d, determined in the field range between 10 and 50 kOe, is much larger for the sample with sharp transition to superconducting state (Sample II). For the Sample II, we found the values of d/d equal to about 45(5) kOe/K for H c-axis and to about 50(5) kOe/K for H ab-plane, indicating much smaller value of the upper critical field anisotropy. Furthermore, the slope d/d is within experimental accuracy unchanged under pressure, suggesting that the increase of under pressure is directly related to the changes in under pressure only. Presented data lead to an estimation of a change of (0) from 450 kOe under ambient pressure to 690 kOe under hydrostatic pressure of 11.3 kbar, what corresponds to a decrease of zero-temperature ab from about 2.7 nm to 2.2 nm. Relatively large values of and its small anisotropy for the Sample II most likely result from the extended amount of defects in the structure evidenced by wide X-ray peaks [23] and therefore, they may not correspond to intrinsic values. On the other hand, the sample with larger amount of defects is characterized by stronger interband scattering and appearance of sufficiently strong interband scattering is an essential for enhanced superconducting state properties. Significant suppression of strong curvature of () in the vicinity of for the sample with extended amount of defects may indicate the increasing interband scattering as a result of increasing structural inhomogeneity, consistently with observed increase of the upper critical field in the Sample II with extended inhomogeneity.
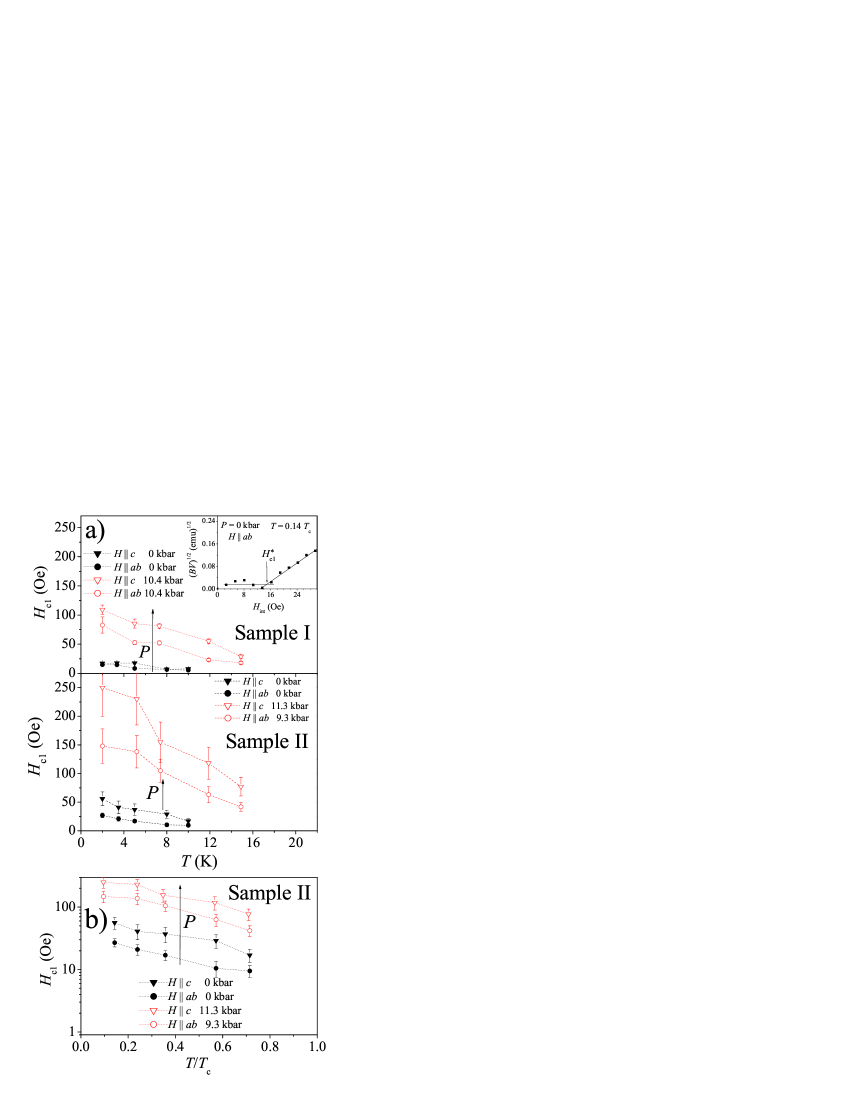
The temperature dependence of the lower critical field was studied by following the field , for which the first vortices start to penetrate the sample at its surface, that is directly related to [29]. The field dependences of the magnetic moment were measured at different temperatures for the magnetic field parallel to the ab-plane and parallel to the c-axis of the sample. For a given shape of the investigated crystal, the demagnetizing factors D were calculated for the magnetic field applied along all of the crystallographic axis. The field was estimated according to the procedure introduced in Ref. [33] and discussed in Ref. [29]. The quantity was calculated from the measured magnetic moment m = MV and plotted as a function of internal magnetic field = , where denotes external magnetic field (see inset to the upper panel of Fig. 4a). Here, denotes the magnetic induction and V is the sample volume. Since = = + = 0 in the Meissner state, it is possible to determine, from the data of , the field above which this equality is invalid. Hence, magnetic induction empirically scales as the square of above , a plot of as a function of allows a straightforward determination of . The sudden increase from zero occurs due to the penetration of vortices at . For the case of weak bulk pinning, surface barrier may play a crucial role and determine the first field of flux penetration and the irreversibility line [34, 35, 36]. The impact of surface barrier leads to asymmetric () loops. The descending branch is in such a case almost horizontal. For our samples, however, we observe symmetric magnetization loops, which means that bulk pinning controls mainly the entry and the exit of magnetic flux and therefore, we assume that is equal to . Temperature dependence of for H c-axis () and H ab-plane () for the Sample I determined at ambient pressure and under hydrostatic pressure of 10.4 kbar is presented in Fig. 4a. Data extrapolated to zero temperature are presented in Table I. Identical procedure was applied for the Sample II. Obtained data are presented in lower panel of Figure 4a. Obviously, the sample with narrow transition to superconducting state is characterized by larger values of (Sample II). It means that the penetration depth for this sample is smaller and the superconducting carrier density is bigger than that of the high crystallographic quality sample (Sample I).
Obtained data additionally indicate that structural disorder originating from kinetics of crystal growth process influences superconducting properties. In particular, our data support an observation that ions inhomogeneous spatial distribution enhances the superconductivity. Since the observed improvement of superconducting state properties is correlated with the suppression of a curvature of () in the vicinity of one may suppose that an increase of interband scattering is directly responsible for the improvement of superconducting properties in the studied multiband superconductor.
| Sample I | Sample II | |||
|---|---|---|---|---|
| Quantity | 0 kbar | 10.4 kbar | 0 kbar | 11.3(*) or 9.3(**) kbar |
| (K) | 14.2(2) | 21.2(2) | 14.2(2) | 22.0(2)* |
| -d/d (kOe/K) | 15(1) | 22(3) | 45(5) | 45(5)* |
| -d/d (kOe/K) | 22(2) | 34(3) | 50(5) | 50(5)** |
| (0) (kOe) | 150(10) | 325(45) | 450(50) | 690(80)* |
| (0) (kOe) | 220(20) | 505(45) | 500(50) | 770(80)** |
| (0) (Oe) | 17(2) | 109(8) | 56(8) | 250(30)* |
| (0) (Oe) | 15(2) | 83(14) | 27(5) | 150(30)** |
| ab(0) (nm) | 4.7(2) | 3.2(2) | 2.70(15) | 2.20(15) |
| c(0) (nm) | 3.9(2) | 2.55(15) | 2.55(15) | 2.05(15) |
| ab(0) (nm) | 740(80) | 275(30) | 400(50) | 180(20) |
| c(0) (nm) | 850(180) | 380(70) | 900(200) | 320(50) |
| ∥c(0) | 160(20) | 85(15) | 150(20) | 80(15) |
| ∥ab(0) | 185(40) | 115(30) | 230(50) | 115(30) |
From the data presented in lower panel of Fig. 4a, extrapolated zero-temperature values for the Sample II, were found to be (0) = 27(5) Oe and (0) = 56(8) Oe at ambient pressure and (0) = 250(30) Oe under pressure of 11.3 kbar while (0) = 150(30) Oe under pressure of 9.3 kbar. The zero-temperature values of the lower critical field for both field configurations correlate very well with the values obtained by Bendele et alfor the single crystals of identical nominal composition [29]. The increases significantly under applied external pressure for all studied temperatures. The reduced temperature dependences of the lower critical field at ambient pressure and under hydrostatic pressure of 11.3 kbar for H c-axis and 9.3 kbar for H ab-plane, are presented in Fig. 4b in semilogarithmic scale. The anisotropy of the lower critical field (Hc1) does not increase under applied hydrostatic pressure, the data presented in Fig. 4b rather indicate slight decrease of Hc1. In order to extract the values of the magnetic penetration depth from the measured values of , the following basic relations were applied [32]:
| (2) |
| (3) |
Here, ab and c denote the magnetic penetration depths related to the superconducting current flowing in the ab-plane and along the c-axis, respectively, ab and c are the corresponding coherence lengths, and ∥c = ab/ab and ∥ab = are the corresponding Ginzburg-Landau parameters. The zero temperature values of ab(0) and c(0) at ambient pressure and under hydrostatic pressure were derived from values of and extrapolated to zero temperature for both field configurations. Then, for the Sample II, the following zero-temperature values of the magnetic penetration depths at ambient pressure were obtained: ab(0) 400(50) nm and c(0) 900(200) nm. These values are in a very good agreement with the values determined by SR measurements [29]. The corresponding zero-temperature values of the magnetic penetration depth at hydrostatic pressure of about 10 kbar, are as follows: ab(0) 180(20) nm and c(0) 320(50) nm. Obviously, estimated low-temperature anisotropy of the penetration depth for FeTe0.5Se0.5 under hydrostatic pressure is significantly smaller than that one under ambient pressure. Furthermore, obtained data suggest that anisotropy of does not increase with decreasing temperature, what is typical for chalcogenides at ambient pressure. However, obtained data are insufficient to make conclusive statement concerning temperature dependence of the anisotropy of the penetration depth in FeTe0.5Se0.5 under pressure. Summary of the changes of thermodynamic parameters under pressure for both studied samples is given in Table I.
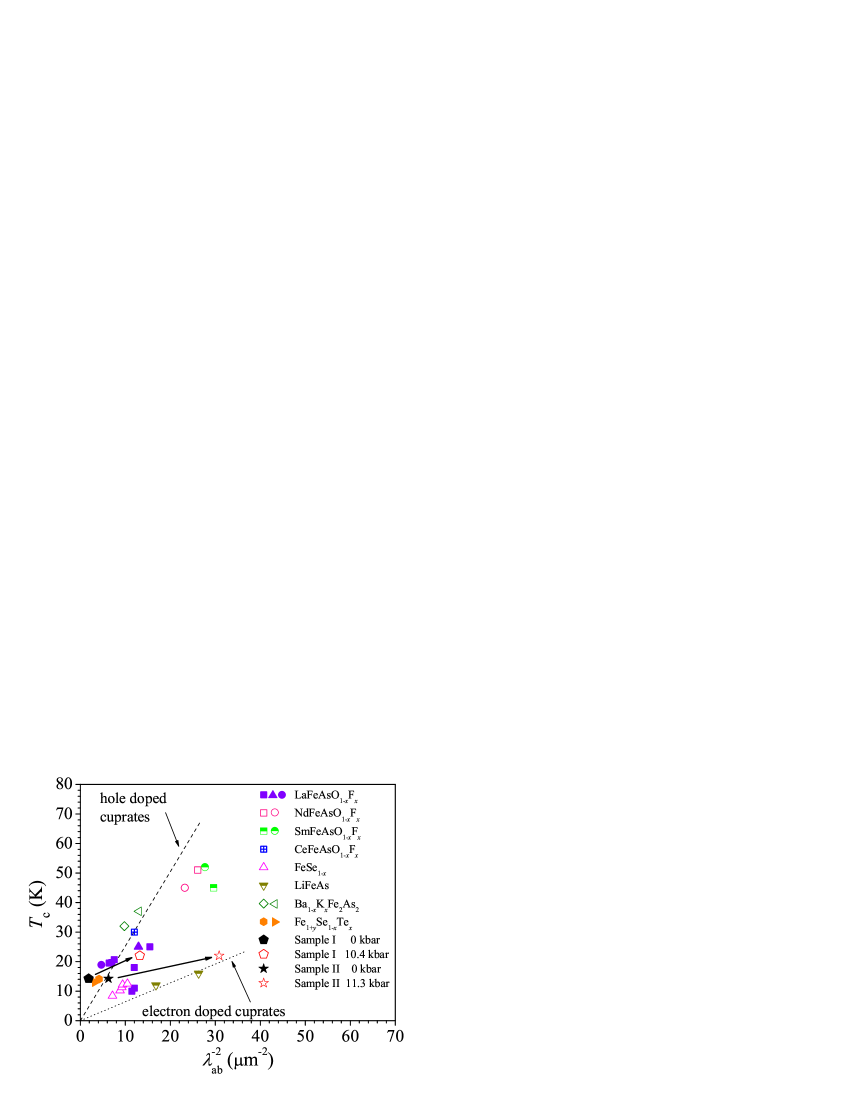
Uemura et al[37] have found an empirical relation between the zero-temperature superconducting carrier density (0) (0) and which seems to be generic for various families of cuprate high-temperature superconductors (Uemura plot). This ”universal” relation () has the following features: with increasing carrier doping initially increases linearly [ (0)], then saturates, and finally is suppressed for high carrier doping. It is interesting to check, how the Uemura relation holds for iron-based superconductors subjected to hydrostatic pressure. For this reason, vs. (0) is plotted in Fig. 5 for a selection of various Fe-based superconductors investigated so far, [29, 38, 39, 40, 41, 42, 43, 44, 45, 46, 47, 48] together with the pressure impact on the position of both FeTe0.5Se0.5 samples investigated in this work. The figure was prepared using the values of (ab(0)) obtained for the Sample I at ambient pressure and under hydrostatic pressure of 10.4 kbar and for the Sample II at ambient pressure and under hydrostatic pressure of 11.3 kbar. The Uemura relation observed for underdoped cuprates is included for comparison as a dashed line for hole doping and as a dotted line for electron doping. The penetration depth values obtained under ambient pressure locate the studied samples in the area of hole-doped compounds. An application of hydrostatic pressure of about 10 kbar shifts the position of studied samples in the diagram (ab(0)) towards the area of electron-doped compounds, instead of the shift along the line denoting hole-doped compounds. The effect is very well visible for the Sample II placed almost ideally on the line denoting hole-doped compounds at ambient pressure as well as on the line denoting electron-doped compounds under hydrostatic pressure of 11.3 kbar. The Sample I, despite of essentially identical value of as the Sample II, is characterized by much higher value of ab(0) both at ambient and under hydrostatic pressure, and therefore its position in the Uemura plot is shifted towards the lower values as compared to those expected for hole-doped and electron-doped compounds, respectively. Obviously, for both studied samples the external pressure affects the density of superconducting carriers. However, it may cause also an induction of magnetic phase, similar to that reported by Bendele et al[49] in FeSe crystal, manifested by () dependence not going along the hole-doped compounds line. Importantly, we noticed more pronounced increase in superconducting carrier density under pressure than that in the critical temperature, what may indicate an appearance of a mechanism limiting the increase of with pressure. However, we should note that the change of lattice constants under pressure leads to the change of superconducting carrier effective mass what affects values of ab(0).
3.3 The critical current density
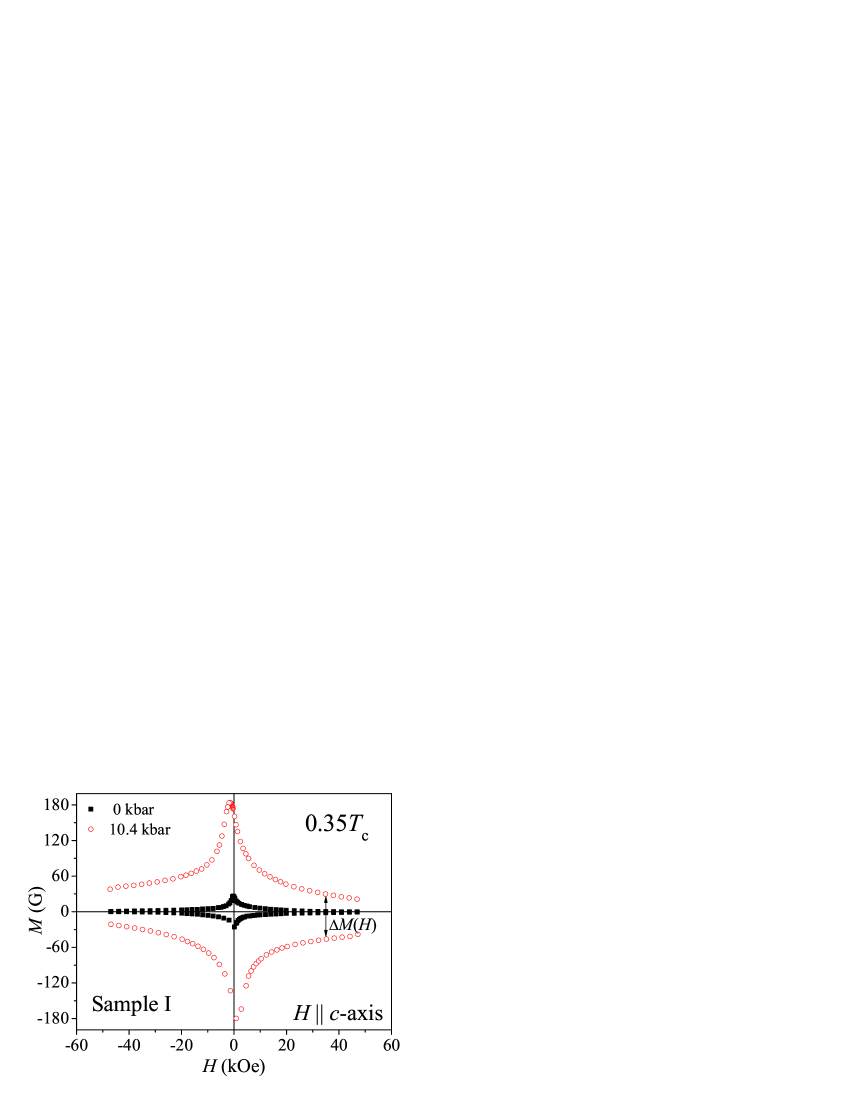
Hysteresis loops of the studied single crystals were recorded at various temperatures in magnetic field applied along both H c-axis and H ab-plane at ambient pressure and under hydrostatic pressure of about 10 kbar. Figure 6 presents typical data recorded for the Sample I for H c-axis at 5 K at ambient pressure and at 7.3 K under hydrostatic pressure of 10.4 kbar, i.e., at the same reduced temperature of 0.35. Using Bean’s model [50, 51], for the sample of rectangular shape, one can estimate the superconducting critical current density according to the formula:
| (4) |
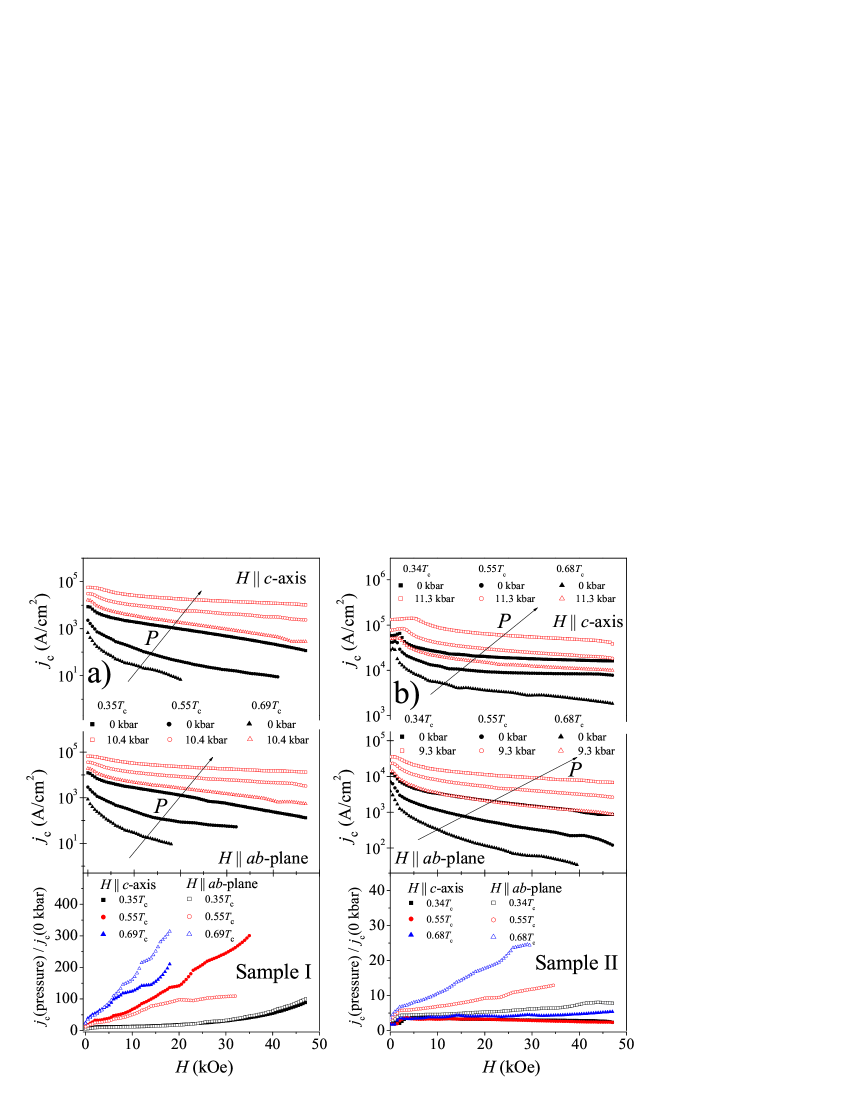
Here, M (in Gauss) is the width of the hysteresis loop (see, Fig. 6), a and b are the sample dimensions (in cm) in the plane perpendicular to applied magnetic field and the critical current density is in A/cm2. Magnetic field dependence of the critical current density for the Sample I at ambient pressure and under hydrostatic pressure of 10.4 kbar, calculated according to the Eq. (4), for all of the studied temperatures in magnetic field geometry H c-axis and H ab-plane is presented in Fig. 7a (upper and middle panels). We note relatively small value of the estimated critical current density, , as compared to those observed in single-crystalline iron pnictides [52]. However, the obtained values are not surprising since it was shown that FeTe0.5Se0.5 may exhibit the coexistence of two tetragonal phases [9, 26, 27]. The presence of such phases lowers the transport current density as phase separation boundaries prevent to develop a global circulating current [29]. This leads to a relatively low value of magnetic critical current density, when calculated taking into account the diameter of the sample. Furthermore, both, the upper and the lower, critical fields for the Sample I are quite small in comparison with those for the Sample II (see, Figs. 3b and 4a and Table I) and pinning is expected to be proportional to the thermodynamic critical field. Field dependence of the increase of the critical current density under pressure, i.e., of the ratio of critical current densities under hydrostatic pressure of 10.4 kbar and at ambient pressure at reduced temperatures of 0.35, 0.55, and 0.69 in magnetic field H c-axis and H ab-plane is presented in lower panel of Fig. 7a. The critical current density strongly increases under pressure by at least one order of magnitude, for H c-axis and H ab-plane, for all investigated reduced temperatures and in full magnetic field range (lower panel of Fig. 7a). It can be explained by an improvement of the effectiveness of small defects in the sample subjected to pressure, because of a decrease of the coherence length under pressure, and by an increase of the thermodynamic critical field under pressure due to the increase of both the lower and the upper critical fields. The influence of pressure on is evidently stronger at higher magnetic fields, up to two orders of magnitude (lower panel of Fig. 7a). It is not surprising since significant increase of under pressure was noted too.
Magnetic field dependence of the critical current density for the Sample II at ambient pressure and under hydrostatic pressure of 11.3 kbar in magnetic field geometry H c-axis and of 9.3 kbar in the H ab-plane geometry for all of the studied temperatures is presented in Fig. 7b (upper and middle panels). Field dependence of the increase of the critical current density under pressure is presented in lower panel of Fig. 7b. The Sample II is characterized by significantly enhanced critical current density at ambient pressure, as compared to the Sample I, because of extended amount of defects in the structure, evidenced by relatively wide X-ray peaks. Consequently, the increase of the critical current density under pressure is strongly reduced for the Sample II, especially in the geometry H c-axis and at low temperatures, where the initial critical current density is the highest.
4 Conclusions
The magnetic studies at ambient and under hydrostatic pressure were performed for single crystals of FeTe0.5Se0.5 in order to investigate the pressure impact on basic parameters of the superconducting state. We compared influence of hydrostatic pressure on the properties of two crystals with significantly different amount of defects. We have found pressure-induced enhancement of all investigated parameters. Furthermore, we noted that the application of hydrostatic pressure does not increase the anisotropy of superconducting state parameters. However, more pronounced increase in superconducting carrier density under pressure than that in critical temperature was found, indicating an appearance of a mechanism limiting the increase of with pressure.
Comparison of pressure impact on superconducting properties of two samples with different amount of defects leads to the following conclusion: significant suppression of strong curvature of () in the vicinity of for the sample with extended amount of defects indicates the increasing interband scattering as a result of increasing structural inhomogeneity. Since the suppression of the curvature of () in the vicinity of is correlated with observed improvement of superconducting state properties one may suppose that an increase of interband scattering is directly responsible for the improvement of superconducting properties in the studied multiband superconductor. It may explain the origin of relatively poor superconducting state properties of the single crystals of better crystallographic quality.
References
References
- [1] Kamihara Y, Watanabe T, Hirano M and Hosono H 2008 J. Am. Chem. Soc. 130 3296
- [2] Rotter M, Tegel M and Johrendt D 2008 Phys. Rev. Lett. 101 107006
- [3] Wang X C, Liu Q Q, Lv Y X, Gao W B, Yang L X, Yu R C, Li F Y and Jin C Q 2008 Solid State Commun. 148 538
- [4] Hsu F-C, Luo J-Y, Yeh K-W, Chen T-K, Huang T-W, Wu P M, Lee Y-C, Huang Y-L, Chu Y-Y, Yan D-C and Wu M-K 2008 Proc. Natl. Acad. Sci. USA 105 14262
- [5] Yeh K-W, Huang T-W, Huang Y-L, Chen T-K, Hsu F-C, Wu P M, Lee Y-C, Chu Y-Y, Chen C-L, Luo J-Y, Yan D-C and Wu M-K 2008 Europhys. Lett. 84 37002
- [6] Ogino H, Matsumura Y, Katsura Y, Ushiyama K, Horii S, Kishio K and Shimoyama J 2009 Supercond. Sci. Technol. 22 075008
- [7] Fang M H, Pham H M, Qian B, Liu T J, Vehstedt E K, Liu Y, Spinu L and Mao Z Q 2008 Phys. Rev. B 78 224503
- [8] Bao W, Qiu Y, Huang Q, Green M A, Zajdel P, Fitzsimmons M R, Zhernenkov M, Chang S, Fang M, Qian B, Vehstedt E K, Yang J, Pham H M, Spinu L and Mao Z Q 2009 Phys. Rev. Lett. 102 247001
- [9] Khasanov R, Bendele M, Amato A, Babkevich P, Boothroyd A T, Cervellino A, Conder K, Gvasaliya S N, Keller H, Klauss H-H, Luetkens H, Pomjakushin V, Pomjakushina E and Roessli B 2009 Phys. Rev. B 80 140511
- [10] Mizuguchi Y, Tomioka F, Tsuda S, Yamaguchi T and Takano Y 2008 Appl. Phys. Lett. 93 152505
- [11] Medvedev S, McQueen T M, Troyan I A, Palasyuk T, Eremets M I, Cava R J, Naghavi S, Casper F, Ksenofontov V, Wortmann G and Felser C 2009 Nature Mater. 8 630
- [12] Garbarino G, Sow A, Lejay P, Sulpice A, Toulemonde P, Mezouar M and Nunez-Regueiro M 2009 Europhys. Lett. 86 27001
- [13] Braithwaite D, Salce B, Lapertot G, Bourdarot F, Marin C, Aoki D and Hanfland M 2009 J. Phys.: Condens. Matter 21 232202
- [14] Guo J-G, Jin S-F, Wang G, Wang S-C, Zhu K-X, Zhou T-T, He M and Chen X-L 2010 Phys. Rev. B 82 180520
- [15] Krzton-Maziopa A, Shermadini Z, Pomjakushina E, Pomjakushin V, Bendele M, Amato A, Khasanov R, Luetkens H and Conder K 2011 J. Phys.: Condens. Matter 23 052203
- [16] Li C-H, Shen B, Han F, Zhu X and Wen H-H 2011 Phys. Rev. B 83 184521
- [17] Guo J, Chen X, Zhang C, Guo J, Chen X, Wu Q, Gu D, Gao P, Dai X, Yang L, Mao H-K, Sun L and Zhao Z 2011 Pressure-driven quantum criticality in an iron-selenide superconductor Preprint cond-mat.supr-con/1101.0092
- [18] Seyfarth G, Jaccard D, Pedrazzini P, Krzton-Maziopa A, Pomjakushina E, Conder K and Shermadini Z 2011 Solid State Commun. 151 747
- [19] Horigane K, Takeshita N, Lee Ch-H, Hiraka H and Yamada K 2009 J. Phys. Soc. Jpn. 78 063705
- [20] Tsoi G, Stemshorn A K, Vohra Y K, Wu P M, Hsu F C, Huang Y L, Wu M K, Yeh K W and Weir S T 2009 J. Phys.: Condens. Matter 21 232201
- [21] Huang Ch-L, Chou Ch-Ch, Tseng K-F, Huang Y-L, Hsu F-Ch, Yeh K-W, Wu M-K and Yang H-D 2009 J. Phys. Soc. Jpn. 78 084710
- [22] Stemshorn A K, Vohra Y K, Wu P M, Hsu F C, Huang Y L, Wu M K and Yeh K W 2009 High Pressure Res. 29 267
- [23] Gawryluk D J, Fink-Finowicki J, Wisniewski A, Puzniak R, Domukhovski V, Diduszko R, Kozlowski M and Berkowski M 2011 Supercond. Sci. Technol. 24 065011
- [24] Murata K, Yoshino H, Yadav H O, Honda Y and Shirakava N 1997 Rev. Sci. Instrum. 68 2490
- [25] Kamarád J, Machátová A and Arnold Z 2004 Rev. Sci. Instrum. 75 5022
- [26] Sales B C, Sefat A S, McGuire M A, Jin R Y, Mandrus D and Mozharivskyj Y 2009 Phys. Rev. B 79 094521
- [27] Lumsden M D, Christianson A D, Goremychkin E A, Nagler S E, Mook H A, Stone M B, Abernathy D L, Guidi T, MacDougall G J, de la Cruz C, Sefat A S, McGuire M A, Sales B C and Mandrus D 2010 Nature Phys. 6 182
- [28] Verwey E J W 1939 Nature 144 327
- [29] Bendele M, Weyeneth S, Puzniak R, Maisuradze A, Pomjakushina E, Conder K, Pomjakushin V, Luetkens H, Katrych S, Wisniewski A, Khasanov R and Keller H 2010 Phys. Rev. B 81 224520
- [30] Szymanski K, Olszewski W, Dobrzynski L, Satula D, Gawryluk D J, Berkowski M, Puzniak R and Wisniewski A 2011 Supercond. Sci. Techn. 24 105010
- [31] Werthamer N R, Helfand E and Hohenberg P C 1966 Phys. Rev. 147 295
- [32] Tinkham M 1975 Introduction to Superconductivity (Krieger, Malabar, Florida)
- [33] Naito M, Matsuda A, Kitazawa K, Kambe S, Tanaka I and Kojima H 1990 Phys. Rev. B 41 4823
- [34] Clem J R 1974 Proceeding of the 13th Conference on Low Temperature Physics (LT 13) vol. 1 ed K D Timmerhaus, W J O’Sullivan and E F Hammel (New York: Plenum) p 102
- [35] Burlachkov L 1993 Phys. Rev. B 47 8056
- [36] Burlachkov L, Geshkenbein V B, Koshelev A E, Larkin A I and Vinokur V M 1994 Phys. Rev. B 50 16770
- [37] Uemura Y J, Luke G M, Sternlieb B J, Brewer J H, Carolan J F, Hardy W N, Kadono R, Kempton J R, Kiefl R F, Kreitzman S R, Mulhern P, Riseman T M, Williams D L, Yang B X, Uchida S, Takagi H, Gopalakrishnan J, Sleight A W, Subramanian M A, Chien C L, Cieplak M Z, Xiao G, Lee V Y, Statt B W, Stronach C E, Kossler W J and Yu X H 1989 Phys. Rev. Lett. 62 2317
- [38] Luetkens H, Klauss H-H, Kraken M, Litterst F J, Dellmann T, Klingeler R, Hess C, Khasanov R, Amato A, Baines C, Kosmala M, Schumann O J, Braden M, Hamann-Borrero J, Leps N, Kondrat A, Behr G, Werner J and Büchner B 2009 Nature Mater. 8 305
- [39] Drew A J, Niedermayer Ch, Baker P J, Pratt F L, Blundell S J, Lancaster T, Liu R H, Wu G, Chen X H, Watanabe I, Malik V K, Dubroka A, Rössle M, Kim K W, Baines C and Bernhard C 2009 Nature Mater. 8 310
- [40] Khasanov R, Conder K, Pomjakushina E, Amato A, Baines C, Bukowski Z, Karpinski J, Katrych S, Klauss H-H, Luetkens H, Shengelaya A and Zhigadlo N D 2008 Phys. Rev. B 78 220510
- [41] Kim H, Martin C, Gordon R T, Tanatar M A, Hu J, Qian B, Mao Z Q, Hu R, Petrovic C, Salovich N, Giannetta R and Prozorov R 2010 Phys. Rev. B 81 180503(R)
- [42] Luetkens H, Klauss H-H, Khasanov R, Amato A, Klingeler R, Hellmann I, Leps N, Kondrat A, Hess C, Köhler A, Behr G, Werner J and Büchner B 2008 Phys. Rev. Lett. 101 097009
- [43] Takeshita S and Kadono R 2009 New J. Phys. 11 035006
- [44] Carlo J P, Uemura Y J, Goko T, MacDougall G J, Rodriguez J A, Yu W, Luke G M, Dai P, Shannon N, Miyasaka S, Suzuki S, Tajima S, Chen G F, Hu W Z, Luo J L and Wang N L 2009 Phys. Rev. Lett. 102 087001
- [45] Khasanov R, Luetkens H, Amato A, Klauss H-H, Ren Z-A, Yang J, Lu W and Zhao Z-X 2008 Phys. Rev. B 78 092506
- [46] Khasanov R, Bendele M, Amato A, Conder K, Keller H, Klauss H-H, Luetkens H and Pomjakushina E 2010 Phys. Rev. Lett. 104 087004
- [47] Pratt F L, Baker P J, Blundell S J, Lancaster T, Lewtas H J, Adamson P, Pitcher M J, Parker D R and Clarke S J 2009 Phys. Rev. B 79 052508
- [48] Khasanov R, Evtushinsky D V, Amato A, Klauss H-H, Luetkens H, Niedermayer Ch, Büchner B, Sun G L, Lin C T, Park J T, Inosov D S and Hinkov V 2009 Phys. Rev. Lett. 102 187005
- [49] Bendele M, Amato A, Conder K, Elender M, Keller H, Klauss H-H, Luetkens H, Pomjakushina E, Raselli A and Khasanov R 2010 Phys. Rev. Lett. 104 087003
- [50] Bean C P 1962 Phys. Rev. Lett. 8 250
- [51] Bean C P 1964 Rev. Mod. Phys. 36 31
- [52] Karpinski J, Zhigadlo N D, Katrych S, Bukowski Z, Moll P, Weyeneth S, Keller H, Puzniak R, Tortello M, Daghero D, Gonnelli R, Maggio-Aprile I, Fasano Y, Fischer O, Rogacki K and Batlogg B 2009 Physica C 469 370