Zooming in on Supernova 1987A at sub-mm wavelengths
Abstract
Context. Supernova 1987A (SN 1987A) in the neighbouring Large Magellanic Cloud offers a superb opportunity to follow the evolution of a supernova and its remnant in unprecedented detail. Recently, far-infrared (far-IR) and sub-mm emission was detected from the direction of SN 1987A, which was interpreted as due to the emission from dust, possibly freshly synthesized in the SN ejecta.
Aims. To better constrain the location and hence origin of the far-IR and sub-mm emission in SN 1987A, we have attempted to resolve the object in that part of the electro-magnetic spectrum.
Methods. We observed SN 1987A during July–September 2011 with the Atacama Pathfinder EXperiment (APEX), at a wavelength of 350 m with the Submillimetre APEX Bolometer CAmera (SABOCA) and at 870 m with the Large APEX BOlometer CAmera (LABOCA). The 350-m image has superior angular resolution () over that of the Herschel Space Observatory 350-m image (). The 870-m observation (at resolution) is a repetition of a similar observation made in 2007.
Results. In both images, at 350 and 870 m, emission is detected from SN 1987A, and the source is unresolved. The flux densities in the new (2011) measurements are consistent with those measured before with Herschel at 350 m (in 2010) and with APEX at 870 m (in 2007). A higher dust temperature ( K) and lower dust mass might be possible than what was previously thought.
Conclusions. The new measurements, at the highest angular resolution achieved so far at far-IR and sub-mm wavelengths, strengthen the constraints on the location of the emission, which is thought to be close to the site of SN 1987A and its circumstellar ring structures. These measurements set the stage for upcoming observations at even higher angular resolution with the Atacama Large Millimeter Array (ALMA).
Key Words.:
circumstellar matter – supernovae: SN 1987A – ISM: supernova remnants – Magellanic Clouds – Submillimeter: ISM1 Introduction
SN 1987A offers us the unique opportunity to follow the early evolution of a supernova (SN) and its transition into a supernova remnant (SNR) in exquisite detail. Located in the Large Magellanic Cloud (LMC) at a relatively accurately known distance of 50 kpc, it is seen in a direction that suffers from little interstellar extinction. While SN 1987A was classified as type II (Arnett et al. 1989), it showed distinct properties with respect to typical plateau events, most probably linked to its unexpected progenitor star: the blue supergiant Sk 202.
SN 1987A’s emerging remnant is being shaped by the impact of the initial blastwave and the expanding hot plasma upon an equatorial ring of matter, in diameter, deposited probably by the supernova progenitor star when it was still a red supergiant (Bouchet al. 2006; Dwek et al. 2010; Larsson et al. 2011). The ejecta themselves are due to reach the ring in the near future. The increasing strength of the shock is also reflected in an exponential increase in radio brightness (Zanardo et al. 2010).
Small amounts ( M⊙) of warm dust formed in about two years since the explosion (Suntzeff & Bouchet 1990; Bouchet, Danziger & Lucy 1991). This offers a great opportunity to study fresh supernova dust, because in older remnants it becomes increasingly difficult to distinguish between dust formed in the ejecta or dust swept-up from the surroundings (e.g., Rho et al. 2008, 2009; Sandstrom et al. 2009; van Loon et al. 2010; Otsuka et al. 2010; Barlow et al. 2010). Early detection also allows one to monitor the evolution of the dust, which might be altered or even destroyed before entering the interstellar medium. Claims of observaions of dust formation have been made in more distant SNe (e.g., Elmhamdi et al. 2003; Fox et al. 2009; Sakon et al. 2009; Inserra et al. 2011), though often SNe are seen to destroy pre-existing dust (e.g., Botticella et al. 2009; Wesson et al. 2010; Andrews et al. 2011). SN 1987A offers prospects of locating the cold dust directly, by spatially resolving its emission.
Far-IR emission was detected from SN 1987A with the Herschel Space Observatory by Matsuura et al. (2011), who suggested a colder dust component (17–23 K) than that in the equatorial ring ( K). They placed the cold dust within the ejecta, to reconcile the large mass of 0.5 M⊙ they derive. This would imply enormous growth since the earlier detections. However, the Herschel images do not resolve the equatorial ring from the ejecta, and still allow for the dust to reside outside the ring – be it of progenitor origin or interstellar dust echoing the supernova (Meikle et al. 2011). We also remind the reader that chance superpositions do occur (e.g., van Loon & Oliveira 2003).
SN 1987A was observed at sub-mm wavelengths (870 m) with the Large APEX BOlometer CAmera (LABOCA; Siringo et al. 2009) on the Atacama Pathfinder EXperiment (APEX) for the first time in 2007 (Lakićević et al. 2011). We observed this object again in 2011 with LABOCA at 870 m, and at 350 m with SABOCA (Submillimetre APEX Bolometer CAmera; Siringo et al. 2010), at three times higher angular resolution than the Herschel observations at that wavelength. We here present the results. These new observations place important constraints on the maximum spatial extent of the dust emission, and they provide an important zero-spacing value for planned observations with the Atacama Large Millimeter Array (ALMA).
2 Observations
Observations of SN 1987A (programme ESO 088.D-0252, P.I. Maša Lakićević) were made with APEX, a 12-m single-dish sub-mm telescope at the ALMA site at an altitude of 5100 m. We used the bolometer array cameras LABOCA and SABOCA, in July and September 2011 under excellent conditions – the water vapour column was mm for most of the SABOCA observations and mm for the LABOCA observations.
2.1 LABOCA observations at 870 m
SN 1987A was observed with LABOCA at a wavelength of 870 m (345 GHz) within a 60-GHz wide band (). The on-source integration time was 5 h (6.1 h including overheads). The field was imaged in spiral raster map mode. The beam has a full-width at half-maximum (FWHM) of .
The data were reduced with the bolometer array analysis (BoA) software. The data were first corrected for atmospheric attenuation determined through “skydips”, applying a correction derived from observations of planets and secondary flux calibrators taken at similar elevation as the target. Then several rounds of correlated flux variation (“skynoise”) removal, despiking, removal of noisy bolometers, and baseline subtractions were applied, before maps of the individual scans were created. These were then combined. The resulting map was then smoothed, and values below zero set to zero, and used as a source model for the next iteration. The model was subtracted from the data before skynoise, spike and baseline removal and added back before creating the next map. In total 35 iterations were performed, with increasing skynoise, spike and baseline removal settings while reducing the smoothing. This procedure allows one to recover extended structures, reduces the negative “bowls” seen frequently in bolometer on-the-fly maps, and reduces the noise, while yielding a final map at the full spatial resolution of the instrument.
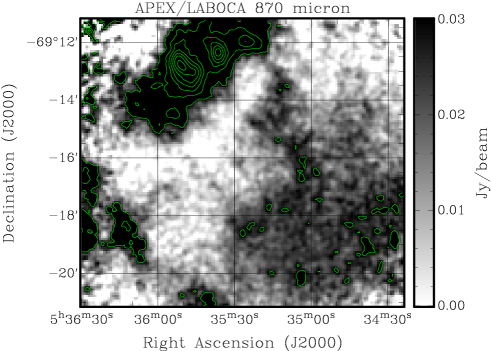
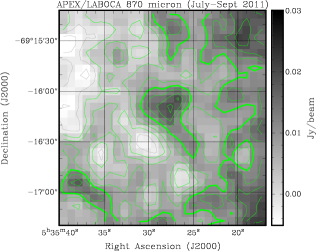
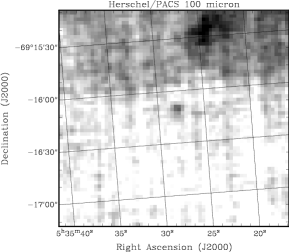
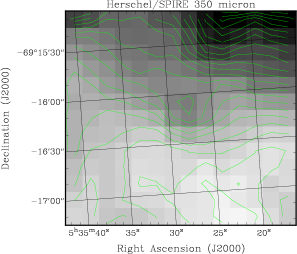
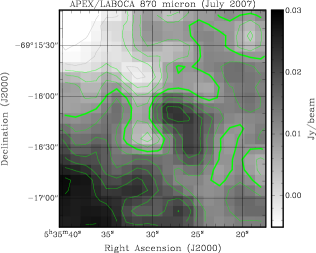
The image was smoothed with half a beam; the resulting beam size was . It is presented in full in Fig. 1, and is zoomed-in on the position of SN 1987A in Fig. 2 (top right). The source appears to sit on filamentary emission extending towards the south–west, similar to that reported by Lakićević et al. (2011).
The flux density of the central point source is mJy, where the uncertainty combines the r.m.s. noise level of 4 mJy (8 mJy in the unsmoothed map) and LABOCA’s absolute calibration uncertainty of %. This brightness is consistent within the errors with the result from Lakićević et al. (2011), viz. mJy, which was obtained from measurements in 2007.
2.2 SABOCA observations at 350 m
SABOCA is a continuum receiver that consists of 39 bolometers operating at a wavelength of 350 m (857 GHz) within a 120-GHz wide band (). The on-source integration time was 15.6 h (22.7 h including overheads). The field was imaged in spiral raster map mode. The beam has a FWHM of .
The data reduction was performed with two different packages – BoA and crush Comprehensive Reduction Utility for SHARC-2; Kovács 2008 – which use different algorithms.
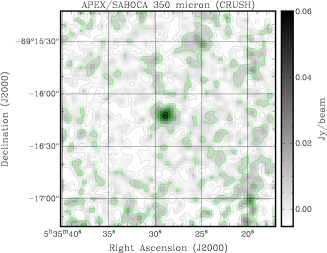
In crush, we used the faint source reduction option, with a source size filtering of , and ran 20 iterations. The image, smoothed with half a beam, is presented in Fig. 2 (top left). Since the pointing in September was slightly offset from that in July, the data from July and September were reduced separately and then the September data were shifted to match the July data and averaged. The resulting beam has an effective FWHM of . The flux density of the unresolved source at the position of SN 1987A on the combined image is mJy, where the uncertainty combines the r.m.s. noise level of 6 mJy and SABOCA’s absolute calibration uncertainty of %.
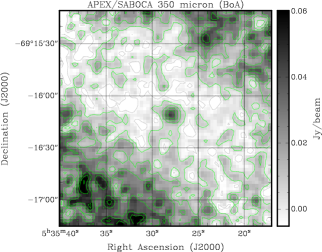
The data reduction strategy within BoA corresponds to the one used for LABOCA, except that the atmospheric opacities were determined from measurements of the amount of precipitable water vapour (PWV) done in parallel to the observations, using an atmospheric model (ATM). Because the calibration measurements were made at the same time as the observations and at the same azimuth and elevation, they yield a more accurate opacity correction. The image obtained using BoA, smoothed with half a beam, is presented in Fig. 2 (top, centre). Here, the July and September data were aligned and placed at the centre of the image before the reduction. The measured flux density of SN 1987A is now mJy.
The maps reduced with BoA and crush differ slightly in the flux level, probably due to the different calibration strategies (crush uses opacities derived from skydips). The flux densities are consistent within the calibration uncertainties of –30%. The extended emission in the BoA reduced image is not evident in the crush reduced map, because here the algorithm is optimised to remove correlated signal variations from the data time streams, which includes extended emission structures.
The images from the two reduction techniques both confirm that the object at the position of SN 1987A is a point source. The detection is of much higher significance than the uncertainty in the flux density suggests, because the latter includes systematic uncertainties mainly in the flux calibration. For the flux density we adopt the average from the two reductions, i.e. mJy, where the uncertainty is the average from the individual uncertainties as they are strongly correlated. This is remarkably close to the Herschel measurement, viz. mJy, in 2010.
3 Discussion
Models predict –1 M⊙ of dust to form in the ejecta of core-collapse SNe (Nozawa et al. 2003). Warm dust ( K) was identified with the equatorial ring around SN 1987A by direct imaging (Bouchet et al. 2006). Dust formed within the ejecta might be colder. The cooling rate of a spherical grain of diameter and temperature is its luminosity, , resulting in a heat loss where is the mass of the grain and its specific heat. Integrating, noting that the initial temperature rapidly vanishes, leads to
| (1) |
where is the grain’s density. For g cm-3, J K-1 g-1 and m one finds that the grain cools to the temperature of the cosmic microwave background (3 K) within a matter of hours. First, collisions with the gas prevent this from happening, but as the ejecta expand the gas cools and the gas and grains detach (when the density falls below cm-3). The interstellar radiation field (ISRF) keeps the dust at a temperature K. This led Matsuura et al. (2011) to suggest that the -K dust attributed to the far-IR emission from SN 1987A formed within the SN ejecta.
3.1 Spectral energy distribution (SED)
In Fig. 3 we present the SED of SN 1987A. Lakićević et al. (2011) described the far-IR/sub-mm emission using a modified black body with a dust emission coefficient ; they found and K, similar to the values reported in Matsuura et al. (2011) and hence a similar dust mass ( M⊙) depending on . Synchrotron emission contributes and mJy at 0.35 and 0.87 mm, respectively, as estimated from extrapolation of a powerlaw with slope (Fig. 3). Limits on the contribution from free–free emission at those wavelengths are rather more stringent (Lakićević et al. 2011).
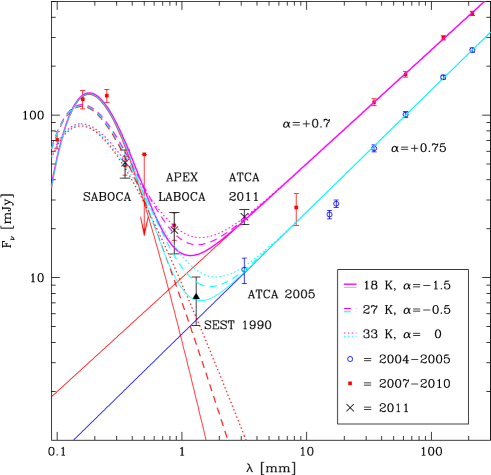
The new measurements at 0.35 and 0.87 mm show no change from the previous measurements at those wavelengths with Herschel (Matsuura et al. 2011; data from August 2010) and APEX (Lakićević et al. 2011; data from July 2007), respectively. Hence there is no evidence for an evolution of the dust on those timescales, be it the amount, temperature, or grain sizes.
However, values of closer to zero may not be unexpected at sub-mm wavelengths (Paradis et al. 2011). Adopting , and raising the dust temperature to 33 K results in a better fit to the 0.1, 0.35- and 0.87-mm measurements (Fig. 3), leaving only the Herschel 160- and 250-m measurements discrepant. A compromise is obtained for , at 27 K, which is at the extreme end of the models in Fig. 7 of Paradis et al. (2011); this reconciles the 160-m datum (Fig. 3). The Herschel data could be affected by line emission close to SN 1987A: the 160-m band includes the [C ii] 158-m and [N ii] 205-m lines, while the 250-m band includes three highly excited 12CO lines with another 12CO line and the [N ii] line at the edges of the band. In warm gas, these 12CO transitions can be brighter than those at longer wavelengths, and the 350- and 500-m bands each only include two 12CO lines, which additionally reduces the contribution from line emission at m. The fit for (and, though to a lesser degree, the fit for ) agrees with the measurement at 1.3 mm made in 1990 (Biermann et al. 1992), hinting that the cold dust has been unaltered since day 1290 and that it might well have already been in place prior to the explosion. Following Evans et al. (2003) we obtain
| (2) |
where cannot exceed the ratio of grain surface area and grain mass. Hence, a spherical black body with m and g cm-3 would yield cm2 g-1. This would reduce the mass estimate to M⊙ and within the realms of the formation through mass loss from the SN progenitor (assuming several M⊙ were lost and a gas-to-dust ratio of a few hundred). For or at m we would have found or 0.24 M⊙, respectively. Mennella et al. (1998) find – cm2 g-1 at far-IR–mm wavelengths, depending on grain composition, but smaller grains, needles, or fluffy grains all increase the surface-to-mass ratio and hence . Indeed, for SNe of type IIb – probably a good match to SN 1987A – Nozawa et al. (2010) predict grains of only 0.001–0.003 m size, and Wickramasinghe & Wickramasinghe (1993) explained the mm radiation from SN 1987A in 1990 by iron whiskers with cm2 g-1 at far-IR–mm wavelengths.
3.2 Where is the dust?
Our APEX 350-m image of SN 1987A has a beam size (area) a tenth of that of the Herschel 350-m image (Matsuura et al. 2011). The emission from SN 1987A remains unresolved, i.e. it is located well within (corresponding to 2 pc at the distance of the LMC of 50 kpc) from the explosion site. Even if it were due to a light echo (Meikle et al. 2011) this suggests the echoing dust is probably situated pc from the explosion site and was most likely produced by the progenitor of SN 1987A. Little room now remains for cold dust to surround the equatorial ring, i.e. in the dense wind material from the progenitor; the dust is more likely to reside within the ring or inside of it (e.g., in the ejecta).
The grains might be heated to 33 K by the decay of 44Ti within the ejecta (Jerkstrand, Fransson & Kozma 2011). Small grains would naturally be hotter within the ISRF, and also more prone to stochastic heating, which could imply that not all dust mass is accounted for (the addition of a much colder component could mimic a flatter long-wavelength tail). Small grains might result from sputtering by the hot gas and X-rays impinging upon the ring or even the ejecta (Larsson et al. 2011). While Dwek et al. (2010) did find an additional population of small grains in the equatorial ring, these were much hotter ( K). Hence the cold dust might be most easily explained as due to condensation within the ejecta, but there are scenarios possible that reduce the inferred mass to M⊙, leaving other options open.
4 Conclusions
We presented new images of SN 1987A at wavelengths of 350 and 870 m, obtained with the APEX telescope, showing very clear detections of largely unresolved emission. The image at 350 m improves the constraints on the location of the emission by an order of magnitude in area over that obtained from Herschel observations, to well within from the explosion site. The far-IR and sub-mm SED is consistent with emission from cold dust, but the temperature may be as high as K if the emission coefficient is wavelength-independent – though this would require a contribution from line emission to the flux within the 160- and 250-m Herschel bands. Smaller, non-spherical, or fluffy grains would reduce the inferred dust mass, possibly enough to become consistent with pre-SN production.
Acknowledgements.
We kindly thank Jeonghee Rho for her constructive referee reports. This publication is based on data acquired with the Atacama Pathfinder Experiment (APEX). APEX is a collaboration between the Max Planck Institut für Radioastronomie, the European Southern Observatory, and the Onsala Space Observatory.References
- (1) Andrews J.E., et al. 2011, AJ, 142, 45
- (2) Arnett W.D., Bahcall J.N., Kirschner R.P., Woosley S.E. 1989, ARA&A, 27, 629
- (3) Barlow M.J., et al. 2010, A&A, 518, L138
- (4) Biermann P.L., Chini R., Haslam C.G.T., Kreysa E., Lemke R., Sievers A. 1992, A&A, 255, L5
- (5) Botticella M.T., et al. 2009, MNRAS, 398, 1041
- (6) Bouchet P., Danziger I.J., Lucy L.B. 1991, AJ, 102, 1135
- (7) Bouchet P., et al. 2006, ApJ, 650, 212
- (8) Dwek E., et al. 2010, ApJ, 722, 425
- (9) Elmhamdi A., et al. 2003, MNRAS, 338, 939
- (10) Evans A., Stickel M., van Loon J.Th., Eyres S.P.S., Hopwood M.E.L., Penny A.J. 2003, A&A, 408, L9
- (11) Fox O., et al. 2009, ApJ, 691, 650
- (12) Inserra C., et al. 2011, MNRAS, 417, 261
- (13) Jerkstrand A., Fransson C., Kozma C. 2011, A&A, 530A, 45
- (14) Kovács A. 2008, in: Millimeter and Submillimeter Detectors and Instrumentation for Astronomy IV, eds. W.D. Duncan, W.S. Holland, S. Withington & J. Zmuidzinas, SPIE, 7020, 45
- (15) Lakićević M., van Loon J.Th., Patat F., Staveley-Smith L., Zanardo G. 2011, A&A, 532, L8
- (16) Lakićević M., Zanardo G., van Loon J.Th., Staveley-Smith L., Patat F. 2012, A&A, submitted
- (17) Larsson J., et al. 2011, Nature, 474, 484
- (18) Matsuura M., et al. 2011, Science, 333, 1258
- (19) Meikle W.P.S., et al. 2011, ApJ, 732, 109
- (20) Mennella V., Brucato J.R., Colangeli L., Palumbo P., Rotundi A., Bussoletti E. 1998, ApJ, 496, 1058
- (21) Nozawa T., Kozasa T., Umeda H., Maeda K., Nomoto K. 2003, ApJ, 598, 785
- (22) Nozawa T., Kozasa T., Tominaga N., Maeda K., Umeda H., Nomoto K., Krause O. 2010, ApJ, 713, 356
- (23) Otsuka M., et al. 2010, A&A, 518, L139
- (24) Paradis D., Bernard J.-P., Mény C., Gromov V. 2011, A&A, 534A, 118
- (25) Rho J., Kozasa T., Reach W.T., Smith J.D., Rudnick L., DeLaney T., Ennis J.A., Gomez H., Tappe A. 2008, ApJ, 673, 271
- (26) Rho J., et al. 2009, in: Cosmic Dust – Near and Far, eds. Th. Henning, E. Grün & J. Steinacker, ASPC, 414, 22
- (27) Sakon I., et al. 2009, ApJ, 692, 546
- (28) Sandstrom K.M., Bolatto A.D., Stanimirović S., van Loon J.Th., Smith J.D.T. 2009, ApJ, 696, 2138
- (29) Siringo G., et al. 2009, A&A, 497, 945
- (30) Siringo G., et al. 2010, Msngr, 139, 20
- (31) Suntzeff N.B., Bouchet P. 1990, AJ, 99, 650
- (32) van Loon J.T., Oliveira J.M. 2003, A&A, 405, L33
- (33) van Loon J.Th., et al. 2010, AJ, 139, 68
- (34) Wesson R., et al. 2010, MNRAS, 403, 474
- (35) Wickramasinghe N.C., Wickramasinghe A.N. 1993, Ap&SS, 200, 145
- (36) Zanardo G., et al. 2010, ApJ, 710, 1515