The Birth of an Ultra-Luminous X-ray Source in M83111 Based on observations made with NASA’s Chandra X-ray Observatory, the NASA/ESA Hubble Space Telescope, Swift , the 6.5 meter Magellan Telescopes located at Las Campanas Observatory, and the Gemini Observatory. NASA’s Chandra Observatory is operated by Smithsonian Astrophysical Observatory under contract # NAS83060 and the data were obtained through program GO1-12115. The HST observations were obtained at the Space Telescope Science Institute, which is operated by the Association of Universities for Research in Astronomy, Inc. (AURA), under NASA contract NAS 5-26555. The new HST observations were obtained through programs # GO-12513 and GO-12683. Data in the HST archive from program GO-11360 was also used. The ground-based observations were obtained through NOAO which is operated by Association of Universities for Research in Astronomy, Inc. for the National Science Foundation.
Abstract
A previously undetected ( erg s-1) source in the strongly star-forming galaxy M83 entered an ultraluminous state between August 2009 and December 2010. It was first seen with Chandra on 23 December 2010 at erg s-1, and has remained ultraluminous through our most recent observations in December 2011, with typical flux variation of a factor of two. The spectrum is well fitted by a combination of absorbed power-law and disk black-body models. While the relative contributions of the models varies with time, we have seen no evidence for a canonical state transition. The luminosity and spectral properties are consistent with accretion powered by a black hole with –. In July 2011 we found a luminous, blue optical counterpart which had not been seen in deep HST observations obtained in August 2009. These optical observations suggest that the donor star is a low-mass star undergoing Roche-lobe overflow, and that the blue optical emission seen during the outburst is coming from an irradiated accretion disk. This source shows that ultraluminous X-ray sources (ULXs) with low-mass companions are an important component of the ULX population in star-forming galaxies, and provides further evidence that the blue optical counterparts of some ULXs need not indicate a young, high-mass companion, but rather that they may indicate X-ray reprocessing.
1 Introduction
Point-like X-ray sources with luminosities exceeding the Eddington limit of normal stellar-mass black holes (, assuming isotropic emission) are commonly known as Ultraluminous X-ray sources (ULXs). The most luminous class of non-nuclear sources in galaxies, they are widely believed to result from some extreme form of accreting X-ray binary containing a black hole. However, the nature of both the black holes that power the ULXs and the companion stars that fuel them remain enigmatic. Briefly, the principal competing models for the primaries are: (a) intermediate (between normal stars and AGN) mass black holes () perhaps formed in the collapsed core of massive star clusters—many of which are present in M83 (Colbert & Mushotzky, 1999); (b) “normal” stellar-mass black holes () that are accreting well above their Eddington limit (Begelman, 2002) and/or that have beamed emission (e.g., King et al., 2001; Begelman et al., 2006); and (c) “heavy” stellar black holes (–)—perhaps formed from direct collapse of metal-poor, massive stars (Belczynski et al., 2010; Zampieri & Roberts, 2009; Pakull & Mirioni, 2002)—that are accreting near or just above their Eddington limit.
A number of lines of evidence suggest that most ULXs are associated with young, high-mass stellar populations—the extreme of the high-mass X-ray binary (HMXB) population. Statistically, ULXs are found mostly in star-forming spirals or irregular galaxies (Irwin et al., 2004; Swartz et al., 2004) and the number of ULXs per galaxy increases with the star-formation rate (Colbert et al., 2004; Liu et al., 2006). The cumulative luminosity function for ULXs in star-forming galaxies is consistent with the extrapolation of that for HMXBs (Walton et al., 2011; Swartz et al., 2011). Within individual galaxies, 75% of ULXs are found in thin spiral arms and dust lanes, and tend to have high absorbing column densities (Liu et al., 2006). Theoretical considerations suggest that high-mass donors can maintain a ULX in a persistent high state for up to 10 Myr (Rappaport et al., 2005).
Yet there is mounting evidence for a second population of ULXs, a population that represents an extreme form of low-mass X-ray binaries (LMXBs). The cumulative luminosity function of ULXs in elliptical galaxies is consistent with the extrapolation of the luminosity function for LMXBs (Swartz et al., 2004; Walton et al., 2011), suggesting that those ULXs are extreme LMXBs. In spiral galaxies, the number of ULXs is not purely a function of the star formation rate, but is also a function of the total stellar mass, suggesting that 15% to 25% of the total number of ULXs are associated with the older stellar population (Colbert et al., 2004; Liu et al., 2006; Winter et al., 2006; Mushotzky, 2006).
Point-like, blue optical counterparts have been identified for a number of ULXs (e.g., Ptak et al., 2006; Grisé et al., 2008), thus reinforcing the link with a young, high-mass stellar population. However, some ULX counterparts that were initially identified as massive, early-type stars on the basis of their blue colors (e.g. Kuntz et al., 2005) are now thought to be low-mass stellar donors and the blue colors due to optical emission from the accretion disk and/or reprocessed radiation from the X-ray source (e.g. Copperwheat et al., 2007). Indeed, Tao et al. (2011) have argued that the optical emission from the majority of ULX counterparts is dominated by X-ray reprocessing. However, there have been no unequivocal identifications of low-mass donors in such systems, because we have never had a chance to observe them in quiescence.
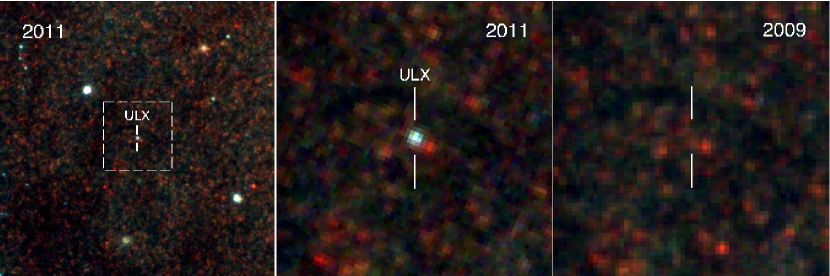
In this paper we report the discovery of a ULX that recently erupted in the nearby ( Mpc, Saha et al., 2006) grand-design spiral galaxy M83 (NGC 5236), and that we can confirm to be powered by a low-mass companion. The first exposures of a large Chandra project to study M83, taken on 23 and 25 December 2010, revealed an unexpected gift: a ULX—a non-nuclear source with a flux comparable to the total circumnuclear flux—that had not appeared in previous Chandra images from 2000–01, nor in any other prior X-ray image of M83. The new source appeared east of the nucleus, well away from the spiral arms and from the many regions with active star formation. Since its discovery, we have monitored the source for a year with Swift, and with Chandra in our ongoing program observations. We have also obtained optical images of the field containing the ULX from the Gemini South telescope and from the Hubble Space Telescope (HST), and we find that a new unresolved source, not seen in previous HST observations of the same field, has appeared coincident with the ULX.
The remainder of this paper is organized as follows: In §2 we present the new Chandra and Swift data, along with a brief survey of archival X-ray data where the ULX was absent, and in §3 we give the results of spectroscopic and timing analyses. In §4 we describe the optical observations and results. In §5 we argue that the M83 ULX is powered by accretion from a low-mass companion that has recently expanded to overflow its Roche lobe, and that the present bright optical emission results from the reprocessing of X-rays in the accretion disk. We go on to discuss the probable geometry and black hole mass in some detail, and close in §6 with a brief summary.
2 X-ray Observations
The object was discovered using Chandra, whose spectacular angular resolution allowed the quick and definitive determination that no such source appeared in previous X-ray images. The source was discovered when its , a ULX by most definitions of that class. The Chandra spectrum is unequivocally that of a power-law-like source, but there are many classes of sources with similar spectra, so the nature of the source was not immediately clear. We turned to Swift to follow the short-term evolution of the source, and to archival data from other missions to determine what might have been there in the past.
2.1 Chandra Discovery
The recent Chandra data were obtained as part of a detailed study of M83 (Program 12620596; Long P.I.). The data, totalling 729 ks, were obtained in ten observations, each longer than 50 ks. The observations are clustered in December 2010, March 2011, and August 2011, with a final observation in December 2011 (See Table 1.) We used the back-illuminated S3 chip for maximum soft response, since most of the M83 disk fits within its field. We carried out the observations in the “very faint” mode for optimum background subtraction. We filtered and analysed the data with standard imaging and spectroscopic tools, such as dmcopy, dmextract and specextract, in the CIAO Version 4.3 (Fruscione et al., 2006) data analysis system.
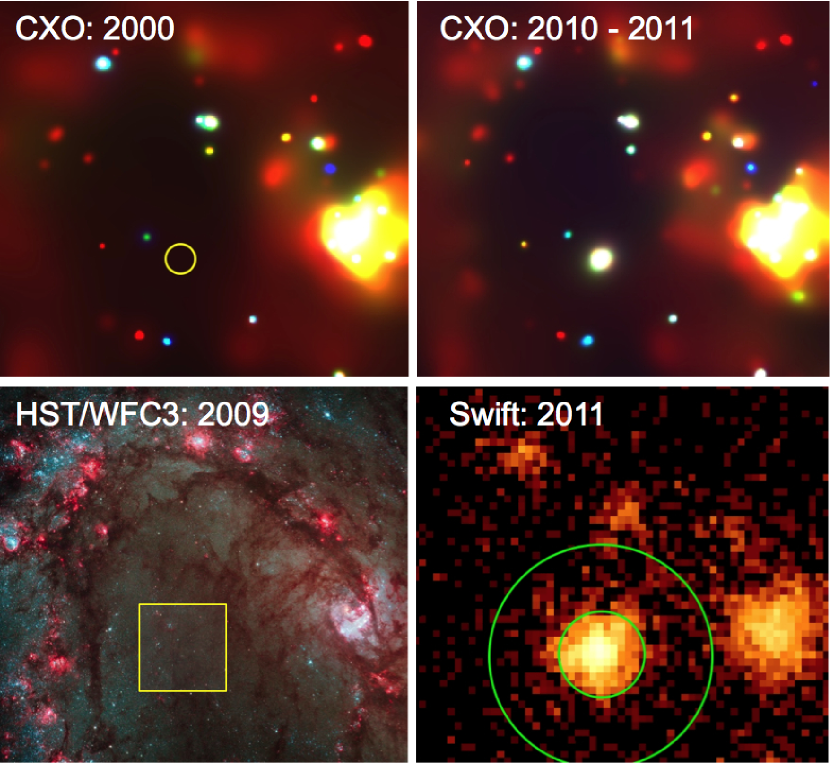
As shown in the upper right panel of Figure 1, the ULX appears east of the nucleus of M83. A count-weighted mean of the centroid positions over the first nine observations gives a position
(90% confidence level). The root-mean-square scatter of the source positions derived from each Chandra observation is . We also determined a source position using only the five observations during March and April 2011, in which the aimpoint was closest (″) to the ULX, when the point spread function (PSF) would be most narrow and symmetric, with a 90% encircled energy radius ; we obtained the same result as from the total average, with a root-mean-square scatter . We confirmed the accuracy of the Chandra position further by using two sources in the S3 chip with both X-ray and radio detections: SN1957D (located north-east of the nucleus) and a background radio galaxy ( north-west of the nucleus). The mean X-ray positions of those two sources are within of the radio positions, measured from our Australia Telescope Compact Array observations at 5 Ghz; the radio positions have themselves an uncertainty of . We conclude that the mean Chandra coordinates can be offset by no more than from the true position.
The two earlier observations of M83, taken with the Chandra ACIS-S in 2000 and 2001, do not show the presence of the ULX (see the upper left panel of Figure 1). Applying the Bayesian method of Kraft et al. (1991) to the number of detected counts in the source and background regions, we estimate the net count rate in 2000–2001 to be ct s-1 at the 90% confidence level. This corresponds to an emitted luminosity erg s-1 for any of the spectral parameter values found in the 2010–2011 series of observations. The newly erupted source had brightened by at least a factor of 3000.
2.2 Swift Monitoring
After the discovery of the ULX in the Chandra data, we monitored it with several series of short ( ks) observations with the Swift X-ray Telescope (XRT), to follow its short-term evolution.
The ULX is somewhat over outside the extended emission from the M83 bulge, in a region free of bright, strongly structured diffuse emission, but in a region where the diffuse emission is still significant, as can be seen in the lower right panel of Figure 1. Thus, we had to choose the background region for photometry from the Swift XRT, which has a pixel size of , carefully. We set the source region to have a radius of , which contains 70% of the encircled energy at 1 keV, and the background region to be an annulus stretching from to , avoiding several nearby regions of enhanced diffuse emission. The background region contains the extended wings of the ULX, comprising some 14% of the total source flux222 The XRT instrument handbook provides formulae for calculating the encircled energy at keV and keV. We used these formula to calculate the encircled energy fractions for – keV (using the values for keV) and for – keV (using the values for keV).. Examination of the Chandra image for the source and background regions show that both contain several faint point sources; none of these is readily detectable in the Swift image, suggesting that the error produced by not excluding them is on the order of the Poisson statistics of the background. We extracted counts from the source and background regions, solving the simultaneous equations to get the total source counts and the background counts per pixel. Since the exposures were relatively short, the background rate was somewhat uncertain, particularly in bands narrower than the full – keV range of the detector. In order to reduce this uncertainty, we determined the mean background rate over all the observations and recalculated the source rates. The difference among individual background rates was small, and the signal-to-noise of the source counts was improved by using the time-averaged background. The resultant light-curve is shown in Fig. 2; the count rate varies from to count s-1.
The – keV– keV) hardness ratios, shown in Figure 3, vary significantly among the observations, making the use of a single energy-conversion factor inappropriate. Instead, we calculated the fluxes and hardness ratios expected as a function of power-law index, assuming an absorbed power law with , determined from the best-fitting parameters for the December and March Chandra data. Then, we used the measured count rates and hardness ratios to produce a flux for each Swift observation. The Swift light curve in flux units is shown in the right-hand panel of Fig. 2. Even with 3 ks exposures, the total number of counts is insufficient for spectral fitting, and the variation in the hardness ratio argues against summing different observations. We obtained three Swift exposures that were nearly simultaneous with Chandra exposures. The fluxes calculated from the Swift count rates and hardness ratios are roughly consistent with those derived by fitting the Chandra spectra, after the latter were corrected for pile-up.
The only earlier Swift XRT observation useful for this work was made in 2005. It provides an upper limit of (0.3 - 10 keV) ((0.3 - 10 keV) ), assuming an absorbed power law with and .
2.3 Previous X-ray Observations from Other Missions
M83 has been a popular target in surveys of normal galaxies. As a result there are sufficient data to determine whether the ULX in M83 has been bright in the past.
XMM-Newton: Three observations of M83 are available in the public archive. The galaxy is well centered in the field of view of the first of these, from 2003, while in the following two, from 2008, the galaxy falls on a peripheral chip, so the ULX is not covered by all of the instruments in the last two observations. We measured upper limits to the EPIC count rates using a source region with and a background region with ; we converted count rates to fluxes assuming an absorbed power law with and . If we assume that the source was constant over all the XMM-Newton observations, the upper limit becomes – keV) (– keV) ), while the best individual instrument/exposure result is for the PN in 2003 of – keV) (– keV) ).
ROSAT: There is one PSPC observation from 1993 and two HRI observations from 1993 and 1994 in the archive, each with exposure time ks (Immler et al., 1999). There is no obvious source at the location of the ULX in the HRI exposures; the detection limit for the combined HRI exposures is – keV) (– keV) ). The nucleus and the ULX are not resolved in the PSPC image. However, since in its ultraluminous state it is comparable to the nucleus in brightness, had the source been ultraluminous during the PSPC observation, one would expect the central source to have had an east-west elongation, which was not observed. Thus we may be reasonably confident that the source was not ultraluminous during the PSPC observation. The same argument can be applied to the ASCA observation in February 1994, and the Einstein IPC observation in July 1979.
Einstein: Besides the IPC observation from 1979, with an exposure time of 6 ks, there are two HRI observations from 1980 and 1981 with exposures of 25 and 20 ks, respectively (Trinchieri et al., 1985). Taking the dimmest detected source in the co-added HRI images from Trinchieri et al. (1985) as an extreme upper limit, we find that the flux is ().
Summary: M83 was observed to a depth that would have revealed a ULX, or even a moderately bright ( erg s-1) X-ray binary in 1979, 1980, 1981, 1993, 1994, 2000, 2001, 2003, 2005, and 2008. The continuously high emission for at least 12 months, from late December 2010 through late December 2011, suggests that if the source has repeated outbursts, they are relatively long. Thus the non-detections over the last three decades suggest that this source is either new or has a long period between ultraluminous episodes.
3 X-ray Results
The Chandra data are magnificent, providing spectra with counts, but have sparse temporal coverage. The Swift/XRT data provide a more complete light-curve, but can provide no more than a hardness ratio. The analysis of each informs and is informed by the other.
3.1 Temporal Variation
The Swift count rate light-curve in Figure 2 shows that the count rate varied within a range of roughly a factor of two. The data hint at a flux decline since March 2011, which is in agreement with the Chandra flux trend. However, given that the source showed flux variations of comparable amplitude during January and February, it may be too early to conclude that the outburst is near its end. The spectral shape, as tracked by the – keV– keV hardness ratio, is also strongly variable. The count rate versus hardness ratio plot in Figure 3 suggests two different regimes of behavior. In epochs 2 to 5, as defined in Table 1, the hardness ratio varied strongly while the count rate did not, staying within to count s-1. In epochs 6 to 13 the hardness ratio did not vary significantly, while the count rate did. After epoch 13 the source returned to the mode seen in the earlier epochs. The broad-band count rate and the hardness ratio are not well-correlated, and do not follow a characteristic track in the hardness-intensity diagram.
The broad-band flux light-curve derived from a combination of Swift and Chandra observations also fluctuates within a range of roughly a factor of two, between 1 and 2. We determined the Chandra fluxes from multicomponent spectral fits. We derived the Swift fluxes by assuming a power-law spectrum absorbed by a column of cm-2, constraining the photon index from the hardness ratio, and normalizing the flux to obtain the measured – keV band count rate. The full range of flux was spanned by observations in epochs 2 and 3 (a day apart) and by epochs 1 and 2 (9 days apart) and 6 and 7 (11 days apart). There is a hint of greater variability in the observations before mid-February (epoch 8) than after; the clump of observations in March (epochs 9-11) shows little variation in count rate or flux. Unlike the count rate versus hardness ratio plot, the flux versus hardness ratio plot shows little structure, and the conversion from Swift count rates to fluxes adds scatter to the data.
Overall, the source variability during our first 12 months of observations is more similar to the variability seen in ULXs such as Holmberg II X-1 (Grisé et al., 2008) and Holmberg IX X-1 (Kaaret & Feng, 2009), than to canonical state transitions, routinely seen in Galactic black hole binaries (Fender et al., 2004; McClintock & Remillard, 2006).
We also investigated the intra-observational variability for each Chandra epoch. We extracted background-subtracted lightcurves with the CIAO task dmextract, and analysed them using the lcstats, efsearch and powspec tasks in FTOOLS (Blackburn, 1995). We computed the power spectrum from the shortest period not biased by the Chandra readout rate ( s) to the length of the shortest observation ( ks). We do not find significant features in the power spectral density over this to Hz band for any observation, nor do we see any dips, eclipses or flares. The probability of a constant light-curve is for each epoch; the Kolmogorov-Smirnoff probability (Kolmogorov, 1941) that the flux is constant is for all observations except for that of September 2011 (when it is ). We can only place a upper limit of () to the RMS fractional variation for 10 s (100s) bins at any epoch. Overall, the short-term variability is unremarkable. Heil et al. (2009) has demonstrated that ULXs show a wide variety of short-term variability, including many that show no signs of variability.
3.2 X-ray Spectroscopy
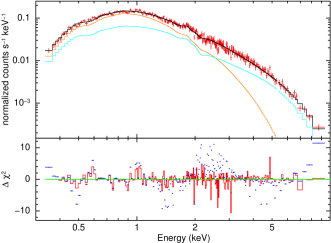
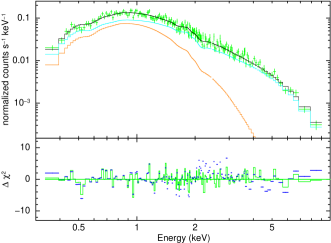
For each Chandra observation, we extracted source spectra from a circular region with a radius, and background spectra from an annular region between radii of and ; we verified that the background region contains no other point sources and only a negligible amount of diffuse emission. We used the specextract script in CIAO Version 4.3 (Fruscione et al., 2006) to build response and area-corrected ancillary response files, and we fitted the spectra in XSPEC Version 12 (Arnaud, 1996). Two fully representative examples of the Chandra spectra and the fits we carried out are shown in Figure 4.
We fitted the – keV spectrum from each of the Chandra observations with two XSPEC models commonly applied to the study of black-hole X-ray binaries: an absorbed disk blackbody (diskbb) plus power-law model, and an absorbed thermal Comptonization (comptt) model (Titarchuk, 1994). The diskbb plus power-law model in ULXs is typically a good but purely phenomenological test for the presence of a soft excess below 1 keV. Under certain assumptions, the soft excess emission may be attributed to the accretion disk and may be used to constrain the inner disk size. The comptt model is a suitable test for mild spectral curvature, in particular at the high energy end of the ACIS bandpass; a characteristic class of ULX spectra with a downturn around 5 keV is formally well fitted with Comptonization models at low plasma temperatures, to keV (Stobbart et al., 2006; Roberts, 2007; Gladstone et al., 2009).
The Galactic absorbing foreground column is cm-2 (Kalberla et al., 2005) while the column density due to M83 in this direction is cm-2 (using the naturally weighted map from Walter et al., 2008). Thus, other than any internal absorption, the emission should be only lightly absorbed by intervening components. As a result of these considerations, we assumed a fixed Galactic foreground absorption with a column density of cm-2, and a variable absorption from within M83 and the system itself. These column densities are roughly comparable to the optical extinction (see Section 4.2).
At the observed ACIS-S count rate ct s-1 (Tables 2 and 3), the source spectra are affected by pile-up333 http://cxc.harvard.edu/ciao/download/doc/pileup_abc.pdf, meaning that there is a high probability that more than one photon falls in a single pixel (or adjacent pixels) between frame readouts. In general, one can correct for the spectral distortions caused by pile-up either by removing pixels with a high pile-up probability from the spectral extraction regions, or by using convolution models during spectral fitting. We started with the latter technique, and used the pileup convolution model of Davis (2001) within XSPEC. This model has two principal parameters which can be allowed to vary: the grade migration parameter, , and the fraction of the events in the source extraction region to which the pileup will be applied, psffrac. When we allowed both of these parameters to vary, we usually found that there were two separate regions of parameter space that fit the Chandra spectra. The two model fits implied very different pile-up corrected count rates and different ranges of the and the psffrac parameters, but otherwise produced the same spectral shape and goodness of fit, as determined by . To break the degeneracy and select the proper range for and psffrac, we extracted another set of source spectra from annuli that excluded the piled-up central pixels. We then constrained the and psffrac parameters so that they would produce a spectral fit to the piled-up data that was consistent with the fits to the spectra extracted from the annuli. That this rather involved process produces the correct flux is supported by the several nearly simultaneous Swift observations for which the pile-up corrected Chandra fluxes are roughly consistent with their Swift counterparts.
We find that a diskbb component is significantly detected in five of the observations but not the other five (Table 2). Although a cool disk-blackbody component produces a marginal improvement in the for two of those four observations, the F test shows that it is not statistically significant (F-test probability for the 23 December 2010 observation, for 4 September 2011). For the 28 December 2011 observation the disk-blackbody produces a significant improvement in the fit (F-test probability ) although the disk-blackbody component itself is only marginally detected (see Table 2). We see no evidence for a disk-blackbody component in the remaining two observations. A soft excess is detected significantly in the 3 April 2011 observation (F-test probability ), but at very low temperatures ( keV) in an energy range where the ACIS-S3 sensitivity is low and most of the emitted flux is absorbed. Thus, we can neither determine whether that soft excess is a diskbb component, nor reliably constrain its characteristic temperature and emission radius.
The absence of a diskbb component in some observations cannot be due simply to shorter exposure times. Had such a component always been as strong as during the March 2011 observations, when it accounted for almost half of the emitted X-ray flux, it would have been easily detected at every other epoch. It is implausible that an accretion disk would form, for example, in the two days between 23 and 25 December 2010, or vanish between 29 March and 3 April 2011. Thus, we suggest that the differing significance of the diskbb component in various observations more likely depends on the fraction of the inner-disk photons that are upscattered in a rapidly variable Comptonizing medium; it is this upscattering that is probably responsible for the power-law component.
As the observations from March 2011 are those where the diskbb component is most prominent, they give us the best direct view of the inner disk, and allow us to use those observations to constrain the disk parameters. The characteristic peak temperatures at those epochs are to keV corresponding to a characteristic inner radius to km. If corresponds to the innermost stable circular orbit of a face-on Schwarzschild black hole, this value would suggest a black hole mass to , or higher for a fast-spinning black hole. On the other hand, the classical Eddington-luminosity argument provides a lower limit of for the black hole mass for the same data, L ergs s-1. These two estimates stand in apparent contrast to one another. However, we have no reason to assume that we are seeing disk emission from near the innermost stable circular orbit. If the inner part of the disk is covered by an optically-thick scattering region, the thermal component should come from a larger radius. This is likely to be the case if the mass accretion rate is super-critical, that is above the threshold at which a radiatively-efficient, geometrically-thin disk cannot survive. At such accretion rates (which may be the defining characteristic of ULXs), the inner region may be shrouded by a mass-loaded, optically-thick outflow, and thus the observed temperature of the soft thermal component would be the temperature at the photosphere of such outflow, while the fitted inner-disk radius would be the radius at which the disk begins to be covered or replaced by the outflow (e.g. King & Pounds, 2003; Poutanen et al., 2007; Soria, 2007; Gladstone et al., 2009). It has been suggested (Gladstone et al., 2009) that a ULX with a lower diskbb temperature ( keV) and relatively weak soft thermal component compared to the hard power-law component will have a stronger outflow and greater mass loading, and thus a lower electron temperature in the wind-dominated, Comptonizing inner region (“warm corona” at keV), which results in a spectral break at energies keV.
In our case, the power-law component is dominant or comparable to the diskbb emission at all epochs. The strong power-law component suggests that the inner disk may indeed remain partly shrouded even in the March 2011 observations, and hence the characteristic masses and sizes based on must be taken as upper limits. Fitting the spectra with the comptt model helps us investigate this issue. For all observations, the comptt model provides statistically equivalent fits to the diskbb plus power-law model. For all except the 23 December 2010 observation, we can place only a lower limit (typically, keV) to the best-fitting electron temperature in the scattering region; this is another way of saying that the power-law-like portion of the spectrum extends beyond the upper limit of the ACIS energy band, without a sharp downturn at least up to keV. To test for the presence of a high-energy spectral break, we fitted the – keV portion of the spectrum with both power-law and broken power-law models, after fixing the pile-up model parameters. We find (Table 4) that a broken power-law model does not improve the fit in any of the Chandra observations. The lack of a break in the power-law suggests either that this ULX was not in a slim-disk/optically-thick warm-corona state (Roberts, 2007; Gladstone et al., 2009), or that its characteristic coronal temperature was higher than typically found in that variety of ULXs. We conclude that the accretion rate was only moderately super-critical, perhaps not high enough to launch a massive outflow, and that the spectral appearance of this ULX is closer to the “very high state” of Galactic BH transients than to the most extreme examples of warm-corona/outflow sources described in Gladstone et al. (2009).
With only a few exceptions, both the powerlawdiskbb fits and the comptt fits indicate that the source has very little internal absorption. The diskbb fits suggest intrinsic absorbing column densities a few times cm-2, somewhat larger than the local H I column, cm-2; the comptt fits suggest values consistent with no M83 absorption at all.
Finally, we searched for emission lines, either from the ULX itself (e.g., Fe K lines) or from spatially unresolved, X-ray ionized gas in its surroundings. We combined the spectra and their respective response files from all the 2010–2011 Chandra observations to increase the signal-to-noise ratio of any possible features. We do not find any significant lines or edges. A narrow 6.4 keV emission line could be added to the local best-fitting continuum, but can have an equivalent width no greater than eV (90% confidence level). Non-detection of either broad or narrow fluorescent Fe lines is not a surprising feature for a ULX (e.g., Goad et al., 2006), although such lines have been detected in the peculiar case of a ULX in M82 (Strickland & Heckman, 2007; Dewangan et al., 2006). In general, Fe lines from stellar-mass black holes are weaker than those from AGN (Ross & Fabian, 2007), because iron in the inner region of the accretion disk is more highly ionized, and the blurring of the line profile due to Compton scattering is more severe. This is the case in particular when the power-law-like X-ray emission from a scattering corona is comparable to or stronger than the direct thermal emission from the accretion disk—as is the case for most ULXs above 1 keV. If the inner region of the disk is covered or replaced by an optically thick scattering corona (Roberts, 2007), we do not expect to see any reflection features. Caballero-García & Fabian (2010) proposed that ULX spectra with a steepening around – keV are dominated by a reflection component with a relativistically broadened Fe line; however, this interpretation remains somewhat controversial as it requires ad hoc parameters. In any case, the continuum spectrum of the ULX in M83 does not have such high-energy steepening, either.
In conclusion, had we not had previous observations of M83, the X-ray properties of this source would look like those of any number of ULXs. Its power-law photon index , and its relatively low disk temperature are consistent with average ULX properties (Feng & Soria, 2011; Berghea et al., 2008). Flux variability by a factor of a few on timescales of days (and longer) is typical of ULXs (Grisé et al., 2008; Kaaret & Feng, 2009), though statistics on that variabilty are sketchy, and the most closely monitored sources are brighter than this one. Finally, the lack of a disk-dominated phase of the outburst (known as high/soft state in Galactic black holes) is also a typical ULX property (Soria, 2011).
4 Optical Counterpart
Optical counterparts of persistent ULXs are typically faint, usually with a B-type star-like appearance at extragalactic distances. When significantly detected, optical variability is only a fraction of a magnitude (e.g., Zampieri et al., 2011) and its physical interpretation is unclear. But in this case, given the proximity of M83 and the dramatic change in the X-ray flux, we have a unique opportunity to investigate and understand the corresponding changes in the optical and UV fluxes. The change was, as expected, below the detectability of the Swift UVOT, but was recorded with high confidence by HST and ground-based observatories.
4.1 Ground-Based Observations
As part of a previously planned Gemini program, we were able to image the section of M83 containing the ULX from the 8.2-m Gemini-South telescope on 8 April 2011 (UT) (Program # 2011A-0436, Winkler PI). We used the Gemini Multi-Object Spectrograph (GMOS) in its imaging mode, which has a field 55 square and 00728 pixels. We binned the image for an effective pixel size of , appropriate for the seeing of at the time of our observations. Four filters were used: , , , and , with individual exposures of 600, 100, 150, and 200 s, respectively, and with four dithered exposures through each filter. We processed the image data using standard IRAF444 IRAF is distributed by the National Optical Astronomy Observatories, which is operated by the AURA, Inc., under cooperative agreement with the National Science Foundation. and Gemini reduction procedures for overscan and bias subtraction, flat-fielding, aligning, and stacking. Flux calibration was done using observations of the spectrophotometric standard LTT 4316 (see Hamuy et al., 1992) taken immediately after the M83 images. All observations were at airmass .
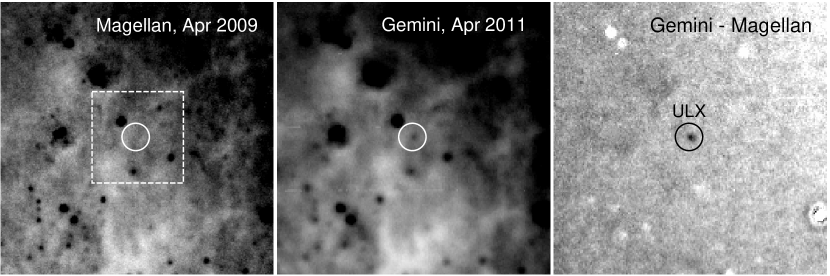
A blue stellar object, faint but clearly visible, is present at the position of the ULX in the stacked images in the , , and bands, and possibly in as well (Figure 5, central panel). Even though the source is located in an inter-arm region well within the innermost spiral arm of M83, the background from the galaxy is complex enough to make accurate photometry of a faint object difficult.
We had previously taken images of M83 with the IMACS instrument on the 6.5-m Magellan I telescope in April 2009 as part of a program to inventory supernova remnants and other nebulae in M83 (Program # 2009A-0446, Winkler PI). These images were taken through narrow-band filters and so are not directly comparable to the 2011 Gemini images, but they nevertheless show fainter stars than the 2011 images because of long exposures and exceptional seeing, . No object at the ULX position is visible in these 2009 images with an upper limit mag. Although the bands are far from identical, we can use the Magellan images (after PSF matching and scaling) to subtract much of the stellar contribution in the Gemini images near the ULX, to produce a background that is far more uniform and thus more amenable to aperture photometry. Figure 5 shows both a Gemini and a Magellan image of the region, together with a difference image that clearly shows the ULX counterpart. From the and images we subtracted the sum of [O III] plus a 200 Å wide continuum band centered at 5200 Å; from the image we subtracted one in a 150 Å wide continuum band centered at 6800 Å. We used these difference images for conventional aperture photometry of the ULX counterpart to obtain the Gemini AB magnitudes given in Table 5. The uncertainties quoted include any due to possible residuals from imperfectly subtracted stars and diffuse background.
4.2 Hubble Observations
Images with better angular resolution and higher sensitivity for the M83 field containing the ULX were taken in August 2009 with the newly installed WFC3 instrument on HST as part of the Early Release Science program (Dopita et al., 2010). Within the error circle of the ULX position, there are no blue sources; the only objects are a few very faint red stars. Following the discovery of the ULX counterpart in the Gemini images, we requested and were awarded two orbits of Director’s Discretionary HST time for a second-epoch WFC3 observation, which was carried out on 27 July 2011 (Program 12683, PI: Winkler). The data were processed with the standard WFC3 pipeline, including drizzling of the three dithered frames taken through each of the four filters. The ULX counterpart is readily apparent in the 2011 WFC3 images through the F336W (), F438W (), and F555W() filters. Alignment and subtraction of the 2009 image renders the counterpart easily visible on the 2011 F814W () image as well. The world coordinate systems associated with the WFC3 images at both epochs have been updated to agree with that which we determined for the Magellan images, which in turn was based on several hundred astrometric stars. The position of the ULX counterpart is
We estimate the absolute uncertainty in the coordinates to be, at worst, , and the registration of all the images relative to one another is better than 10 mas. The difference between the optical and X-ray coordinates is , which is well within the combined uncertainty of the X-ray and optical positions. WFC3 images from both the 2009 and the 2011 epochs are shown for a small region directly around the ULX position in Figure 6.
We have carried out photometry of the ULX counterpart and neighboring stars in the WFC3 images using DAOPHOT, consistently taking an aperture with a radius of 2 pixels (008) and using standard encircled-energy corrections to account for the missing flux. In the 2009 images, there are a number of very faint red stars quite near the position of the ULX counterpart, though it is not clear if any of them is actually the donor star in quiescence. After updating the world coordinate systems of both images so they are accurately registered, we carried out photometry of the 2009 images using the identical positions and apertures as in 2011 to obtain the limits given in Table 5. While we used standard procedures for the July 2011 observations, we used “forced photometry” at the position of the ULX for the July 2009 data. We did see an excess at the position of the ULX, and these are the values reported in Table 5. However, since there was no specific counterpart at this position, the values represent upper limits to the flux from the counterpart.
As part of an ongoing analysis of the HST data for M83, Hwihyun Kim (private communication) provided photometry and reddening estimates for stars surrounding the ULX position. She determined a mean total extinction of A. This value indicates modest but variable extinction, consistent with the appearance of the HST imagery. We adopt this mean value for the ULX in correcting the values in Table 5 to obtain intrinsic fluxes. From the WFC3 data we find that the counterpart’s absolute magnitude is , and a total optical luminosity of at the time of the July 2011 observation. In quiescence, the counterpart was no brighter than , and therefore the optical counterpart has brightened optically by a factor of at least 10.
Comparison between the AB magnitudes obtained on 8 April from Gemini and those obtained on 27 July from HST (Table 5) indicates no evidence for optical variability over this period. Further monitoring of the optical source would be valuable, either in tight coordination with X-ray observations, or especially if the X-ray object starts to fade significantly.
5 Discussion
We have discovered a bright new source in the low-extinction inter-arm region of M83. Although it is well within the D25 radius, it is still worth considering whether the source could be a background AGN. Using a standard definition of the X-ray/optical flux ratio
(Hornschemeier et al., 2001) where is the – keV flux and is the Cousins magnitude, we find for this source, with and , . This is typical of stellar-mass systems, while AGN have typical (Bauer et al., 2004; Laird et al., 2009). Furthermore, AGN at this flux level are relatively rare (only per square degree: Cappelluti et al., 2009) and nearly always have identified optical counterparts. Finally, we are not aware of any AGN that has been observed to vary in X-rays by the factor of at least 3000, as seen for the X-ray source in M83. Thus, it is highly improbable that the source is a background AGN. There are no known historical supernovae in this region, so it is unlikely that the sudden X-ray/optical increase is due to a previously undetected remnant beginning to interact with the circum-stellar medium.
Our discovery of a transient ULX in an interarm region of M 83 suggests that the ULX population is more diverse than often assumed. Most ULXs in nearby galaxies are variable sources but have been persistently active throughout the years since their original discovery (typically, with ROSAT in the 1990s). Instead, this source was not detected by Einstein, ROSAT, XMM-Newton, nor in previous Chandra observations. A flux increase of between the 2000–2001 and the 2010–2011 Chandra observations is very unusual for a ULX, but it resembles typical behavior of Galactic black hole transients. Its current bright state has lasted at least twelve months, but likely less than two years (based on the faintness of its optical counterpart in the August 2009 HST observations). This is longer than most Galactic black hole transients (typically, a few weeks: McClintock & Remillard, 2006), but is not unprecedented. For example, the 1996–1997 outburst of GRO J165540 lasted for 15 months (Soria et al., 2000), and GRS 1915105 has remained bright since 1992 (Castro-Tirado, 2011).
The other defining characteristic of this ULX is that it is located far from any star-forming region, and it must have a low-mass, evolved donor star (mass ), since no OB counterparts were detected at the ULX position before the start of the outburst (see §5.2). Irwin et al. (2003, 2004) argued that ULX candidates in the old stellar populations of elliptical galaxies were mostly due to background AGN contamination. In spiral galaxies with mixed populations, ULXs with low mass counterparts had been identified only in a statistical sense (Swartz et al., 2004; Walton et al., 2011). However, our secure identification of this ULX with its optical counterpart confirms the existence of two different classes of ULXs. More specifically, this source is a ULX powered by accretion from a low-mass donor in an older environment within a galaxy with active star formation. This suggests that a classification of ULXs based on the global properties of their host galaxies is incomplete, as it may miss or underestimate a population of older, transient ULXs with short active phases, particularly at the lower reaches of the “ultra-luminous” luminosity range. The presence of older ULXs in star-forming galaxies has long been proposed by Mushotzky (2006). Further evidence for the existence of ULXs with low-mass donors in old stellar populations comes from two transient sources that are only a factor of two less luminous than the new ULX in M83: one in NGC 5128 (Sivakoff et al., 2008) and one in M31 (Kaur et al., 2011).
5.1 The Nature of the Accretor
Beginning with Shakura & Sunyaev (1973), a number of steady-state mechanisms have been proposed to allow large super-Eddington accretion rates that lead to much milder super-Eddington luminosities. Galactic black-hole binaries however, with a few exceptions (Jonker & Nelemans, 2004), stubbornly remain below the Eddington limit. While it is accepted that ULXs are powered by accreting black holes, the main unsolved issue is whether they contain a different (more massive) kind of black hole than typical Galactic sources, or are simply in a different accretion state (e.g., at a super-Eddington accretion rate). We found that the – keV spectrum of this source is typical of ULXs: dominated by a power-law with a photon index (intermediate between the soft and hard state of Galactic black holes), with an additional soft thermal component at keV (cooler than typical accretion disks of Galactic black holes). The characteristic inner-disk radius implied by the thermal component is km: this corresponds to a Schwarzschild black hole mass if we are directly seeing the disk all the way to the innermost stable circular orbit, or if the inner disk is hidden by a Comptonizing region. The latter scenario is more likely, given the dominant power-law component. In fact, in some Chandra observations the thermal component disappears altogether, which suggests that a larger fraction of the disk emission is Comptonized at such times.
A strict application of the Eddington limit requires a black hole mass ; however, luminosities up to times Eddington (implying correspondingly lower black hole masses) can be produced in standard accretion scenarios. For example, analytical solutions of standard accretion models show that the true emitted luminosity for (Poutanen et al., 2007). Recent radiation-magnetohydrodynamic simulations confirm that the isotropic luminosity can reach during super-critical accretion (Ohsuga & Mineshige, 2011). In addition, mild geometrical beaming can further increase the apparent luminosity by a factor of two for a standard disk seen face-on and by a factor of 10 for supercritical accretion flows (Ohsuga & Mineshige, 2011). Observationally, several neutron star X-ray binaries have reached luminosities of a few times Eddington in their flaring state (Bałucińska-Church et al., 2010; Barnard et al., 2003; Homan et al., 2007). Thus, calculated black hole masses may be overestimated by a factor of .
It is still an unsolved theoretical problem whether black holes can form from standard stellar evolution at high metallicity (Belczynski et al., 2010; Heger et al., 2003), as metal lines make mass loss more efficient, decreasing the pre-collapse stellar mass drastically. As pointed out in Heger et al. (2003), there are very large uncertainties on exactly what mass/metallicities can actually produce a black hole. It has been argued (Pakull & Mirioni, 2002; Mapelli et al., 2009; Zampieri & Roberts, 2009) that ULX formation either requires a low-metallicity environment, or is enhanced by a low-metallicity environment (Prestwich et al., 2011). This source demonstrates that low metallicity need not always be the case, since the environment in the inner disk of M83 where the ULX is located can hardly be characterized as a low-metallicity one. Accurate measurements of abundances in regions with relatively high metallicity are notoriously difficult, but recent estimates based on deep spectra of H II regions within the D25 radius give oxygen abundances for a radius of from the nucleus to be 12+log(O/H)=8.73 (Bresolin et al., 2009), compared to the solar value of 8.69 (Asplund et al., 2005) and the local ISM value of 8.69 (Snow & Witt, 1996). A different method applied to the H II regions of M83 produces for the same radius 12+log(O/H)=8.59 (Pilyugin et al., 2006) compared to their local ISM reference value of 8.50. While there is some disagreement about the absolute oxygen abundance, it is clear that the relative oxygen abundance for this region is slightly higher than solar. In such an environment, even an older population is unlikely to have a low metallicity, unless the ULX is from a disrupted dwarf galaxy. This object suggests that black holes with masses can be found in environments where the local abundance is solar to somewhat super-solar, whereas models suggest that at these abundances only black holes with are produced (Belczynski et al., 2010). Reducing abundances to LMC values can produce black holes , so finding a black hole in a region with solar abundances, even accounting for enrichment since its stellar formation, is rather unusual and difficult to understand.
5.2 The Nature of the Optical Counterpart
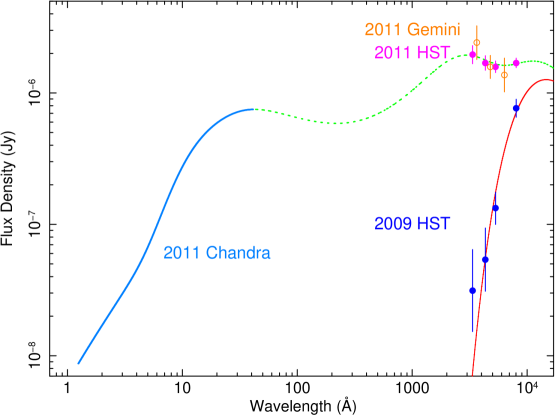
The optical colors of the system in outburst are not consistent with a simple blackbody-like spectrum; the flux density, as shown in Fig. 7, decreases from the near-UV to the visible band, but increases again towards the I band. This behavior suggests the presence of at least two components: one peaking in the UV (implying a characteristic blackbody temperature K and a characteristic effective radius ) and one in the IR (implying a characteristic blackbody temperature K and a characteristic effective radius ). There are (at least) two ways to interpret this situation. One possibility is that the IR emission is dominated by the large outer disk, and the UV excess is the hot spot or the irradiated surface of the donor star. An alternative is that the UV peak is the Rayleigh-Jeans tail of the emission from an irradiated disk and the I-band excess is the Wien tail of the emission from a cool stellar component. In the latter case the disk must be truncated or at least shaded from irradiation beyond . If the disk is shaded, there will be no significant emission from beyond as the temperature of a non-irradiated disk would be 2000-3000 K (Shakura & Sunyaev, 1973; Frank, King & Raine, 2002) and would drop rapidly with distance. At those temperatures, the disk gas is entirely neutral, and opacity drops to a minimum (Ferguson et al., 2005). It is still debated whether the outer disk is optically thin or thick to the continuum in that regime (e.g. Cannizzo & Wheeler, 1984; Hynes et al., 2005; Idan et al., 2010); however, in either case, its emission should be negligible compared to that from the irradiated part of the disk and the donor star. The pre-outburst optical spectral energy distribution contains only a red component which we suggest is either the donor star or an unrelated red star along the line of sight. When we add to that an irradiated disk model, with disk parameters constrained by the Chandra observations of March 2011, we recover the optical brightnesses of the 2011 HST observations. Thus we argue that UV/optical emission is due primarily to the irradiated disk, with some stellar contribution in the near-IR.
We used the XSPEC model diskir (Gierliński et al., 2009, 2008) to model the irradiated disk emission for the 23 March 2011 Chandra data. This observation was chosen because it was the longest, had the best constrained accretion disk parameters, and was made close to the Gemini observations, which we can then tie to the HST observations. We verified that the best-fitting disk and power-law parameters obtained with diskir for the X-ray data are consistent with the corresponding parameters obtained with our previous fits. The advantage of the diskir model over the simpler, more traditional diskbb plus power-law model is that it allows a more natural extrapolation into the optical band, as the power-law component does not extend beyond the peak of the disk emission. We found that the UV/optical colors of the 2011 HST observations are best-fitted with a disk truncation radius cm , and a fraction of X-ray photons intercepted and re-radiated by the disk to be , a very plausible value for irradiated disks in binary systems. Reprocessing fractions between and are suggested both by theoretical modelling (e.g., Vrtilek et al., 1990; de Jong et al., 1996; King et al., 1997; Dubus et al., 1999) and by observations of accretion disks in Galactic black holes (e.g., Hynes et al., 2002; Gierliński et al., 2009).
The red excesses in both the pre- and post-outburst spectral energy distributions (SEDs) can be represented as a blackbody with K and , implying a radius . This set of parameters is consistent with an AGB star of initial mass – and an age – Myr (Padova stellar tracks: Salasnich et al., 2000; Bertelli et al., 2008, 2009; Marigo et al., 2008; Girardi et al., 2010). We do not have enough evidence to determine whether the faint red component comes from the ULX donor star, or from an unrelated evolved star that is projected in the sky within of the X-ray source, or even from a positive fluctuation in the background stellar density. There are several other faint red stars in the field (Figure 6). If some of the red emission seen from the optical counterpart when the ULX is in outburst stems from an unrelated star, then the true donor star of the ULX would be even fainter and less massive than we have calculated, but our interpretation of the system remains valid. Even if the red excess is due to a single stellar companion, the parameters given above are descriptive rather than prescriptive; binary evolution is likely to have produced a companion whose structure is somewhat different than an isolated AGB star.
The upper mass/luminosity limits that we place on the optical counterpart are not inconsistent with population studies of the surrounding region. Hwihyun Kim (private comunication) provided photometry, reddening, and age estimates for the bright stars in a region around the ULX, based on an analysis of the color-color and color-magnitude diagrams. However, none of those stars is close to the ULX ( pc); the population surrounding the ULX is dominated by an older and fainter population than is accessible by color-color and color-magnitude diagrams, even with HST.
If we had observed the optical counterpart only in the X-ray luminous state, we would have classified it as a main-sequence early-type B star or a blue supergiant, in agreement with most other ULXs for which a unique optical counterpart has been proposed (Tao et al., 2011). However, in at least one case (Feng & Kaaret, 2008; Roberts et al., 2008), it was already suspected that the optical brightness is strongly affected by X-ray irradiation and reprocessing on the stellar surface and/or the outer accretion disk. Here, for the first time we can prove that this is the case because this source is a transient and we have two sets of observations in which the optical brightness is strongly different. It is plausible that some other ULXs with apparently massive donor stars in fact have a low-mass donor and a bright accretion disk.
5.3 The Geometry of the System
The high mass-accretion rate required by the X-ray luminosity, coupled with the low soft-X-ray absorption observed in the X-ray data, imply mass transfer via Roche lobe overflow (as should be the case for most ULXs), and hence the formation of a large accretion disk around the black hole. We have argued that most of the optical emission in outburst is likely to come from the irradiated disk. The required fraction of intercepted X-ray photons is comparable to the typical values inferred for Galactic LMXBs, for which the emission is thought to be quasi-isotropic. We would not expect the same level of reprocessing if most of the X-ray luminosity was beamed along the axis perpendicular to the disk plane. Thus the presence of strong optical reprocessing is further evidence that a ULX is not strongly beamed.
Quantitative estimates of the outer disk size and temperature based on broad-band fits to the X-ray/optical spectral energy distribution are somewhat model-dependent; the disk-blackbody component of the X-ray emission varies from epoch to epoch. However, we can obtain useful order-of-magnitude estimates of the system size by applying the empirical relation between optical brightness of an irradiated disk and binary period found by van Paradijs & McClintock (1994):
where is the binary period in hours. In outburst, the absolute visual brightness of the ULX counterpart in the standard (Vegamag) system is mag (Table 5, after correcting for line-of-sight extinction). If the X-ray luminosity –, as most classes of ULX models suggest (e.g. Feng & Soria, 2011), this corresponds to an orbital period to days. Since the donor star is filling its Roche lobe, for mass ratios (Eggleton, 1983), where is the average stellar density in g cm-3. Thus, we obtain . These are typical densities of red giants or AGB stars (Salasnich et al., 2000; Bertelli et al., 2008, 2009), consistent with our interpretation of the system. As a comparison, our independent estimate of a mass and radius for the red star apparently associated with the ULX implies a mean density g cm-3, in agreement with the expectations if that is the true donor star.
The size of the accretion disk remains uncertain. Using our lowest estimate for M M⊙ and our upper estimate for the M M⊙, the radius of the primary’s Roche lobe is at least a few hundred . The maximum size of an accretion disk is of the size of the primary’s Roche lobe (Paczynski, 1977; Whitehurst, 1988), which corresponds to a characteristic size cm for this ULX. On the other hand, we have argued that the optical colors and luminosity in outburst suggest an irradiated disk size cm. One possibility is that the disk is truncated at that radius, in which case the whole disk would be kept ionized by the X-ray illumination. Alternatively, the outer part of the disk may be shaded from irradiation, and therefore much colder, neutral, and not a significant contributor to the optical/IR emission; the temperature of a non-irradiated standard disk (Shakura & Sunyaev, 1973) at cm would be only K, for the disk parameters fitted to the X-ray emission. We do not have enough information to choose between the two scenarios. Whether the outer disk is mostly ionized or neutral has implications for the transient behavior.
5.4 Transient Behavior
Most Galactic black holes with a low-mass donor star are transient, while most of those with an OB donor are persistent X-ray emitters (albeit with flux and spectral variability). We suggest that the same may be true for ULXs. A few other examples of ULX transients are two sources in NGC 1365 (Soria et al., 2009), one in M 31 (Kaur et al., 2011) two in M 101 (Kuntz et al., 2005), one in NGC 3628 (Strickland et al., 2001), and one in M 82 (Feng & Kaaret, 2007). The transient behavior in accreting stellar-mass black holes has been attributed to thermal/viscous disk instabilities (Mineshige & Wheeler, 1989; Osaki, 1996; Lasota, 2001) and/or to mass transfer instabilities (Hameury et al., 1986, 1987, 1988; Viallet & Hameury, 2008).
Mass-transfer instabilities operate when the evolved donor star is nearly but not entirely filling its Roche lobe, providing only a low accretion rate and thus producing a low-luminosity “quiescent” state. The resulting X-ray photons penetrate a few Thompson optical depths below the photosphere of the donor star, causing the convective envelope to expand slowly until the star makes full contact with its Roche lobe. This contact dramatically enhances both the mass transfer rate through the L1 point and the X-ray luminosity of the system, which is generally seen as an “outburst” state. However, as a larger accretion disk is formed, it eventually shades the L1 region from X-ray irradiation, decreasing or stopping mass transfer. The parameter space for the mass transfer instability in ULXs is largely unexplored. A necessary condition is that the irradiating X-ray flux at the surface of the donor star be stronger than its intrinsic flux. This is not the case for ULXs with massive donors, but is true for this source and probably for other ULXs with low-mass donors.
In the disk instability model, the disk follows a limit cycle between a hot (higher viscosity) and a cold (lower viscosity) state. The difference between the two states is due to the sudden jump in opacity when the temperature reaches K and hydrogen becomes mostly ionized (Cannizzo et al., 1988). The instability can be suppressed if the whole disk is kept ionized by X-ray irradiation (Burderi et al., 1998; King & Ritter, 1998; Janiuk & Czerny, 2011). For the observed luminosity of the M83 ULX at the peak of the outburst, the outer disk can be kept ionized by irradiation up to a radius cm, where is the fraction of X-ray flux reprocessed by the disk. From the inferred size of the binary system, the accretion disk can extend beyond this instability boundary if the outer radius reaches the tidal truncation radius (Paczynski, 1977; Whitehurst, 1988). On the other hand, the observed optical colors suggest that the outer disk of the ULX has a temperature K and hence is truncated well inside the tidal radius. Thus, we cannot tell whether the disk instability operates on the ULX in M83 and will be responsible for ultimately bringing the outburst to a close.
If the outburst does end soon, and the X-ray luminosity declines to below erg s-1, we will have a great opportunity to monitor its spectral behavior in the luminosity range typical of Galactic black holes. Determining whether or not a ULX behaves like an ordinary stellar-mass black hole (e.g., similar state transitions and evolution in the hardness-intensity diagram) when its luminosity drops will tell us whether it is powered by an intrinsically different type of black hole, or by an ordinary stellar-mass black hole at an extremely high accretion rate, not usually reached by Galactic black holes.
6 Summary
We have discovered a new ULX in M83 using Chandra, and have characterized the X-ray properties of the source in a series of Chandra and Swift observations extending through December 2011. We have also detected the optical counterpart to the source using the Gemini South Telescope and HST. The ULX is located in an inter-arm region and well away from sites of active star formation. Its observed properties and our interpretation of them can be summarized as follows:
-
1.
At its discovery in December 2010, the luminosity was . The source has remained bright; its luminosity has varied by a factor of two, and it has only recently dropped to . There is no previous evidence for the existence of this X-ray source in observations extending back to 1979; the X-ray flux has increased by at least a factor of 3000.
-
2.
Although there is significant variation between observations, the X-ray light-curves of individual observations show no signs of short-term variability, nor are there signs of orbital modulations or eclipses.
-
3.
The X-ray spectra can be well fitted by a disk blackbody plus power-law model, or by an absorbed Comptonized spectrum, typical of most ULXs. The strength of the disk blackbody component varies on timescales of days. We attribute this to the fraction of inner disk photons upscattered in a variable Comptonizing region, rather than to a change in the disk.
-
4.
In those X-ray spectra where a disk is evident, the disk luminosity and temperature suggest an inner accretion disk radius of about 1000 km, corresponding to a Schwarzschild black hole with mass . The black hole mass could be less if the inner disk is hidden by a Comptonizing region. In order to strictly obey the Eddington limit, the black hole must have a mass . However, if we allow the possibility of accretion luminosities up to three times the Eddington limit at super-critical accretion rates, the X-ray data are still consistent with an ordinary stellar-mass black hole.
-
5.
A blue optical counterpart with has appeared since August 2009, presumably at the same time as the ULX. The only stars near this site prior to the appearance of the ULX are faint and red, so must belong to an older population. The donor star is not an OB star, and is likely to be a red giant or AGB star with and age Myr. We note, however, that had the system been observed only in its luminous state, the donor could easily have been mistakenly interpreted as an OB star, consistent with most other ULXs with uniquely identified optical counterparts. Some of these other ULXs may well have low-mass donor stars as well.
-
6.
During the X-ray outburst, the spectral energy distribution of the optical counterpart is dominated by a blue component, with mag, which we interpret as the Rayleigh-Jeans tail of the emission from the outer disk, heated by the X-ray photons. In addition, there is a faint red component that may arise from the surface of the donor star, although we cannot exclude the possibility that it stems from other unrelated stars in the vicinity.
-
7.
The M83 ULX system provides clear evidence that not all ULXs involve an OB donor and a young stellar population, confirming the suggestion from statistical studies that there are two classes of ULXs.
-
8.
The existence of a ULX in the inner disk of M83 suggests that it is possible to produce black holes also in systems with at least solar metallicity.
The ULX in M83 has provided significant insight into the diversity of the ULX population, and provides us with an unequivocal example of a ULX with a low-mass donor. Continued monitoring of this source will bring greater depth of understanding to this source and this class of sources. Determining the length of the current outburst will constrain the extent to which sources like this contribute to the persistent ULX population, and the length of the decline may constrain the size of the accretion disk. It is still actively debated whether ULXs are a state reached by ordinary stellar-mass black holes at extremely high (super-Eddington) accretion rates, or are powered by a different (more massive) type of accreting black hole. Almost all Galactic black hole transients pass through a high/soft state (dominated by thermal disk emission) after the peak of their outburst and before returning to quiescence; they remain in that state for several weeks. If this ULX does the same, the luminosity at which the state changes will help us understand and quantify the relation between stellar-mass black holes and ULXs. If, instead, this ULX continues to behave like a ULX even when its luminosity goes below erg s-1, then it is likely that there are intrinsic physical differences between the BHs in ULXs and the ordinary stellar-mass black holes. Clearly, this is an interesting object that will continue to illuminate our ignorance about ULXs.
References
- Arnaud (1996) Arnaud, K. A. 1996, in Astronomical Society of the Pacific Conference Series, Vol. 101, Astronomical Data Analysis Software and Systems V, ed. G. H. Jacoby & J. Barnes, 17
- Asplund et al. (2005) Asplund, M., Grevesse, N., & Sauval, A. J. 2005, in Astronomical Society of the Pacific Conference Series, Vol. 336, Cosmic Abundances as Records of Stellar Evolution and Nucleosynthesis, ed. T. G. Barnes III & F. N. Bash, 25
- Bałucińska-Church et al. (2010) Bałucińska-Church, M., Gibiec, A., Jackson, N. K., & Church, M. J. 2010, A&A, 512, A9
- Barnard et al. (2003) Barnard, R., Church, M. J., & Bałucińska-Church, M. 2003, A&A, 405, 237
- Bauer et al. (2004) Bauer, F. E., Alexander, D. M., Brandt, W. N., Schneider, D. P., Treister, E., Hornschemeier, A. E., & Garmire, G. P. 2004, AJ, 128, 2048
- Begelman (2002) Begelman, M. C. 2002, ApJ, 568, L97
- Begelman et al. (2006) Begelman, M. C., King, A. R., & Pringle, J. E. 2006, MNRAS, 370, 399
- Belczynski et al. (2010) Belczynski, K., Bulik, T., Fryer, C. L., Ruiter, A., Valsecchi, F., Vink, J. S., & Hurley, J. R. 2010, ApJ, 714, 1217
- Berghea et al. (2008) Berghea, C. T., Weaver, K. A., Colbert, E. J. M., & Roberts, T. P. 2008, ApJ, 687, 471
- Bertelli et al. (2008) Bertelli, G., Girardi, L., Marigo, P., & Nasi, E. 2008, A&A, 484, 815
- Bertelli et al. (2009) Bertelli, G., Nasi, E., Girardi, L., & Marigo, P. 2009, A&A, 508, 355
- Blackburn (1995) Blackburn, J. K. 1995, in Astronomical Society of the Pacific Conference Series, Vol. 77, Astronomical Data Analysis Software and Systems IV, ed. R. A. Shaw, H. E. Payne, & J. J. E. Hayes, 367
- Bresolin et al. (2009) Bresolin, F., Ryan-Weber, E., Kennicutt, R. C., & Goddard, Q. 2009, ApJ, 695, 580
- Burderi et al. (1998) Burderi, L., King, A. R., & Szuszkiewicz, E. 1998, ApJ, 509, 85
- Caballero-García & Fabian (2010) Caballero-García, M. D., & Fabian, A. C. 2010, MNRAS, 402, 2559
- Cannizzo et al. (1988) Cannizzo, J. K., Shafter, A. W., & Wheeler, J. C. 1988, ApJ, 333, 227
- Cannizzo & Wheeler (1984) Cannizzo, J. K., & Wheeler, J. C. 1984, ApJS, 55, 367
- Cappelluti et al. (2009) Cappelluti, N., et al. 2009, A&A, 497, 635
- Cardelli et al. (1989) Cardelli, J. A., Clayton, G. C., & Mathis, J. S. 1989, ApJ, 345, 245
- Castro-Tirado (2011) Castro-Tirado, A. J. 2011, in IAU Symposium, Vol. 275, IAU Symposium, ed. G. E. Romero, R. A. Sunyaev, & T. Belloni, 270
- Colbert et al. (2004) Colbert, E. J. M., Heckman, T. M., Ptak, A. F., Strickland, D. K., & Weaver, K. A. 2004, ApJ, 602, 231
- Colbert & Mushotzky (1999) Colbert, E. J. M., & Mushotzky, R. F. 1999, ApJ, 519, 89
- Copperwheat et al. (2007) Copperwheat, C., Cropper, M., Soria, R., & Wu, K. 2007, MNRAS, 376, 1407
- Davis (2001) Davis, J. E. 2001, ApJ, 562, 575
- de Jong et al. (1996) de Jong, J. A., van Paradijs, J., & Augusteijn, T. 1996, A&A, 314, 484
- Dewangan et al. (2006) Dewangan, G. C., Titarchuk, L., & Griffiths, R. E. 2006, ApJ, 637, L21
- Dopita et al. (2010) Dopita, M. A., et al. 2010, ApJ, 710, 964
- Dubus et al. (1999) Dubus, G., Lasota, J.-P., Hameury, J.-M., & Charles, P. 1999, MNRAS, 303, 139
- Eggleton (1983) Eggleton, P. P. 1983, ApJ, 268, 368
- Fender et al. (2004) Fender, R. P., Belloni, T. M., & Gallo, E. 2004, MNRAS, 355, 1105
- Feng & Kaaret (2007) Feng, H., & Kaaret, P. 2007, ApJ, 668, 941
- Feng & Kaaret (2008) Feng, H., & Kaaret, P. 2008, ApJ, 675, 1067
- Feng & Soria (2011) Feng, H., & Soria, R. 2011, ArXiv e-prints
- Ferguson et al. (2005) Ferguson, J. W., Alexander, D. R., Allard, F., Barman, T., Bodnarik, J. G., Hauschildt, P. H., Heffner-Wong, A., & Tamanai, A. 2005, ApJ, 623, 585
- Frank, King & Raine (2002) Frank, J., King, A., & Raine, D. J., ed. 2002, Accretion Power in Astrophysics: Third Edition
- Fruscione et al. (2006) Fruscione, A., et al. 2006, in Society of Photo-Optical Instrumentation Engineers (SPIE) Conference Series, Vol. 6270, Society of Photo-Optical Instrumentation Engineers (SPIE) Conference Series
- Gierliński et al. (2008) Gierliński, M., Done, C., & Page, K. 2008, MNRAS, 388, 753
- Gierliński et al. (2009) Gierliński, M., Done, C., & Page, K. 2009, MNRAS, 392, 1106
- Girardi et al. (2010) Girardi, L., et al. 2010, ApJ, 724, 1030
- Gladstone et al. (2009) Gladstone, J. C., Roberts, T. P., & Done, C. 2009, MNRAS, 397, 1836
- Goad et al. (2006) Goad, M. R., Roberts, T. P., Reeves, J. N., & Uttley, P. 2006, MNRAS, 365, 191
- Grisé et al. (2008) Grisé, F., Pakull, M. W., Soria, R., Motch, C., Smith, I. A., Ryder, S. D., & Böttcher, M. 2008, A&A, 486, 151
- Hameury et al. (1986) Hameury, J. M., King, A. R., & Lasota, J. P. 1986, A&A, 162, 71
- Hameury et al. (1987) Hameury, J. M., King, A. R., & Lasota, J. P. 1987, A&A, 171, 140
- Hameury et al. (1988) Hameury, J. M., King, A. R., & Lasota, J. P. 1988, Advances in Space Research, 8, 489
- Hamuy et al. (1992) Hamuy, M., Walker, A. R., Suntzeff, N. B., Gigoux, P., Heathcote, S. R., & Phillips, M. M. 1992, PASP, 104, 533
- Heger et al. (2003) Heger, A., Fryer, C. L., Woosley, S. E., Langer, N., & Hartmann, D. H. 2003, ApJ, 591, 288
- Heil et al. (2009) Heil, L. M., Vaughan, S., & Roberts, T. P. 2009, MNRAS, 397, 1061
- Homan et al. (2007) Homan, J., et al. 2007, ApJ, 656, 420
- Hornschemeier et al. (2001) Hornschemeier, A. E., et al. 2001, ApJ, 554, 742
- Hynes et al. (2002) Hynes, R. I., Haswell, C. A., Chaty, S., Shrader, C. R., & Cui, W. 2002, MNRAS, 331, 169
- Hynes et al. (2005) Hynes, R. I., Robinson, E. L., & Bitner, M. 2005, ApJ, 630, 405
- Idan et al. (2010) Idan, I., Lasota, J.-P., Hameury, J.-M., & Shaviv, G. 2010, A&A, 519, A117
- Immler et al. (1999) Immler, S., Vogler, A., Ehle, M., & Pietsch, W. 1999, A&A, 352, 415
- Irwin et al. (2003) Irwin, J. A., Athey, A. E., & Bregman, J. N. 2003, ApJ, 587, 356
- Irwin et al. (2004) Irwin, J. A., Bregman, J. N., & Athey, A. E. 2004, ApJ, 601, L143
- Janiuk & Czerny (2011) Janiuk, A., & Czerny, B. 2011, MNRAS, 414, 2186
- Jonker & Nelemans (2004) Jonker, P. G., & Nelemans, G. 2004, MNRAS, 354, 355
- Kaaret & Feng (2009) Kaaret, P., & Feng, H. 2009, ApJ, 702, 1679
- Kalberla et al. (2005) Kalberla, P. M. W., Burton, W. B., Hartmann, D., Arnal, E. M., Bajaja, E., Morras, R., & Pöppel, W. G. L. 2005, A&A, 440, 775
- Kaur et al. (2011) Kaur, A., et al. 2011, ArXiv e-prints
- King et al. (2001) King, A. R., Davies, M. B., Ward, M. J., Fabbiano, G., & Elvis, M. 2001, ApJ, 552, L109
- King et al. (1997) King, A. R., Kolb, U., & Szuszkiewicz, E. 1997, ApJ, 488, 89
- King & Pounds (2003) King, A. R., & Pounds, K. A. 2003, MNRAS, 345, 657
- King & Ritter (1998) King, A. R., & Ritter, H. 1998, MNRAS, 293, L42
- Kolmogorov (1941) Kolmogorov, A. 1941, Akademiia Nauk SSSR Doklady, 30, 301
- Kraft et al. (1991) Kraft, R. P., Burrows, D. N., & Nousek, J. A. 1991, ApJ, 374, 344
- Kuntz et al. (2005) Kuntz, K. D., Gruendl, R. A., Chu, Y.-H., Chen, C.-H. R., Still, M., Mukai, K., & Mushotzky, R. F. 2005, ApJ, 620, L31
- Laird et al. (2009) Laird, E. S., et al. 2009, ApJS, 180, 102
- Lasota (2001) Lasota, J.-P. 2001, in Black Holes in Binaries and Galactic Nuclei, ed. L. Kaper, E. P. J. van den Heuvel, & P. A. Woudt, 149
- Liu et al. (2006) Liu, J.-F., Bregman, J. N., & Irwin, J. 2006, ApJ, 642, 171
- Mapelli et al. (2009) Mapelli, M., Colpi, M., & Zampieri, L. 2009, MNRAS, 395, L71
- Marigo et al. (2008) Marigo, P., Girardi, L., Bressan, A., Groenewegen, M. A. T., Silva, L., & Granato, G. L. 2008, A&A, 482, 883
- McClintock & Remillard (2006) McClintock, J. E., & Remillard, R. A. 2006, Black hole binaries, ed. Lewin, W. H. G. & van der Klis, M. 157
- Mineshige & Wheeler (1989) Mineshige, S., & Wheeler, J. C. 1989, ApJ, 343, 241
- Mushotzky (2006) Mushotzky, R. 2006, Advances in Space Research, 38, 2793
- Ohsuga & Mineshige (2011) Ohsuga, K., & Mineshige, S. 2011, ApJ, 736, 2
- Osaki (1996) Osaki, Y. 1996, PASP, 108, 39
- Paczynski (1977) Paczynski, B. 1977, ApJ, 216, 822
- Pakull & Mirioni (2002) Pakull, M. W., & Mirioni, L. 2002, in New Visions of the X-ray Universe in the XMM-Newton and Chandra Era, 26-30 November 2001, ESTEC, The Netherlands, astro-ph/0202488
- Pilyugin et al. (2006) Pilyugin, L. S., Vílchez, J. M., & Thuan, T. X. 2006, MNRAS, 370, 1928
- Poutanen et al. (2007) Poutanen, J., Lipunova, G., Fabrika, S., Butkevich, A. G., & Abolmasov, P. 2007, MNRAS, 377, 1187
- Prestwich et al. (2011) Prestwich, A. H., Chandar, R., Kuraszkiewicz, J., Zezas, A., Tsantaki, M., Foltz, R., Kalogera, V., & Linden, T. 2011, in American Astronomical Society Meeting Abstracts #218, 209.04
- Ptak et al. (2006) Ptak, A., Colbert, E., van der Marel, R. P., Roye, E., Heckman, T., & Towne, B. 2006, ApJS, 166, 154
- Rappaport et al. (2005) Rappaport, S. A., Podsiadlowski, P., & Pfahl, E. 2005, MNRAS, 356, 401
- Roberts (2007) Roberts, T. P. 2007, Ap&SS, 311, 203
- Roberts et al. (2008) Roberts, T. P., Levan, A. J., & Goad, M. R. 2008, MNRAS, 387, 73
- Romaniello et al. (2002) Romaniello, M., Panagia, N., Scuderi, S., & Kirshner, R. P. 2002, AJ, 123, 915
- Ross & Fabian (2007) Ross, R. R., & Fabian, A. C. 2007, MNRAS, 381, 1697
- Saha et al. (2006) Saha, A., Thim, F., Tammann, G. A., Reindl, B., & Sandage, A. 2006, ApJS, 165, 108
- Salasnich et al. (2000) Salasnich, B., Girardi, L., Weiss, A., & Chiosi, C. 2000, A&A, 361, 1023
- Shakura & Sunyaev (1973) Shakura, N. I., & Sunyaev, R. A. 1973, A&A, 24, 337
- Sivakoff et al. (2008) Sivakoff, G. R., et al. 2008, ApJ, 677, L27
- Snow & Witt (1996) Snow, T. P., & Witt, A. N. 1996, ApJ, 468, L65
- Soria (2007) Soria, R. 2007, Ap&SS, 311, 213
- Soria (2011) Soria, R. 2011, Astronomische Nachrichten, 332, 330
- Soria et al. (2009) Soria, R., Risaliti, G., Elvis, M., Fabbiano, G., Bianchi, S., & Kuncic, Z. 2009, ApJ, 695, 1614
- Soria et al. (2000) Soria, R., Wu, K., & Hunstead, R. W. 2000, ApJ, 539, 445
- Stobbart et al. (2006) Stobbart, A.-M., Roberts, T. P., & Wilms, J. 2006, MNRAS, 368, 397
- Strickland et al. (2001) Strickland, D. K., Colbert, E. J. M., Heckman, T. M., Weaver, K. A., Dahlem, M., & Stevens, I. R. 2001, ApJ, 560, 707
- Strickland & Heckman (2007) Strickland, D. K., & Heckman, T. M. 2007, ApJ, 658, 258
- Swartz et al. (2004) Swartz, D. A., Ghosh, K. K., Tennant, A. F., & Wu, K. 2004, ApJS, 154, 519
- Swartz et al. (2011) Swartz, D. A., Soria, R., Tennant, A. F., & Yukita, M. 2011, ApJ, 741, 49
- Tao et al. (2011) Tao, L., Feng, H., Grise, F., & Kaaret, P. 2011, ArXiv e-prints
- Titarchuk (1994) Titarchuk, L. 1994, ApJ, 434, 570
- Trinchieri et al. (1985) Trinchieri, G., Fabbiano, G., & Palumbo, G. G. C. 1985, ApJ, 290, 96
- van Paradijs & McClintock (1994) van Paradijs, J., & McClintock, J. E. 1994, A&A, 290, 133
- Viallet & Hameury (2008) Viallet, M., & Hameury, J.-M. 2008, A&A, 489, 699
- Vrtilek et al. (1990) Vrtilek, S. D., Raymond, J. C., Garcia, M. R., Verbunt, F., Hasinger, G., & Kurster, M. 1990, A&A, 235, 162
- Walter et al. (2008) Walter, F., Brinks, E., de Blok, W. J. G., Bigiel, F., Kennicutt, R. C., Jr., Thornley, M. D., & Leroy, A. 2008, AJ, 136, 2563
- Walton et al. (2011) Walton, D. J., Roberts, T. P., Mateos, S., & Heard, V. 2011, MNRAS, 1147
- Whitehurst (1988) Whitehurst, R. 1988, MNRAS, 233, 529
- Winter et al. (2006) Winter, L. M., Mushotzky, R. F., & Reynolds, C. S. 2006, ApJ, 649, 730
- Zampieri et al. (2011) Zampieri, L., Impiombato, D., Falomo, R., Grisé, F., & Soria, R. 2011, ArXiv e-prints
- Zampieri & Roberts (2009) Zampieri, L., & Roberts, T. P. 2009, MNRAS, 400, 677
| Epoch | Obsid | Instrument | Date | Exposure | FluxaaIn 0.3-10.0 keV. | |
|---|---|---|---|---|---|---|
| (s) | ( erg cm-2 s-1) | ( erg s-1) | ||||
| Swift | ||||||
| 0005605001 | XRT | 2005-01-24 | 8592 | 1.75 | 4.47 | |
| 2 | 0031905002 | XRT | 2011-01-03 | 399 | ||
| 3 | 0031905003 | XRT | 2011-01-04 | 1620 | ||
| 4 | 0031905004 | XRT | 2011-01-07 | 2213 | ||
| 5 | 0031905005 | XRT | 2011-01-11 | 2140 | ||
| 6 | 0031905006 | XRT | 2011-01-23 | 2896 | ||
| 7 | 0031905007 | XRT | 2011-02-04 | 2938 | ||
| 8 | 0031905008 | XRT | 2011-02-16 | 2882 | ||
| 9 | 0031905009 | XRT | 2011-02-28 | 2863 | ||
| 10bbThe Swift exposure covered the first part of the Chandra exposure; the Swift exposure lasted from 12:17:32 to 22:05:56 while the Chandra exposure began at 12:21:40. | 0031905010 | XRT | 2011-03-15 | 2285 | ||
| 11ccThe Swift exposure covered the end of the Chandra exposure; the Swift exposure lasted from 11:20:06 to 21:05:57 while the Chandra exposure ended at 22:18:33. | 0031905011 | XRT | 2011-03-24 | 3258 | ||
| 12 | 0031905012 | XRT | 2011-06-25 | 3240 | ||
| 13 | 0031905013 | XRT | 2011-06-30 | 3146 | ||
| 14dd00:34:45 to 03:54:36 This exposure was coincident with the HST exposures in F336E, F438W, F814W. The HST exposure in F555W occured shortly after the end of the Swift exposure. | 0031905014 | XRT | 2011-07-27 | 3588 | ||
| 15 | 0031905015 | XRT | 2011-08-24 | 951 | ||
| 16eeThe Swift and Chandra exposures were not quite coincident; the Swift exposure lasted from 11:35:00 to 15:13:56 while the Chandra exposure began at 18:41:51. | 0031905016 | XRT | 2011-08-29 | 2706 | ||
| 17 | 0031905017 | XRT | 2001-09-04 | 4048 | ||
| Chandra | ||||||
| 793 | ACIS-S | 2000-04-29 | 50981 | |||
| 2064 | ACIS-S | 2001-09-04 | 9842 | … | … | |
| 1A | 12995 | ACIS-S | 2010-12-23 | 59291 | 120-110 | 360-300 |
| 1B | 13202 | ACIS-S | 2010-12-25 | 98780 | 130-120 | 440-320 |
| 10AbbThe Swift exposure covered the first part of the Chandra exposure; the Swift exposure lasted from 12:17:32 to 22:05:56 while the Chandra exposure began at 12:21:40. | 12993 | ACIS-S | 2011-03-15 | 49398 | 150-150 | 450-530 |
| 10B | 13241 | ACIS-S | 2011-03-18 | 78963 | 160-150 | 530-410 |
| 11AccThe Swift exposure covered the end of the Chandra exposure; the Swift exposure lasted from 11:20:06 to 21:05:57 while the Chandra exposure ended at 22:18:33. | 12994 | ACIS-S | 2011-03-23 | 150058 | 160-150 | 510-420 |
| 11B | 12996 | ACIS-S | 2011-03-29 | 53044 | 150-150 | 530-410 |
| 11C | 13248 | ACIS-S | 2011-04-03 | 54329 | 150-150 | 500-400 |
| 16eeThe Swift and Chandra exposures were not quite coincident; the Swift exposure lasted from 11:35:00 to 15:13:56 while the Chandra exposure began at 18:41:51. | 14332 | ACIS-S | 2011-08-29 | 52381 | 100-100 | 290-290 |
| 18 | 12992 | ACIS-S | 2011-09-05 | 66286 | 100-100 | 320-270 |
| 19 | 14342 | ACIS-S | 2011-12-28 | 67103 | 80-80 | 230-210 |
| XMM-Newton | ||||||
| 0110910201 | MOS1 | 2003-01-27 | 21168ffAfter soft proton flare cleaning. | |||
| MOS2 | 21670 | |||||
| PN | 9668 | |||||
| 0503230101 | MOS1 | 2008-01-16 | 15946 | not in FOV | ||
| MOS2 | 16463 | |||||
| PN | 9490 | not in FOV | ||||
| 0552080101 | MOS1 | 2008-08-16 | 25413 | |||
| MOS2 | 26619 | |||||
| PN | 15706 | |||||
| ROSAT | ||||||
| rh600024a01 | HRI | 1994-07-30 | 24156 | ggThe limiting flux is taken from the limit given by Immler et al. (1999) who combined the two HRI observations for their analysis. The luminosity has been calculated from their flux using the Saha et al. (2006) distance. | ||
| rh600024n00 | HRI | 1993-01-20 | 23529 | … | … | |
| rp600188a02 | PSPC | 1993-01-11 | 23350 | …hhThe angular resolution was insufficient to separate the ULX from the nuclear emission. However, it should be noted that while in the ULX state, our source has a flux comparable to that of the nucleus, and thus would produce a roughly east-west elongation of the nuclear source. This elongation is not seen for this observation, suggesting that the source was not in an ultraluminous state. | … | |
| ASCA | ||||||
| 61016000 | SIS | 1994-02-12 | 40186 | …hhThe angular resolution was insufficient to separate the ULX from the nuclear emission. However, it should be noted that while in the ULX state, our source has a flux comparable to that of the nucleus, and thus would produce a roughly east-west elongation of the nuclear source. This elongation is not seen for this observation, suggesting that the source was not in an ultraluminous state. | … | |
| Einstein | ||||||
| I1334S29.XIA | IPC | 1979-07-31 | 5708 | …hhThe angular resolution was insufficient to separate the ULX from the nuclear emission. However, it should be noted that while in the ULX state, our source has a flux comparable to that of the nucleus, and thus would produce a roughly east-west elongation of the nuclear source. This elongation is not seen for this observation, suggesting that the source was not in an ultraluminous state. | … | |
| H1334S29.XIA | HRI | 1980-01-15 | 20002 | iiThe limiting flux is taken from the analysis of Trinchieri et al. (1985) who combined the two HRI observations before analysis. We have used the smallest detected flux from a point-like source in that study for our limit. The luminosity has been calculated from their flux using the Saha et al. (2006) distance. Visual inspection of the images reveal no source at the location of the ULX in either image. | ||
| H1334S29.XIB | HRI | 1981-02-13 | 24574 | … | … | |
| Parameter | Value | |||||||||
|---|---|---|---|---|---|---|---|---|---|---|
| 12995 | 13202 | 12993 | 13241 | 12994 | 12996 | 13248 | 14332 | 12992 | 14342 | |
| Date | 23 Dec | 25 Dec | 15 Mar | 18 Mar | 23 Mar | 29 Mar | 03 Apr | 29 Aug | 04 Sep | 28 Dec |
| PSFfrac | ||||||||||
| ( cm-2) | ||||||||||
| ( phot keV-1 s-1)bbAt 1 keV. | ||||||||||
| (keV)cc where is the apparent inner-disk radius and the viewing angle. | … | … | ||||||||
| … | … | |||||||||
| /dof | ||||||||||
| 250.1 | 275.3 | 221.2 | 296.9 | 316.4 | 244.6 | 232.2 | 151.2 | 195.8 | 148.6 | |
| dof | 217 | 278 | 236 | 284 | 310 | 212 | 211 | 164 | 209 | 187 |
| (10-1 cnt s-1)dedefootnotemark: | ||||||||||
| ( erg cm-2 s-1)efeffootnotemark: | ||||||||||
| ( erg s-1)efeffootnotemark: | ||||||||||
| ggFraction of unabsorbed X-ray luminosity in the diskbb component. | … | … | ||||||||
| Parameter | Value | |||||||||
|---|---|---|---|---|---|---|---|---|---|---|
| 12995 | 13202 | 12993 | 13241 | 12994 | 12996 | 13248 | 14332 | 12992 | 14342 | |
| Date | 23 Dec | 25 Dec | 15 Mar | 18 Mar | 23 Mar | 29 Mar | 03 Apr | 29 Aug | 04 Sep | 28 Dec |
| PSFfrac | ||||||||||
| ( cm-2) | ||||||||||
| (keV)bbSeed photon temperature. | ||||||||||
| (keV)ccPlasma temperature. | ||||||||||
| ddBefore pile-up correction. | ||||||||||
| eeIn 0.3-10.0 keV. | ffAfter pile-up correction. | |||||||||
| /dof | ||||||||||
| 239.2 | 263.5 | 229.5 | 294.5 | 325.2 | 242.7 | 231.3 | 151.4 | 194.8 | 151.1 | |
| dof | 217 | 278 | 236 | 284 | 310 | 212 | 211 | 162 | 209 | 187 |
| ( cnt s-1)ghghfootnotemark: | ||||||||||
| (erg cm-2 s-1)hihifootnotemark: | ||||||||||
| ( erg s-1)hjhjfootnotemark: | ||||||||||
| Parameter | Value | |||||||||
|---|---|---|---|---|---|---|---|---|---|---|
| 12995 | 13202 | 12993 | 13241 | 12994 | 12996 | 13248 | 14332 | 12992 | 14342 | |
| 114.58 | 151.62 | 108.22 | 195.85 | 194.40 | 117.19 | 109.25 | 56.4 | 86.6 | 66.1 | |
| dof | 108 | 168 | 128 | 175 | 201 | 104 | 104 | 62 | 103 | 82 |
| NAaaBroken power-law models with the constraint that do not provide any improvement to the value. | NA | NA | NA | NA | NA | NA | NA | |||
| (keV) | NA | NA | NA | NA | NA | NA | NA | NA | ||
| NA | NA | NA | NA | NA | NA | NA | NA | |||
| NA | NA | NA | NA | NA | NA | NA | NA | |||
| 111.92 | 146.74 | NA | NA | NA | NA | NA | NA | NA | NA | |
| dof | 106 | 166 | NA | NA | NA | NA | NA | NA | NA | NA |
| F test | NA | NA | NA | NA | NA | NA | NA | NA | ||
| Date | Telescope | Instrument | Exposure | Filter | MagnitudeaaAll magnitudes are observed AB magnitudes at the central wavelength. For WFC3, these use the nominal WFC3 zero points given at http://www.stsci.edu/hst/wfc3/phot_zp_lbn. | A()bbAssuming and using reddening corrections from Romaniello et al. (2002) for the HST filters and from Cardelli et al. (1989) at the central wavelengths for the Gemini filters. | Unabsorbed | ||
|---|---|---|---|---|---|---|---|---|---|
| (s) | Band | (Å) | (Å) | (mag) | Flux (Jy)ccValues obtained from the 2009 HST observations correspond to the excess flux at the location of the ULX and are upper limits to the flux of the pre-outburst donor star. | ||||
| 2009 Apr 26 | Magellan I | IMACS | [O III] | 5007 | 50 | ||||
| 2009 Apr 26 | Magellan I | IMACS | Green Cont’m | 5316 | 161 | ||||
| 2009 Apr 26 | Magellan I | IMACS | Red Cont’m | 6815 | 216 | ||||
| 2009 Aug 9 | HST | WFC3 | U (F336W) | 3355 | 511 | ccValues obtained from the 2009 HST observations correspond to the excess flux at the location of the ULX and are upper limits to the flux of the pre-outburst donor star. | 0.48 | ||
| 2009 Aug 9 | HST | WFC3 | B (F438W) | 4326 | 618 | ccValues obtained from the 2009 HST observations correspond to the excess flux at the location of the ULX and are upper limits to the flux of the pre-outburst donor star. | 0.40 | ||
| 2009 Aug 9 | HST | WFC3 | V (F555W) | 5308 | 1562 | ccValues obtained from the 2009 HST observations correspond to the excess flux at the location of the ULX and are upper limits to the flux of the pre-outburst donor star. | 0.30 | ||
| 2009 Aug 9 | HST | WFC3 | I (F814W) | 8030 | 1536 | ccValues obtained from the 2009 HST observations correspond to the excess flux at the location of the ULX and are upper limits to the flux of the pre-outburst donor star. | 0.18 | ||
| 2011 Apr 8 | Gemini-S | GMOS | 3650 | 490 | 0.47 | ||||
| 2011 Apr 8 | Gemini-S | GMOS | 4780 | 1540 | 0.35 | ||||
| 2011 Apr 8 | Gemini-S | GMOS | 6340 | 1440 | 0.25 | ||||
| 2011 July 27 | HST | WFC3 | U (F336W) | 3355 | 511 | 0.48 | |||
| 2011 July 27 | HST | WFC3 | B (F438W) | 4326 | 618 | 0.40 | |||
| 2011 July 27 | HST | WFC3 | V (F555W) | 5308 | 1562 | 0.30 | |||
| 2011 July 27 | HST | WFC3 | I (F814W) | 8030 | 1536 | 0.18 | |||