The low frequency of dual AGNs versus the high merger rate of galaxies: A phenomenological model
Abstract
Dual AGNs are natural byproducts of hierarchical mergers of galaxies in the CDM cosmogony. Recent observations have shown that only a small fraction () of AGNs at redshift are dual with kpc-scale separations, which is rather low compared to the high merger rate of galaxies. Here we construct a phenomenological model to estimate the number density of dual AGNs and its evolution according to the observationally-estimated major merger rates of galaxies and various scaling relations on the properties of galaxies and their central massive black holes. We show that our model reproduces the observed frequency and separation distribution of dual AGNs provided that significant nuclear activities are triggered only in gas-rich progenitor galaxies with central massive black holes and only when the nuclei of these galaxies are roughly within the half-light radii of their companion galaxies. Under these constraints, the observed low dual AGN frequency is consistent with the relatively high merger rate of galaxies and supports the hypothesis that major mergers lead to AGN/QSO activities. We also predict that the number of kpc-scale dual AGNs decreases with increasing redshift and only about 0.02%–0.06% of AGNs are dual AGNs with double-peaked narrow line features at redshifts of . Future observations of high-redshift dual AGNs would provide a solid test for this prediction.
Subject headings:
black hole physics-galaxies: active-galaxies: interactions-galaxies: nuclei-galaxies: Seyferts-quasars: general1. Introduction
Merger of galaxies is one of the major processes of galaxy formation in the hierarchical CDM cosmogony. Galaxy mergers can naturally lead to the formation of paired and binary massive black holes (MBHs), since most galaxies, especially those with spheroidal components, host MBHs at their centers (e.g., Begelman et al., 1980; Yu, 2002). If both of the merging galaxies are gas rich, a large amount of gas can be channeled to the central region of each merging galaxy, as indicated by numerical simulations (e.g., Hernquist, 1989). A dual AGN (dAGN) could then emerge if the accretion onto both MBHs is triggered during the merging process. Thus the existence of dAGNs in the universe and their demography provide an important probe not only of the hierarchical galaxy formation models but also of the triggering mechanisms of nuclear activities and the assembly history of MBHs.
In the past decade, substantial progress has been made in searching for dAGNs and binary MBHs (BBHs) through various possible signatures, such as double-peaked broad lines (e.g., Boroson & Lauer, 2009), double-peaked narrow lines (e.g., Zhou et al., 2004; Gerke et al., 2007; Comerford et al., 2009a, b; Xu & Komossa, 2009; Wang et al., 2009; Smith et al., 2010; Liu et al., 2010a, b; Shen et al., 2010; Fu et al., 2010; Rosario et al., 2011) and various other methods (e.g., Komossa et al., 2003; Valtonen, 2008; Green et al., 2010). Following a systematic scrutiny of the NIR images and optical slit spectra of a sample of double-peaked narrow line type 2 AGNs, it has recently been reported that roughly 0.5%-2.5% of the type 2 AGNs are kpc-scale dAGNs after taking into account the selection completeness (Liu et al., 2010a, b; Shen et al., 2010, see also Rosario et al. 2011). This frequency is surprisingly low even if we were to assume that all these observations are indeed of dAGNs and not as has been otherwise suggested of superposed single AGNs, bipolar jets and accretion disks. The observed frequency of dAGN is indeed more than an order of magnitude lower than that expected from the observed major merger rate of galaxies if one makes the assumption that each major merger would yield a dAGN (Rosario et al., 2011, see also Shen et al. 2010). The low frequency of dAGNs, unlikely due to selection effect (Rosario et al., 2011), seems generally at odds with the commonly accepted scenario that AGN/QSO activities are triggered by major mergers of galaxies.
In this paper, we construct a phenomenological model to address the observed frequency of kpc-scale dAGNs, by taking into account the following factors: (1) the merger rate of galaxies; (2) the types of galaxy mergers that can trigger the nuclear activities of both progenitors; (3) when and where significant nuclear activities are triggered (by “significant” nuclear activities we mean that the Eddington ratios of the nuclear luminosities are close to 1 (e.g., 0.1–1), rather than or less); and (4) how long the nuclear activities of both progenitors can last before the merger of the two MBHs. After the merger of two MBHs, the nucleus of the merged galaxy is likely to still be active, but it only appears as a single AGN. In Section 2, we show how these factors are adopted in our model of the dAGN distribution. Under the assumption that significant nuclear activities can be triggered only in gas-rich progenitor galaxies with central MBHs when their companion galaxies are sufficiently close to them, the dAGN frequency and their separation distribution are obtained in Section 3. By comparison with observations, we show that the observational frequency of dAGNs is consistent with current observational constraints on the merger rates of galaxies and the scenario that major mergers of galaxies lead to significant nuclear activities. In Section 3, we also present our model predictions for the dAGN distribution at higher redshifts. We further discuss the uncertainties in our estimates of the dAGN frequency due to different processes, which are not included in our model, such as mergers of progenitor galaxies whose nuclei have already been activated in previous mergers and also tidally-induced nuclear activities in two galaxies which are still far away from each other. Conclusions are given in Section 4.
2. A phenomenological model of dual AGNs
In this section, we introduce a phenomenological model to estimate the frequency of dAGNs, by taking into account the factors mentioned in Section 1. The crucial elements of this model are described as follows.
2.1. Merger rates of galaxies
For galaxies with stellar mass , we describe their merger rate at a given time by the number fraction of those galaxies for which a galaxy merger completed per unit time, and denote the merger rate by
| (1) |
where is the cosmic time at redshift , () represents the mass ratio of two merging galaxies, is the comoving number density of galaxies with stellar mass at redshift , and gives the comoving number density of those galaxies that are products of mergers of two progenitor galaxies with mass ratio and with their mergers being completed over a cosmic time from to .
In the past several years, tremendous efforts have been made in estimating the merger rate of galaxies either through close pairs of galaxies (e.g., Kartaltepe et al., 2007; Lin et al., 2004, 2008; de Propris et al., 2005; Bell et al., 2006a, b; Bundy et al., 2009; López-Sanjuan et al., 2009; de Ravel et al., 2009; Patton et al., 2011) or through morphological disturbances of galaxies found in various deep surveys (e.g., Cassata et al., 2005; Bundy et al., 2005; Wolf et al., 2005; Bridge et al., 2007, 2010; Lotz et al., 2008; Conselice et al., 2008, 2009). The dependence of the merger rate on mass ratio can be absorbed in a function , which describes the fraction of mergers with mass ratio larger than , i.e.,
| (2) |
For major mergers (usually defined by ), observational estimates can be roughly fitted by the simple formula, where and (Hopkins et al., 2010). The normalization of the merger rate is uncertain by a factor of about due to systematic errors and the uncertainty in the evolution slope is . The dependence of the merger rates on mass ratio can be approximated by (Stewart et al., 2009; Hopkins et al., 2010).
The stellar mass function of galaxies, involved in equation (1), has been estimated over a large redshift range from various galaxy redshift surveys. In our Monte-Carlo calculations below, we adopt the latest stellar mass function obtained from the S-COSMOS survey (Spitzer-Cosmic Evolution Survey) for galaxies at redshift ranges , , , , and (Ilbert et al., 2010), and that obtained from the Sloan Digital Sky Survey (SDSS) for galaxies in the local universe () (Bernardi et al., 2010), respectively. According to equation (1) and the stellar mass functions, our simulations generate a large number of merging pairs of galaxies over redshift to . The masses of the two progenitors are assigned by and , respectively, where is randomly selected according to its distribution function .111 Note that a substantial number of stars may be formed in the merging systems during the merging process. We have checked that if a fraction (e.g., ) of the total stellar mass is removed in order to get the real total stellar mass of the two progenitor galaxies before doing the splitting procedure above, a slightly lower estimate of the dAGN frequency may be obtained, but which does not affect our conclusions in Section 4.
2.2. Triggering of nuclear activity and mergers of galaxy pairs with various morphologies
During the merging process of two galaxies, whether significant nuclear activities at their centers can be triggered depend on the two factors: (1) whether MBHs are initially hosted in both nuclei or whether the MBHs are massive enough; and (2) whether sufficient gaseous materials can be quickly delivered into the vicinity of the MBHs. Those two factors are closely related to the progenitor morphologies of the merging pairs.
2.2.1 The mass of the initial MBHs
Observations have shown that the masses of MBHs, , in the centers of nearby galaxies are tightly correlated with the stellar mass of the spheroidal components of the galaxies (Haring & Rix, 2004)
| (3) |
with an intrinsic scatter of dex in . Subsequently, given the stellar mass of the spheroidal component of each progenitor of a merging pair, we use equation (3) to estimate the central BH mass () in the progenitor at redshift , by assuming that the scatter of the correlation follows a normal distribution and adopting a small evolution correction of (e.g., Merloni et al., 2010).
Note that the following elements are involved to estimate the distribution of :
(a) The bulge to total stellar mass ratio (B/T): given the stellar mass of a galaxy, the mass can be estimated according to the morphology of the galaxy, as the B/T ratios are different for galaxies with different morphologies (Weinziri et al., 2009). Based on the detailed analysis of a sample of nearby galaxies, it has been found that and with variances of and for Sa-Sb and Sc-Sd, respectively (Weinziri et al., 2009). We assume that for elliptical and S0 galaxies and for irregular galaxies, respectively.
(b) Distribution of morphological combinations of merging galaxy pairs: it is possible that the two progenitors of a merging galaxy pair have different morphologies. Currently detailed statistics on the morphological combinations of the pairs are not available, although there are quite a number of constraints on the merger rates of red galaxies, blue galaxies and mixed ones (e.g., Lin et al., 2004, 2008). Here we simply assume that the morphological types of the two progenitors are independent of each other, and consequently the fraction of the merger rates of the pairs with any specific morphological combination to the total merger rates only depends on the fraction of these types to the total number of galaxies. This assumption appears consistent with the current observations that the fractions of different morphological types for galaxies in pairs are similar to those for field galaxies (de Propris et al., 2005).
(c) Stellar mass functions of galaxies with different morphological types: the galaxy luminosity function (LF) for four spectral types of galaxies over was previously estimated (see Table 3 of Zucca et al. 2006). These four spectral types roughly correspond to the morphological types E/S0, Sa-Sb, Sc-Sd and Irr, respectively. For each type of galaxies, the mass-to-light ratio can be estimated through their average colors (e.g., B-V, see Bell et al., 2003; Bernardi et al., 2010; Fukugita et al., 1995), and their LFs (Zucca et al., 2006) can thus be converted to the stellar mass functions. According to these mass functions, the fraction of each type of galaxies to the total galaxies can be obtained at any given over . For galaxies at redshifts , we adopt the stellar mass functions for different morphological types given by Bernardi et al. (2010, see their Table B2) and estimate the fraction of each type to the total at any given . In our calculations below, for each merger generated as that described in Section 2.1, we randomly set the morphological type to each progenitor according to the fractions of each type of galaxies to the total at and , respectively.
2.2.2 Triggering of the nuclear activity
During the merger of late-type gas-rich galaxies (Sa-Sb, Sc-Sd, or Irr) with other galaxies, significant nuclear activities may be triggered rapidly. The reason lies in the fact that late-type galaxies contain significant amount of gaseous materials which could lose angular momentum and sink under dynamical friction during the galaxy merger. Early-type gas-poor (red/elliptical) galaxies may be able to capture some gas from gas-rich encounters during the merging process, but the time for the gas to reach the center is likely to be comparable to the merging timescale (see Section 2.3). Therefore, the nuclear activities in these galaxies may start only after the mergers have almost completed. In addition, the host galaxies of all the confirmed dAGNs selected through double-peaked narrow lines contain stellar disks (Shen et al., 2010), which would suggest that they are merging remnants of late-type galaxies.
Based on the above arguments, we assume that the nuclear activity is triggered in each gas-rich component with a central MBH once its separation with its companion becomes smaller than a threshold . On the other hand, we assume that the nuclear activity cannot be triggered in any gas-poor component of a merging pair prior to the completion of the merger (see also discussions in Section 3). The physical size of a galaxy is characterized by its half-light (or effective) radius . Once the separation of the component (1 or 2) of a pair to the other component (2 or 1) is smaller than the half-light radius of component (i.e., ), the center of component may be significantly perturbed. Here we assume the threshold for component to be , where is a fudge factor of order unity. For major mergers, nuclear activities can be triggered in both components only if both components are gas-rich and their separation , where and are the half-light radii of the primary and the secondary galaxy of the pair, respectively.
For disk galaxies, we adopt the following empirical relation to estimate the disk half-light radius from the stellar mass, which is obtained from a SDSS sample at low redshift (Dutton et al., 2011)
| (4) |
where , , , and . The scatter of this relation at a given is assumed to follow the log-normal distribution with a standard deviation of , where , , and . For disk galaxies at higher redshifts, for example , we add an evolution correction to the zero point of the disk-size—stellar mass relation by (Dutton et al., 2011).
For early-type galaxies, the half-light size versus stellar mass relation can also be fitted by equation (4), but with , , , , and (Dutton et al., 2010). This double power-law form is consistent with the single power-law form at high masses given by van der Wel et al. (2008) and Shen et al. (2003). The intrinsic scatter of this relation at high masses is dex (van der Wel et al., 2008). We assume the scatter is also dex at low masses (). For early-type galaxies at higher redshifts, for example , we add an evolution correction to the zero point of this relation as (van der Wel et al., 2008).
2.3. Evolution of the separation of two merging galaxies
The merging timescale of paired galaxies is crucial in determining the time period during which the merging system would appear as dAGNs. Based on virtual galaxy catalogues obtained from the Millennium Simulation, it has been found that the average merging time of paired galaxies can be fitted by
| (5) | |||||
where is the projected separation of the pairs (Kitzbichler & White, 2008). This result is about larger than that obtained from higher resolution simulations of galaxy mergers Lotz et al. (2010). Correcting this difference and assuming that the orientations of galaxy pairs are isotropically distributed, the merging time as a function of three-dimensional separation is smaller than that given by equation (5) for a projected separation by about a factor of , i.e.,
| (6) |
The period that a merging system may appear as a double-peaked narrow line dAGN varies from to , where is the lower limit of the separation that the narrow line regions associated with the two nuclei begin to overlap and the line profile becomes more complicated, and is the time elapsed since the activities of both the nuclei were triggered. Here we set since the typical size of narrow line regions of AGNs is about a few tens to a few hundreds of parsecs (Peterson, 1997).
2.4. Luminosity evolution of nuclear activities
Once the nuclear activity is triggered in the center of a merging component, the material available for accretion initially is expected to be abundant. The situation of these merging systems may be similar to that of high luminosity QSOs, which also have plentiful gas supplies and accrete at relatively high rates. The Eddington accretion rate is , where is the mass-to-light conversion efficiency (e.g., Yu & Tremaine, 2002; Yu & Lu, 2008). Here we assume that the accretion rate is for the MBH in each component of a merging pair after its nuclear activity has been triggered, and we set (e.g., as shown in Kollmeier et al. 2006; Shen et al. 2008) unless otherwise stated. Thus the MBH should grow exponentially with the elapsed time as , where the Salpeter timescale is about . We assume that the accretion switches off if the total mass of the two MBHs is larger than the expectation from equation (3) for the final merged galaxy, taking into account the scatter in the relation.222 Even if these BHs can still accrete some material via lower Eddington ratios, e.g., , our simulation results are not affected much. The bolometric luminosity is , where . For the purpose of this paper, we need calculate the [OIII] luminosity, which can be converted from the bolometric luminosity by with a scatter of dex (assumed to have a log-normal distribution) (Heckman et al., 2004).
2.5. Velocity separation
In recent systematic searches, double-peaked narrow lines have been adopted as the indicator to search for dAGNs from parent SDSS AGN samples (Shen et al., 2010). In this search the dAGNs with velocity separation or cannot be detected. The velocity dispersions of the primary and the secondary progenitor galaxies (or their bulges) of the pair, and respectively, characterize the widths of the two narrow line components. In order to extract the dAGN frequency from these searches, it is necessary to estimate , and of the two merging components.
As both components of a pair move in their common dark matter halo with a velocity of the order of the circular velocity of the halo (i.e., the merged galaxy), we first assume that the relative velocity of the two components and later discuss the consequences of this assumption in Section 3. It is plausible to assume that the orbital orientation of the two merging components and their relative position on the orbital plane are isotropically distributed. Subsequently the velocity separation of the two components of the double-peaked lines, i.e., the relative velocity component projected onto the line of sight, as well as their projected separation perpendicular to the line of sight, can be taken into account for each pair through Monte-Carlo simulations. For early-type galaxies, can be estimated from (Dutton et al., 2010). The velocity dispersion of the merger result which is supposed to be an elliptical, can be estimated from stellar mass by the following empirical relation
| (7) |
for nearby SDSS galaxies which has an intrinsic scatter of roughly dex (Gallazzi et al., 2006). For galaxies at higher redshifts, we add an evolution correction to the above relation by interpolating its measured deviations to higher redshifts (Dutton et al., 2011, see their Table 3). For a late-type galaxy, the velocity dispersion of its bulge (if any) can also be estimated from equation (7) after replacing there by , as bulges appear to follow the same Faber-Jackson relation as faint ellipticals (Balcells et al., 2007).
2.6. Monte-Carlo simulations of dAGNs
We summarize the procedures to generate dAGNs in our Monte-Carlo simulations as follows.
-
•
We generate major mergers of galaxies which are completed during the cosmic time to , where , and for and , respectively, and . The detailed completion time of a major merger is selected according to the major merger rates and the stellar mass function given in Section 2.1. For each merger, the total stellar mass () of the system is split into the stellar masses of its two progenitor galaxies and .
-
•
For each merging system, we assign morphological types to the two progenitor galaxies and then estimate their bulge masses and the masses of their central MBHs, as described in Section 2.2.1.
-
•
For each progenitor galaxy of the system, the half-light radius is estimated as described in Section 2.2.2, and their separation threshold for triggering nuclear activities is correspondingly set to each component, i.e., ( and ), where is assumed to be the same for the two components of the major merger and is calibrated by the separation distribution of observed dAGNs (see Section 3).
-
•
We start from the completion time of each major merger and trace back the evolution of the separation of its progenitor galaxies from zero to the values at earlier time, as described in Section 2.3. (Note that our analyses for kpc-scale dAGNs here are not affected by our extrapolation of equation (6) to pc scales and by our simplification of detailed evolution timescales of massive bound binary black holes on these small scales.) Assuming that all merging systems which complete their mergers within the cosmic time to are located at the distance of redshift , then these systems should appear in observations at a time of before the completion of the mergers, where is the cosmic time at which each major merger is completed. For any merger, if , the nuclear activity in component has been triggered, and the time elapse since the triggering of the activity is given by .
-
•
The luminosity is assigned to each active component as described in Section 2.4.
- •
In order to compare with the results given by systematic surveys by using double-peaked narrow lines (e.g., Shen et al., 2010; Rosario et al., 2011), we only count the number of those simulated dAGNs with two components having a separation within the range from to and comparable luminosities, i.e., the luminosity ratio of the two components is within a factor of 4 here. And we then calculate their luminosity function and projected separation distribution, etc., as illustrated in the following section.
3. Model results and discussions
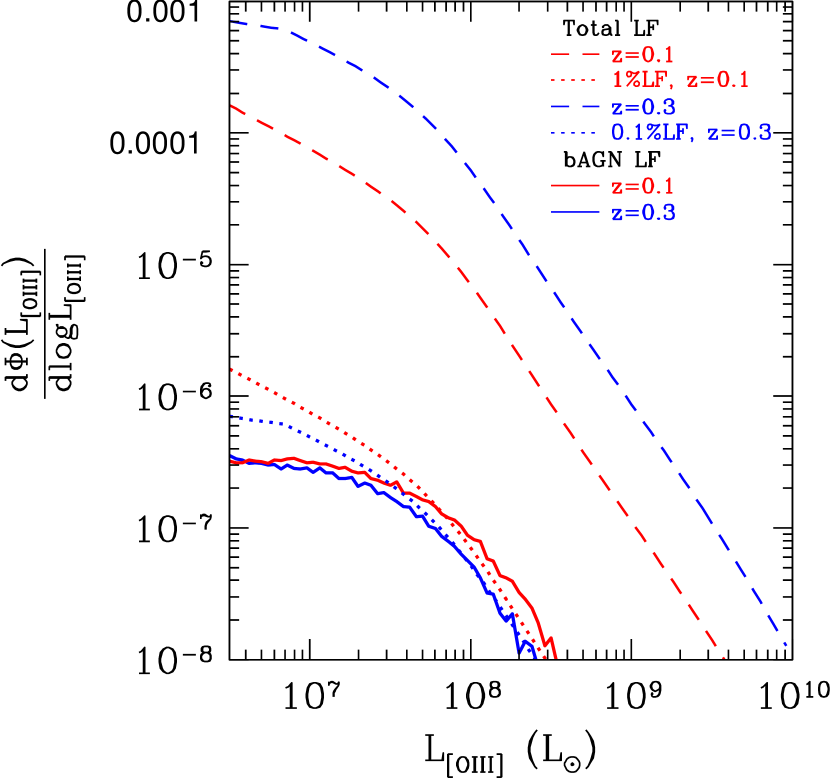
Figure 1 shows the [OIII] LF of the bright components of the simulated dAGNs that could be selected through double-peaked narrow lines (solid and long-dashed lines) at redshifts and , respectively. These simulated dAGNs are selected through similar thresholds as that in Shen et al. (2010) for double-peaked narrow line dAGNs (see Section 2.5). And the threshold on the separation for the nuclear activity to be triggered, , is set to have (which is the reference value, see also Figure 2), where represent the two components of a merging pair and . Note that the LF of the faint components of dAGNs is only slightly smaller than that for the bright components. The observed [OIII] LFs for all AGNs, including the [OIII] LFs of the type 1 AGNs and type 2 AGNs adopted from Bongiorno et al. (2010), are also shown in Figure 1. Apparently, the LF of the bright components of dAGNs is smaller than that for all AGNs by a factor of about to . Note that the bright component of an observed dAGN may be hosted in the small progenitor galaxy (Shen et al., 2010); and our model shows that about of simulated dAGNs have their bright components being hosted in the progenitors with relatively low total stellar masses, consistent with current observations. Here we do not try to simultaneously fit the total AGN LF, as both the detailed luminosity evolution of nuclear activities in the post-merger stages and other mechanisms leading to nuclear activities would be important in such a fit but beyond the scope of this paper.
The accuracy of our estimates of the dAGN LFs depends on the uncertainties in (1) the merger rate , (2) the merger timescale , (3) the setting of the separation threshold , (4) the setting of the accretion rate , and (5) the approximation of the relative velocity. We discuss each of the points below.
-
•
The systematic error of the merger rates, estimated from observations, could affect our estimate by a factor of . This error partly reflects the uncertainty in the merger timescale (Hopkins et al., 2010). The minor mergers of galaxies, not included in our calculation, might also contribute to dAGNs. However, the rate of minor mergers with mass ratio is almost the same as the rate of major mergers (Hopkins et al., 2010). The contribution by these minor mergers should not be larger than a few tenth of the contribution by the major merger of galaxies (with ), as the two merger components differ substantially in stellar mass and are less likely to contribute to AGN pairs with two comparably bright components. Therefore, the total error introduced by the uncertainties in and is roughly a factor of .
-
•
The uncertainty in the settings of the separation threshold may be calibrated by the observational separation distribution of dAGNs. Figure 2 shows the cumulative distribution of the number of dAGNs versus the projected separation of its two components for both observed dAGNs and simulated dAGNs. As seen from Figure 2(a), the simulated distribution matches well the observational one if is set to .333 We caution here that the total number of dAGNs in Shen et al. (2010) sample is only 5, and the separation distribution of these dAGNs shown in Figure 2 suffers from small number statistics. Future observations which promise to find more dAGNs would provide firmer constraints on and would yield better statistics. After adding the dAGN candidate found by Comerford et al. (2009b) and the two dAGNs—major merger systems recently found by Rosario et al. (2011) to the dAGN sample, the dAGN distribution appears to be still consistent with . We choose as the reference value in this paper. A much larger or smaller (e.g, or ) appears not to be consistent with the observationally-deduced distribution of projected separations (see also the discussion on tidal interactions below). According to equation (5), the uncertainties in the settings of may lead to an error of about in the simulated LFs of the bright (or relatively faint) components of dAGNs. Figure 2(b) shows the evolution of the dAGN separation distribution. The dAGNs at higher redshifts appear to have smaller separations, which is mainly due to the size evolution of galaxies set in the model.
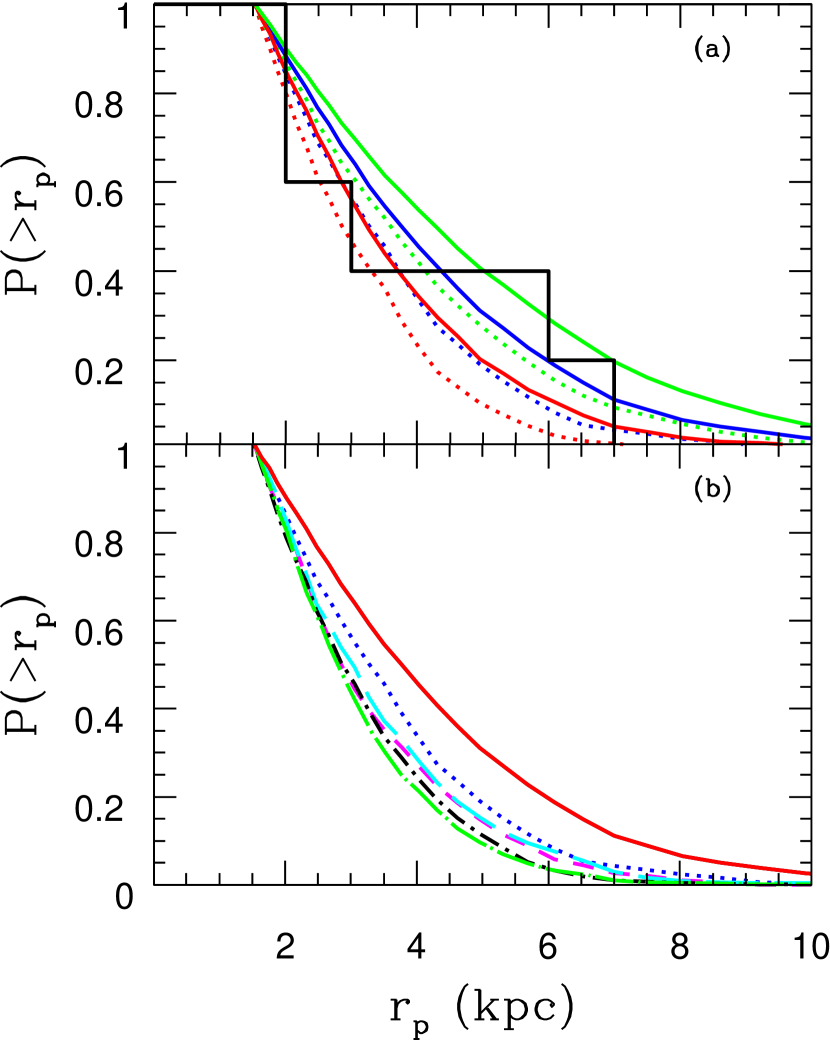
Figure 2.— The cumulative distribution of projected separation of dAGNs. The histogram shows the observational results obtained by Shen et al. (2010). The simulated dAGN sample is selected by the luminosity of the bright component with , as is set for the lowest luminosity threshold of the observed dAGNs. The simulated separation distribution is normalized to , as is done for the observational distribution (Shen et al., 2010). Panel (a) shows the results of our simulations at redshifts (solid lines) and (dotted lines), respectively. The separation threshold for triggering nuclear activities, i.e., ( and for the two merging components) is set to (red lines), (blue lines) and (green lines). Panel (b) shows the evolution of the distribution of the projected separations for the case of . The red solid, blue dotted, magenta dashed, cyan long-dashed, black dot-short-dashed, and green dot-long-dashed lines represent the results of our simulations at redshifts , , , , , and , respectively. 
Figure 3.— The expected dAGN frequency at different redshifts, i.e., the ratio of the number density of simulated dAGNs to the number density of AGNs derived from the observational AGN LF. Open circles and squares represent the cases for the bright components of dAGNs and AGNs with luminosities and , respectively. The dAGNs are selected through the double-peaked narrow lines in our Monte Carlo simulations described in Section 3. In this figure, the separation threshold for triggering nuclear activities is set to have . The typical error on the estimated dAGN frequency is dex (see discussions in Section 3). The total [OIII] LFs of AGNs at different redshift are adopted from Bongiorno et al. (2010). The dotted and solid crosses are the current observational constraints obtained with and without completeness correction, respectively. See details in Section 3. -
•
The accretion rates of dAGNs are set to have times the Eddington rate, similar to those in observed bright QSOs (see Section 2.4). If is set to be , the LFs of the simulated dAGNs move downward by a factor of at ; and if , the LFs of the simulated dAGNs increase by more than a factor of 10 at but stays the same and then decreases slightly as decreases to less than .
-
•
The relative velocity of the two components of any merging pair is set to be twice the circular velocity of their common dark matter halo. This may be an overestimate of as the primary component may move at a lower speed than the circular velocity. However, it is hard to address the uncertainty in the dAGN LF caused by this assumption. In order to get a sense of this uncertainty, here we simply assume a case of or and find that it could lead to a decrease of the dAGN LFs by about a factor of 1.4 or 2.
Combining all these uncertainties together, the total systematic uncertainty in the LFs of the bright components of dAGNs is likely to be a factor of over the luminosity range .
Figure 3 shows the evolution of the dAGN frequency, i.e., the ratio of the number density of simulated dAGNs selected through the double-peaked narrow line features to the number density of AGNs derived from the observational total AGN LF (Bongiorno et al., 2010). Here we do not distinguish between type 1 and type 2 AGNs, but include both. This ratio is equal to the ratio of the cumulative LF of dAGNs to that of AGNs, and depends weakly on the lower limit of the AGN luminosities. These estimates could be off by a factor of as previously discussed. At redshift , the estimated dAGN frequency is . (This value could be higher than the estimates from observed dAGNs selected through the double-peaked narrow lines, considering that the signal-to-noise of some dAGN spectra are so low that the dAGNs are not detected observationally.) There are quite a number of dAGNs which cannot be detected by using double-peaked narrow lines, due to the projection effect and the velocity cutoff. Including the undetected dAGNs, our model suggests that the real frequency of dAGNs is , larger than that of those dAGNs selected through the double-peaked narrow line features by a factor of . These values are fully consistent with the observational estimates obtained by Shen et al. (2010), i.e., without completeness correction or after the correction of in-completeness due to the projection effect, velocity cutoff and low signal-to-noise spectra of some dAGNs (see also Rosario et al. 2011, in which the dAGN frequency is without the completeness correction).
The reasons that a lower frequency of dAGNs is obtained from our model (compared to the simple estimates; e.g., by Rosario et al. 2011) are three folds: (1) dAGNs can be produced only if both of the two progenitor galaxies are gas rich so that sufficient accretion materials could be provided; (2) MBHs in those gas-rich progenitor galaxies may be initially substantially smaller than their final masses, and thus the AGN phenomena triggered before MBH mergers may be substantially less luminous compared with those triggered after MBH mergers; and (3) in a significant fraction of major mergers, the masses of the MBHs hosted in the two progenitor galaxies may differ by a large factor and thus the induced dAGNs may have too large luminosity difference to be included.
As shown in Figure 3, the modeled frequency of kpc-scale dAGNs that can be detected through the double-peaked narrow line features declines to even lower values on the order of several ten-thousandths, e.g., at redshift . And the frequency of all kpc-scale dAGNs declines to at redshift . This decline is mainly due to the redshift evolution of the galaxy morphology distribution (e.g., Zucca et al., 2006). Correspondingly, the major mergers at such redshifts are dominated by very late-type galaxies (e.g., Sc-Sd and Irr galaxies) and the fraction of mergers that host large initial MBHs becomes substantially smaller at high redshifts. Future observations which would specifically search for high redshift dAGNs could test this prediction.
In addition, we note here that the estimates of the dAGN LF and the separation distribution may be affected by some simplified assumptions made above. Below we discuss how our results would be affected by some other mechanisms, which may trigger nuclear activities, but is ignored in the model above.
First, we have explicitly assumed that significant nuclear activities can only be triggered in the gas-rich component of a major merger. If we relax this assumption and allow significant nuclear activities to be triggered in the gas-poor component of a major merger, then the estimated dAGN frequency would rise to about ten percent or higher at luminosity , but is not affected much at lower luminosities. Under this assumption, the dAGNs at the high-luminosity end are primarily formed by major mergers of two red progenitor galaxies as the initial MBHs in red galaxies are substantially big compared to those in blue galaxies with similar total stellar masses. Mixed mergers of a red progenitor galaxy with a blue progenitor galaxy contribute little to the population of dAGNs with comparable luminosities, as the masses of the initial MBHs in these two progenitor galaxies are less likely to be comparable.
Second, a dAGN can also be produced at larger separations if nuclear activities could be triggered by tidal interactions when the two progenitor galaxies of a major merger are still far away from each other. Under this assumption, the model described in Section 2 can still be used but a large value of should be chosen (e.g., ). By assuming and a constant Eddington ratio till the completion of the mergers, our estimate of the frequency of kpc-scale dAGNs increases to . This increase is clearly because most of the MBHs in the progenitor galaxies could now grow up significantly before the separation of the two components of a dAGN decays to the kpc scale. However, increasing the value of the parameter to also implied that the predicted number of AGN pairs on scale of from our model is comparable to the total number of AGNs at luminosity , which is not consistent with current observations. One possible way to solve this inconsistency would be to impose that tidal interactions induce only low-level nuclear activities (e.g., with ) when the two progenitor galaxies are still far away from each other and the accretion rate is significantly enhanced only when the two progenitor galaxies become close enough to each other. In this case, a large number of paired AGNs on (with a frequency of several percent to ten percent) can be produced but the resulted frequency of dAGNs on kpc-scale is still the same as the current observations suggest.
Third, successive mergers, in principle, can include mergers of two progenitor galaxies whose nuclei have already been activated, which would also yield a dAGN. This scenario has not been discussed here in details mainly for simplicity. However, according to the major merger rates of galaxies presented in Section 2, the rate of successive major mergers, within the lifetime of detectable nuclear activities (e.g., ), is extremely low, especially if successive merger events were assumed to be independent of each other.
Future observations which would determine the distribution of dAGNs as a function of luminosity and separation may shed light on our understanding of the triggering mechanisms, major mergers, tidal interactions and the mergers of galaxies with already-activated nuclei.
4. Conclusions
In this paper, we have constructed a phenomenological model to estimate the number density of dAGNs and its evolution according to the observationally-estimated merger rates of galaxies and various scaling relations on the properties of galaxies and massive black holes. We have demonstrated that the observed frequency and separation distribution of dAGNs are compatible with the hypothesis that major mergers of galaxies lead to AGN/QSO activities and are consistent with most estimates of galaxy major merger rates. We have also predicted that the frequency of those dual AGNs with double-peaked narrow line features becomes even smaller (i.e., ) at higher redshifts and the frequency of all kpc-scale dAGNs is at , which can be tested by future observations. Future observations shall provide us with much better statistics on the distribution of kpc-scale dAGNs (and pairs of AGNs on even larger scale) as a function of luminosity and separation and hence will tighten the constraints on triggering mechanisms of nuclear activities.
References
- Balcells et al. (2007) Balcells, M., Graham, A. W., & Peletier, R. F. 2007, ApJ, 665, 1084
- Begelman et al. (1980) Begelman, M. C., Blandford, R. D., & Rees, M. J. 1980, Nature, 287, 307
- Bell et al. (2003) Bell, E. F., McIntosh, D. H., Katz, N., & Weinberg, M. D. 2003, ApJS, 149, 289
- Bell et al. (2006a) Bell, E. F., et al. 2006a, ApJ, 640, 241
- Bell et al. (2006b) Bell, E. F., Phleps, S., Somerville, R. S., Wolf, C., Borch, A., Meisenheimer, K. 2006b, ApJ, 652, 270
- Bernardi et al. (2010) Bernardi, M., Shankar, F., Hyde, J. B., Mei, S., Marulli, F., & Sheth, R. K. 2010, MNRAS, 404, 2087
- Bongiorno et al. (2010) Bongiorno, A., et al. 2010, A&A, 510, 56
- Boroson & Lauer (2009) Boroson, T., & Lauer, T. 2009, Nature, 458, 53
- Bridge et al. (2007) Bridge, C. R., et al. 2007, ApJ, 659, 931
- Bridge et al. (2010) Bridge, C. R., Carlberg, R. G., Sullivan, M. 2010, ApJ, 709, 1067
- Bundy et al. (2005) Bundy, K., Ellis, R. S., & Conselice, C. J. 2005, ApJ, 625, 621
- Bundy et al. (2009) Bundy, K., Fukugita, M., Ellis, R. S., Targett, T. A., Belli, S., Kodama, T. 2009, ApJ, 697, 1369
- Cassata et al. (2005) Cassata, P., et al. 2005, MNRAS, 357, 903
- Comerford et al. (2009a) Comerford, J. M., et al. 2009a, ApJ, 698, 965
- Comerford et al. (2009b) Comerford, J. M., Griffith, R. L., Gerke, B. F., Cooper, M. C., Newman, J. A., Davis, M., Stern, D. 2009b, ApJ, 702, L82
- Conselice et al. (2008) Conselice, C. J., Rajgor, S., & Myers, R. 2008, MNRAS, 386, 909
- Conselice et al. (2009) Conselice, C. J., Yang, C., & Bluck, A. F. L. 2009, MNRAS, 394, 1956
- de Propris et al. (2005) De Propris, R., Liske, J., Driver, S. P., Allen, P. D., & Cross, N. J. G. 2005, AJ, 130, 1516
- de Ravel et al. (2009) de Ravel, L., et al. 2009, A&A, 498, 379
- Dutton et al. (2011) Dutton, A. A., et al. 2011, MNRAS, 410, 1660
- Dutton et al. (2010) Dutton, A. A., Conroy, C., van den Bosch, F. C., Simard, L., Mendel, T., Courteau, S., Dekel, A., & More, S. 2010, arXiv:1012.5859
- Fu et al. (2010) Fu, H., Myers, A. D., Djorgovski, S. G., Yan, L. 2010, arXiv:1009.0767
- Fukugita et al. (1995) Fukugita, M., Shimasaku, K., & Ichikawa, T. 1995, PASP, 1995, 945
- Gallazzi et al. (2006) Gallazzi, A., Charlot, S., Brinchmann, J., & White, S. D. M. 2006, MNRAS, 370, 1106
- Gerke et al. (2007) Gerke, B. F., et al. 2007, ApJ, 660, L23
- Green et al. (2010) Green, P. J., Myers, A. D., Barkhouse, W. A., Mulchaey, J. S., Bennert, V. N., Cox, T. J., & Aldcroft, T. L. 2010, ApJ, 710, 1578
- Haring & Rix (2004) Haring, N., & Rix, H.-W. 2004, ApJ, 604, L89
- Heckman et al. (2004) Heckman, T. M., Kauffmann, G., Brinchmann, J., Charlot, S., Tremonti, C., & White, S. D. M. 2004, ApJ, 613, 109
- Hernquist (1989) Hernquist, L. 1989, Nature, 340, 687
- Ho (2008) Ho, L. C. 2008, ARA&A, 46, 475
- Hopkins et al. (2010) Hopkins, P. F., Bundy, K., Croton, D., Hernquist, L., Keres, D., Khochfar, S., Stewart, K., Wetzel, A., & Younger, J. D. 2010, ApJ, 715, 202
- Ilbert et al. (2010) Ilbert, O., et al. 2010, ApJ, 709, 644
- Kartaltepe et al. (2007) Kartaltepe, J. S., et al. 2007, ApJS, 172, 320
- Kitzbichler & White (2008) Kitzbichler, M. G., & White, S. D. M. 2008, MNRAS, 391, 1489
- Kollmeier et al. (2006) Kollmeier, J. A., et al. 2006, ApJ, 648, 128
- Komossa et al. (2003) Komossa, S., Burwitz, V., Hasinger, G., Predehl, P., Kaastra, J. S., & Ikebe, Y. 2003, ApJ, 582, L15
- Kormendy et al. (2011) Kormendy, J., Bender, R., & Cornell, M. E. 2011, Nature, 469, 374
- Lin et al. (2004) Lin, L., et al. 2004, ApJ, 617, L9
- Lin et al. (2008) Lin, L., et al. 2008, ApJ, 681, 232
- Liu et al. (2010b) Liu, X., Greene, J. E., Shen, Y., & Strauss, M. A. 2010b, ApJ, 715, L30
- Liu et al. (2010a) Liu, X., Shen, Y., Strauss, M. A., & Greene, E. 2010a, ApJ, 708, 427
- López-Sanjuan et al. (2009) López-Sanjuan, C., Balcells, M., Pérez-González, P. G., Barro, G., García-Dabó, C. E., Gallego, J., & Zamorano, J. 2009, A&A, 501, 505
- Lotz et al. (2008) Lotz, J. M., et al. 2008, ApJ, 672, 177
- Lotz et al. (2010) Lotz, J. M., Jonsson, P., Cox, T. J., Primack, J. R. 2010, MNRAS, 404, 575
- Merloni et al. (2010) Merloni, A., et al. 2010, ApJ, 708, 137
- Patton et al. (2011) Patton, D. R., Ellison, S. L., Simard, L., McConnachie, A. W., & Mendel, J. T. 2011, MNRAS, 412, 591
- Peterson (1997) Peterson, B. M. 1997, An Introduction to Active Galactic Nuclei (Cambridge: Cambridge Univ. Press)
- Rosario et al. (2011) Rosario, D. J., McGurk, R. C., Max, C. E., Shields, G. A., & Smith, K. L. 2011, arXiv:1102.1733
- Shen et al. (2003) Shen, S., et al. 2003, MNRAS, 343, 978
- Shen et al. (2008) Shen, Y., Greene, J. E., Strauss, M. A., Richards, G. T., Schneider, D. P. 2008, ApJ, 680, 169
- Shen et al. (2010) Shen, Y., Liu, X., Greene, J. E., & Strauss, M. A. 2010, arXiv:1011.5246
- Smith et al. (2010) Smith, K. L., Shields, G. A., Bonning, E. W., McMullen, C. C., Rosario, D. J., & Salviander, S. 2010, ApJ, 716, 866
- Stewart et al. (2009) Stewart, K. R., Bullock, J. S., Barton, E. J., & Wechsler, R. H. 2009, ApJ, 702, 1005
- Valtonen (2008) Valtonen, M. J., et al. 2008, Nature, 452, 851
- van der Wel et al. (2008) van der Wel, A., Holden, B. P., Zirm, A. W., Franx, M., Rettura, A., Illingworth, G. D., & Ford, H. C. 2008, ApJ, 688, 48
- Wang et al. (2009) Wang, J., Chen, Y., Hu, C., Mao, W., Zhang, S., & Bian, W. 2009, ApJ, 705, L76
- Weinziri et al. (2009) Weinziri, T., Jogee, S., Khochfar, S., Burkert, A., & Kormendy, J. 2009, ApJ, 696, 411
- Wolf et al. (2005) Wolf, C., et al 2005, ApJ, 630, 771
- Xu & Komossa (2009) Xu, D., & Komossa, S. 2009, ApJ, 705, L20
- Yu (2002) Yu, Q. 2002, MNRAS, 331, 935
- Yu & Lu (2008) Yu, Q., & Lu, Y. 2008, ApJ, 689, 732
- Yu & Tremaine (2002) Yu, Q., & Tremaine, S. 2002, MNRAS, 335, 965
- Zhou et al. (2004) Zhou, H., Wang, T., Zhang, X., Dong, X., & Li, C. 2004, ApJ, 604, L33
- Zucca et al. (2006) Zucca, E., et al. 2006, A&A, 455, 879