Effects of Residue Background Events
in Direct Detection Experiments on
Determining Properties of Halo Dark Matter
Abstract:
We reexamine the model–independent data analysis methods for extracting properties of Weakly Interacting Massive Particles (WIMPs) by using data (measured recoil energies) from direct Dark Matter detection experiments directly and, as a more realistic study, consider a small fraction of residue background events, which pass all discrimination criteria and then mix with other real WIMP–induced signals in the analyzed data sets. In this talk, the effects of residue backgrounds on the determination of the mass of halo Dark Matter particle as well as on the reconstruction of its one–dimensional velocity distribution function will be discussed.
1 Introduction
In our earlier work on the development of model–independent data analysis methods for extracting properties of Weakly Interacting Massive Particles (WIMPs) by using measured recoil energies from direct Dark Matter detection experiments directly [1, 2, 3], it was assumed that the analyzed data sets are background–free, i.e., all events are WIMP signals. Active background discrimination techniques should make this condition possible. For example, by using the ratio of the ionization to recoil energy, the so–called “ionization yield”, combined with the “phonon pulse timing parameter”, the CDMS-II collaboration claimed that electron recoil events can be rejected event–by–event with a misidentification fraction of . [4] The CRESST collaboration demonstrated also that the pulse shape discrimination (PSD) technique can distinguish WIMP–induced nuclear recoils from those induced by backgrounds by means of inserting a scintillating foil, which causes some additional scintillation light for events induced by -decay of and thus shifts the pulse shapes of these events faster than pulses induced by WIMP interactions in the crystal [5].111 More details about background discrimination techniques and status see also e.g., Refs. [6].
However,
as the most important issue in all
underground experiments,
possible residue background events
which pass all discrimination criteria and
then mix with other real WIMP–induced events in our data sets
should also be considered.
Therefore,
as a more realistic study,
we take into account
small fractions of residue background events
mixed in experimental data sets
and want to study
how well the model–independent methods
could extract the input
WIMP properties
by using these “impure” data sets
and how “dirty” these data sets could be
to be still useful.
2 Effects of residue background events
In our numerical simulations based on the Monte Carlo method, while the shifted Maxwellian velocity distribution [9, 1] with the standard values of the Sun’s orbital velocity and the Earth’s velocity in the Galactic frame: and , and the Woods–Saxon form for the elastic nuclear form factor for the spin–independent (SI) WIMP–nucleus interaction [10, 9] have been use for generating WIMP–induced signals, a target–dependent exponential form for residue background events has been introduced [7]:
| (1) |
Here is the recoil energy, is the atomic mass number of the target nucleus. The power index of , 0.6, is an empirical constant, which has been chosen so that the exponential background spectrum is somehow similar to, but still different from the expected recoil spectrum of the target nucleus (see Figs. 1); otherwise, there is in practice no difference between the WIMP scattering and background spectra. Note that, the atomic mass number has been used here just as the simplest, unique characteristic parameter in the analytic form (1) for defining the residue background spectrum for different target nuclei. It does not mean that the (superposition of the real) background spectra would depend simply/primarily on or on the mass of the target nucleus, .
Note also that, firstly, the exponential form (1) for residue background spectrum is rather naive; however, since we consider here only a few (tens) residue background events induced by perhaps two or more different sources, pass all discrimination criteria, and then mix with other WIMP–induced events in our data sets of total events, exact forms of different background spectra are actually not very important and this exponential spectrum should practically not be unrealistic. Secondly, our model–independent data analysis procedures requires only measured recoil energies from one or more experimental data sets with different target nuclei [1, 2, 3]. Hence, for applying these methods to future real direct detection data, the prior knowledge about (different) background source(s) is not required at all.
Moreover,
the maximal cut–off of the velocity distribution function
has been set as
km/s.
The experimental threshold energy
has been assumed to be negligible
and the maximal cut–off energy
is set as 100 keV.
The background window
(the possible energy range
in which residue background events cannot be ignored,
compared to some other ranges)
has been assumed to be the same as
the experimental possible energy range.
Note here that
the actual numbers of generated signal and background events
in each simulated experiment
are Poisson–distributed around their expectation values
independently,
and the total event number in one experiment
is then the sum of these two numbers;
both generated signal and background events
are treated as WIMP signals in our analyses.
Additionally,
we assumed that
all experimental systematic uncertainties
as well as the uncertainty on
the measurement of the recoil energy
could be ignored.
2.1 On the measured recoil spectrum
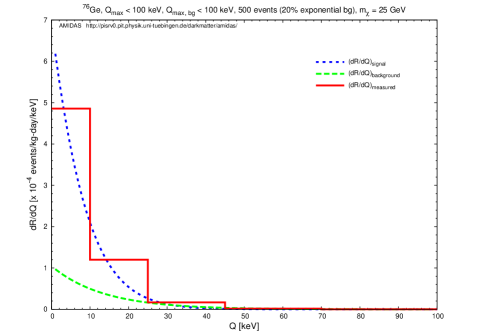
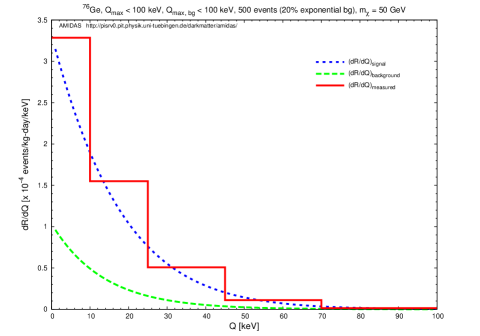
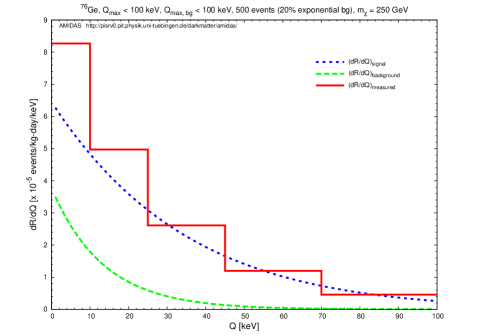
In Figs. 1 I show measured energy spectra (solid red histograms) for a target with three different WIMP masses: 25 (top), 50 (middle), and 250 (bottom) GeV. While the dotted blue curves show the elastic WIMP–nucleus scattering spectra, the dashed green curves indicate the exponential background spectrum given in Eq. (1), which have been normalized so that the ratios of the areas under these background spectra to those under the (dotted blue) WIMP scattering spectra are equal to the background–signal ratio in the whole data sets. 5,000 experiments with 500 total events on average in each experiment have been simulated.
It can be found here that, the shape of the WIMP scattering spectrum depends highly on the WIMP mass: for light WIMPs ( GeV), the recoil spectra drop sharply with increasing recoil energies, while for heavy WIMPs ( GeV), the spectra become flatter. In contrast, the exponential background spectra shown here depend only on the target mass and are rather flatter/sharper for light/heavy WIMP masses compared to the WIMP scattering spectra. This means that, once input WIMPs are light/heavy, background events would contribute relatively more to high/low energy ranges, and, consequently, the measured energy spectra would mimic scattering spectra induced by heavier/ lighter WIMPs.
2.2 On determining the WIMP mass
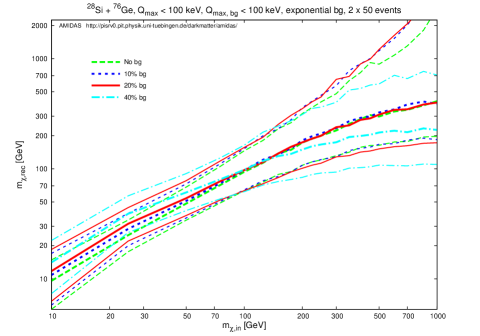
Fig. 2 show the median values of the reconstructed WIMP mass and the lower and upper bounds of the 1 statistical uncertainty by means of the model–independent procedure introduced in Refs. [2] with mixed data sets from WIMP–induced and background events as functions of the input WIMP mass. As in Refs. [2], and have been chosen as two target nuclei. The background ratios shown here are no background (dashed green), 10% (long–dotted blue), 20% (solid red), and 40% (dash–dotted cyan) background events in the analyzed data sets. 2 5,000 experiments with 50 total events on average in each experiment have been simulated.
It can be seen here clearly that, since for light WIMP masses ( GeV), due to the relatively flatter background spectrum (compared to the scattering spectrum induced by WIMPs) or, in practice, some background sources in high energy ranges, the energy spectrum of all recorded events would mimic a scattering spectrum induced by WIMPs with a relatively heavier mass, the reconstructed WIMP masses as well as the statistical uncertainty intervals could be overestimated. In contrast, for heavy WIMP masses ( GeV), due to the relatively sharper background spectrum or e.g., some electronic noise, relatively more background events contribute to low energy ranges, the energy spectrum of all recorded events would thus mimic a scattering spectrum induced by WIMPs with a relatively lighter mass. Hence, the reconstructed WIMP masses as well as the statistical uncertainty intervals could be underestimated. Nevertheless, Fig. 2 shows that, with 20% residue background events in the analyzed data sets of 50 total events, the 1 statistical uncertainty band can cover the true WIMP mass pretty well; if WIMPs are light ( GeV), the maximal acceptable fraction of residue background events could even be as large as 40%.
2.3 On reconstructing the one–dimensional WIMP velocity distribution function
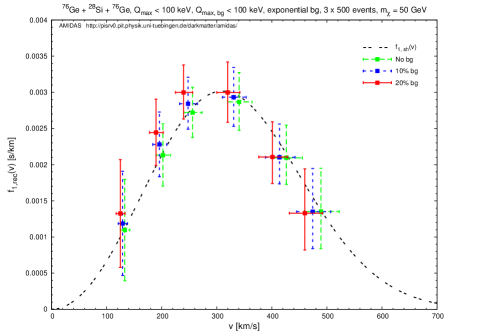
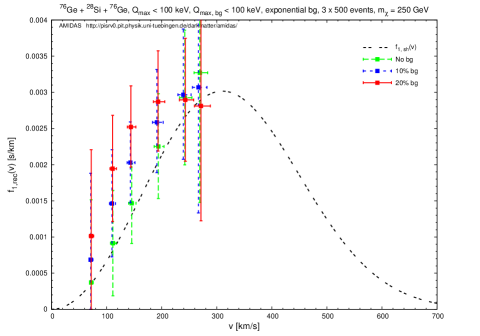
In this section I show the median values of the reconstructed one–dimensional velocity distribution function of halo WIMPs222 Note that, since the experimental maximal cut–off energy is fixed as 100 keV, for heavy input WIMP masses ( GeV), one can reconstruct the velocity distribution function only in the velocity range km/s. with its 1 statistical uncertainty by means of the model–independent method introduced in Ref. [1] with mixed data sets. As in Ref. [1], a nucleus has been chosen as our detector target for reconstructing ; while a target and a second target have been used for determining . The background ratios shown here are no background (dashed green), 10% (long–dotted blue), and 20% (solid red) background events in the analyzed data set(s). (3 ) 5,000 experiments with 500 total events on average in each experiment have been simulated.
2.3.1 With a precisely known WIMP mass
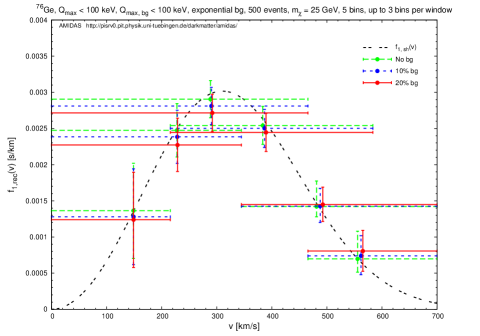
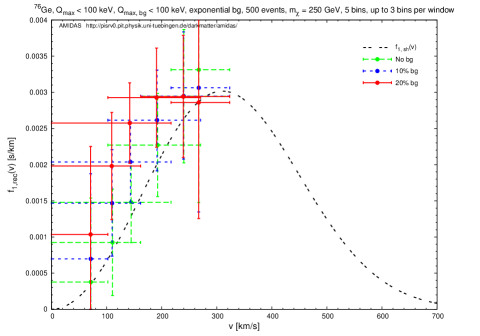
In Figs. 3 we first assume that the required WIMP mass for reconstructing has been known precisely with a negligible uncertainty. The horizontal bars show the sizes of the windows used for estimating [1]. Five bins have been used and up to three bins have been combined to a window, in order to collect more events in wider ranges and thereby reduce the statistical uncertainty on the reconstructed .333 Note that, since the neighboring windows overlap, the estimates of at adjacent points are correlated.
It can be seen that,
since
for heavy WIMP masses ( GeV),
the relatively sharper background spectrum
contributes more events to low energy ranges,
or, equivalently,
to low velocity ranges,
the reconstructed velocity distribution
would be shifted to lower velocities.
For an input WIMP mass of 100 GeV
and the background ratio of 10% (20%),
the peak of the reconstructed
velocity distribution function
could be shifted by 30 (60) km/s.
In contrast,
for light WIMP masses ( GeV),
the relatively flatter background spectrum
contributes more events to high energy/velocity
ranges,
and the reconstructed velocity distribution
would be shifted to higher velocities.
Moreover,
our simulation results
indicate that,
with an 10% – 20% background ratio
in the analyzed data set of 500 total events,
one could in principle reconstruct
the one–dimensional velocity distribution function of halo WIMPs
with an
(for a 25 GeV WIMP mass, 20% background events)
–
(for a 250 GeV WIMP mass, 10% background events)
deviation.
If the mass of halo WIMPs is (50 GeV),
the maximal acceptable background ratio
could even be as large as 40%
with a deviation of only .
2.3.2 With a reconstructed WIMP mass
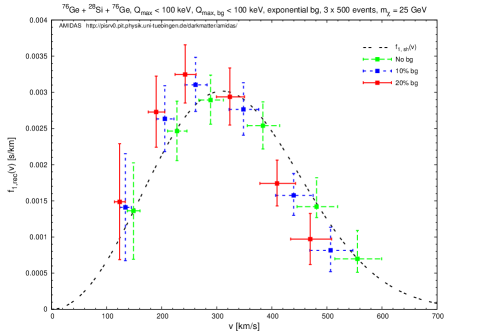
In Figs. 4 the required WIMP mass for reconstructing has been reconstructed with other direct detection experiments. Note that, while the vertical bars show the 1 statistical uncertainties on the reconstructed , taken into account the statistical uncertainty on the reconstructed WIMP mass, the horizontal bars indicate here the 1 statistical uncertainties on the estimates of the reconstructed points, due to the uncertainty on the reconstructed .
It has been found that,
firstly,
as shown in Figs. 2,
for an input WIMP mass of 100 GeV,
the reconstructed mass doesn’t differ very much
from the true value.
Hence,
the reconstructed
is approximately the same
for both cases with the input and reconstructed WIMP masses.
However,
for light/heavy input masses
( GeV),
the reconstructed
with the reconstructed WIMP mass
shift to relatively
lower/higher velocities
compared to the case
with the input (true) WIMP mass.
This effect caused directly by
the over-/underestimate of the reconstructed WIMP mass
[8]:
once the reconstructed WIMP mass is
over-/underestimated from the real value,
a transformation constant from to
will thus be under-/overestimated.
Consequently,
the reconstructed points
will be smaller/larger than the true values.
In contrast to the first effect discussed in the previous subsection, this second effect draws the reconstructed WIMP velocity distribution (more strongly) to the opposite directions. Nevertheless, with an 5% – 10% background ratio in the analyzed data sets of 500 total events, one could in principle still reconstruct the one–dimensional WIMP velocity distribution function with an (for 25 GeV WIMPs, 10% backgrounds) – (for 250 GeV WIMPs, 5% backgrounds) deviation. If 100 GeV, the maximal acceptable background ratio could even be as large as 20% with a deviation of only .
3 Summary
In this article we reexamine the data analysis methods introduced in Refs. [1, 2] for determining the mass and one–dimensional velocity distribution function of halo Dark Matter particle from measured recoil energies of direct detection experiments directly, by taking into account small fractions of residue background events, which pass all discrimination criteria and then mix with other real WIMP–induced events in the analyzed data sets.
Our simulations show that, with a background ratio of 5% – 10% in data sets of 500 total events, the one–dimensional WIMP velocity distribution function can in principle be reconstructed with an – systematic deviation; whereas with a background ratio of even 10% – 20% in data sets of only 50 total events, the 1 statistical uncertainty band of the reconstructed WIMP mass can cover the true value pretty well.
Acknowledgments
The author would like to thank the Physikalisches Institut der Universität Tübingen for the technical support of the computational work demonstrated in this article. This work was partially supported by the National Science Council of R.O.C. under contract no. NSC-98-2811-M-006-044 as well as by the Focus Group on Cosmology and Particle Astrophysics, National Center of Theoretical Sciences, R.O.C..
References
- [1] M. Drees and C.-L. Shan, JCAP 0706, 011 (2007).
- [2] M. Drees and C.-L. Shan, arXiv:0710.4296 (2007); JCAP 0806, 012 (2008).
- [3] M. Drees and C.-L. Shan, PoS IDM2008, 110 (2008); arXiv:0903.3300 (2009).
- [4] CDMS Collab., Z. Ahmed et al., Science 327, 1619 (2010).
- [5] CRESST Collab., R. F. Lang et al., Astropart. Phys. 33, 60 (2010); CRESST Collab., J. Schmaler et al., AIP Conf. Proc. 1185, 631 (2009).
- [6] E. Aprile and L. Baudis, for the XENON100 Collab., PoS IDM2008, 018 (2008); EDELWEISS Collab., A. Broniatowski et al., Phys. Lett. B 681, 305 (2009); EDELWEISS Collab., E. Armengaud et al., Phys. Lett. B 687, 294 (2010); CRESST Collab., R. F. Lang et al., Astropart. Phys. 32, 318 (2010).
- [7] Y.-T. Chou and C.-L. Shan, JCAP 1008, 014 (2010).
- [8] C.-L. Shan, JCAP 1006, 029 (2010).
- [9] G. Jungman, M. Kamionkowski and K. Griest, Phys. Rep. 267, 195 (1996).
- [10] J. Engel, Phys. Lett. B 264, 114 (1991).