VLT and GTC observations of SDSS J0123+00: a type 2 quasar triggered in a galaxy encounter?††thanks: Based on observations carried out at the European Southern Observatory (Paranal, Chile) with FORS2 on VLT-UT1 (programme 69.A-0123(A)) and at the Observatory Roque de los Muchachos (La Palma, Spain) with OSIRIS on GTC (programme GTC27-09A).
Abstract
We present long-slit spectroscopy, continuum and [OIII]5007 imaging data obtained with the Very Large Telescope and the Gran Telescopio Canarias of the type 2 quasar SDSS J0123+00 at 0.399. The quasar lies in a complex, gas-rich environment. It appears to be physically connected by a tidal bridge to another galaxy at a projected distance of 100 kpc, which suggests this is an interacting system. Ionized gas is detected to a distance of at least 133 kpc from the nucleus. The nebula has a total extension of 180 kpc. This is one of the largest ionized nebulae ever detected associated with an active galaxy. Based on the environmental properties, we propose that the origin of the nebula is tidal debris from a galactic encounter, which could as well be the triggering mechanism of the nuclear activity. SDSS J0123+00 demonstrates that giant, luminous ionized nebulae can exist associated with type 2 quasars of low radio luminosities, contrary to expectations based on type 1 quasar studies.
keywords:
(galaxies:) quasars:emission lines; (galaxies:) quasars individual: SDSS J012341.47+004435.9; galaxies:ISM;1 Introduction
Previous works suggest that the most luminous extended emission line regions (EELRs) around type 1 quasars (QSOs) at redshift 0.5 exist preferentially associated with steep-spectrum radio-loud QSOs with luminous [OIII]5007 nuclear emission and low broad line region metallicities (0.6). These EELRs have low metallicities as well and seem especially prevalent in QSOs showing signs of strong interaction. The origin of these nebulae is controversial, whether cold accretion of intergalactic gas, tidal debris from a galactic merger or remnants of galactic superwinds (for a review see Fu & Stockton 2009; Stockton, Fu & Canalizo 2006).
Very little is known about the existence of EELRs associated with type 2 quasars (e.g. Humphrey et al. 2009; Gandhi, Fabian & Crawford 1996). These objects are unique laboratories to investigate the existence and properties of quasar EELR. The fortuitous occultation of the active galactic nucleus (AGN) acts like a “natural coronograph”, allowing a detailed study of many properties of the surrounding medium, without the problems associated with the bright quasar point spread function. On the other hand, due to their much lower radio luminosity, distortions imprinted by the radio activity on the properties of the underlying nebulae are less important than in radio-loud objects.
For these reasons, we are undertaking a project based on imaging, long-slit and integral field data obtained with FORS2/VLT, the integral field spectrograph PMAS on the 3.5m telescope at Calar Alto Observatory (Humphrey et al. 2009), and the tunable filter OSIRIS on the GTC. These are being used to investigate the existence of EELR associated with Sloan Digital Sky Survey (SDSS) type 2 quasars at 0.3-0.4 and characterize their morphological, ionization and kinematic properties.
In this paper we present results on the type 2 quasar SDSS J012341.47+004435.9 (SDSS J0123+00 hereafter) at 0.399 (Zakamska et al. 2003). The object was detected by the NVSS survey with a flux density of 11.70.6 mJy (Condon et al. 1998). The radio emission is spatially unresolved. Assuming a radio spectral index of (where ), the expected radio luminosity density at 5 GHz is 51030 erg s-1 Hz-1 sr-1. This value suggests that the quasar is “radio-quiet” or at most “radio-intermediate” (Miller, Peacock & Mead 1990).
We assume =0.7, =0.3, H0=71 km s-1 Mpc-1. In this Cosmology, 1 corresponds to 5.33 kpc at =0.399.
2 Observations and analysis
The VLT observations were carried out on the 8th and 9th Sept 2008 using FORS2 on UT1. The 69155+69 filter was used to obtain the intermediate band image on the 1st night. It has a spectral window 6635-7185 Å which covers both continuum and redshifted H and [OIII]4959,5007. The pixel scale is 0.25 arcsec pix-1. A diamond pattern mosaic of 4 images with individual exposures of 200 seconds was obtained, shifting each image by 10 in RA or Dec relative to the previous one. This was done to minimize the impact of bad pixels and ghosts on the CCD. The images were combined, with simultaneous cosmic ray removal after bias subtraction. The seeing size measured from the final image is FWHM=0.950.05 for the 1st night.
Long slit spectroscopy was obtained at position angles (PA) PA60 (first night) and PA76 (second night), aligned with extended diffuse emission or nearby potentially companion objects revealed by the images (Fig. 1). The 600RI+19 grism and the GG435+81 order sorting filter were used with a 1 wide slit. The useful spectral range was 5030-8250 Å corresponding to rest frame 3595-5901 Å. The object was moved along the slit between two different positions for a more accurate sky subtraction. The data were reduced following standard procedures with STARLINK and IRAF packages. The spectra were debiased, flat fielded, wavelength () calibrated, background subtracted, combined with simultaneous cosmic ray removal, flux calibrated and corrected for Galactic extinction. Geometric distortion was found to be negligible.
The nights were photometric. Comparison of several spectrophotometric standard stars taken with a 5 slit during the run gave a flux calibration accuracy of 5% over the entire spectral range. To perform the spectroscopic analysis, the line profiles were fitted with Gaussian functions. The FWHM values were corrected for instrumental broadening (IP=7.20.2 Å as measured from the sky emission lines). Point sources did not fill the slit during the second night (seeing FWHM=0.650.05) and this introduces uncertainties on the kinematic analysis. For this reason, the PA60 spectrum was used to characterize the kinematic properties at the different spatial regions identified in the spectra.
GTC images were obtained with the OSIRIS camera on 17th Oct 2009 using the order sorting filter 694/44. The detector binning provided a spatial scale of 0.254 arcsec pix-1. A continuum image and a continuum+[OIII]5007 image were produced. Each one consisted of three 200 second exposures obtained through the tunable filters with FWHM=16 Å and central () at the optical axis of 7019 Å and 7069 Å respectively. Due to the nature of the instrument changes with radial distance from the optical axis. values were 7002.9 and 7052.7 Å for the on-band and off-band images respectively at the location of the target, corresponding to rest-frame [OIII]5007 and the adjacent continuum. The average seeing was 0.80.1. The observations were reduced and flux calibrated with the standard star G158-100 using IRAF routines. Tunable filter profiles were generated at corresponding to the spatial location of G158-100 on the CCD and applied to its absolute flux spectrum to obtain the flux calibration factors. The individual target exposures for each filter were sky subtracted, spatially aligned and combined.
3 Results
3.1 Imaging data
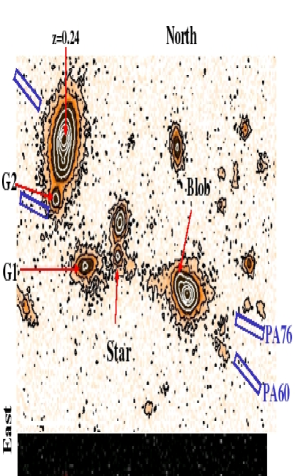
The VLT intermediate band image is shown in Fig. 1 (top panel). The bottom panel shows the GTC pure [OIII]5007 (green) and continuum (red) composite image. The original [OIII]+continuum image was continuum subtracted, and therefore the green colour shows the pure gas emission. The central elliptical galaxy presents distorted contours due to a detached “blob” which is more evident in the GTC images and emits both continuum and strong line emission. Low surface brightness diffuse features and knots are detected well outside the optical size of the galaxy. A long filament extends roughly in the E-W direction, to a maximum projected distance from the nuclear region of 14 (75 kpc) and a total extension of 25 (133 kpc) (throughout the text distances and sizes are projected values).
The filament is clearly detected in [OIII] extending towards and overlapping with galaxy “G1”, which emits not only continuum but also line emission since it is clearly detected in the pure [OIII] GTC image. Therefore it is at similar as the quasar. Both objects seem to be physically connected by the filament mentioned above, which is reminiscent of a tidal bridge. “G2”, which is detected both in continuum and [OIII], also lies at a similar and is located roughly along the direction of the filament. Other galaxies are found near the quasar in projection, but we cannot confirm that any of them are at similar .
The VLT and GTC images show that SDSS J0123+00 lies in a rich gaseous environment and suggest that it is a member of an interacting system.
3.2 Long slit spectra.
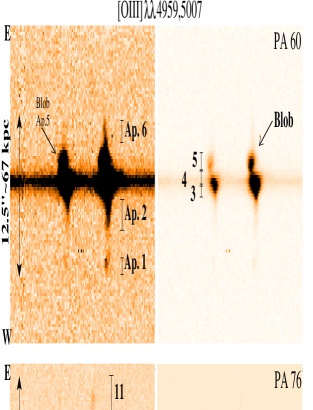
The 2-dim spectra at PA60 and PA76 including the [OIII]4959,5007 doublet are presented in Fig. 2. The low surface brightness features revealed by the images (Fig. 1) along the slit direction emit a rich emission line spectrum. Continuum emission is not detected from these features. The spectra reveal a total extension of the ionized nebula of 12.5 (67 kpc) and 34 (180 kpc) along PA60 and PA76 respectively. The maximum radial extent from the nucleus is 25 (133 kpc) measured along PA76 towards the East. The filament revealed by the images is part of this structure.
The visual inspection of the 2-dim spectra reveal 3 distinct spatial regions where the gas is characterized by different kinematic and ionization properties, which are recognisable at both PA. We have named them the central region, the intermediate region and the low surface brightness nebula (LSBN hereafter). We have analysed them separately. Since it is possible that within each region there is a spatial variation of the kinematic and ionization properties, we have defined within each region one or more apertures (Ap. hereafter) as specified below.
In order to characterize the ionization properties of the gas at each spatial location, we plot the line ratios for the different apertures in the [OIII]/H vs. [OII]3727/[OIII]5007 diagnostic diagram (Fig. 3), which involves the strongest emission lines detected in most apertures. Only apertures for which at least two emission lines are detected are shown. For comparison, the standard photoionization model sequence often applied to low redshift type 2 active galaxies is also shown (see Villar-Martín et al. 2008 for a discussion of this model sequence applied to type 2 quasars). The models assume solar metallicity, gas density =100 cm-3 and power-law index =-1.5. The ionization parameter varies along the sequence. A subsample of HII galaxies extracted from the catalogue by Terlevich et al. (1991) is also shown.
-
•
1. The central region (Ap. 4 in Fig. 2 and 3). This is the region in which the continuum emission is brightest. The continuum spatial profile is strongly peaked and is dominated by an unresolved central component (FWHM=0.920.03, PA60), although diffuse continuum emission is also detected in excess of the PSF wings up to a total extension of 4 or 21 kpc. The central region emits a rich emission line spectrum, typical of AGN (Fig. 3 dark blue solid circle), including strong HeII4686. The FWHM([OIII]) value measured from the 1-dim spectrum is 43030 km s-1.
We have fitted the continuum in Ap. 4 stellar population models. The nebular continuum was first removed. Its contribution, 6% of the total continuum flux at 4020 Å (0), was estimated from the H flux. A reasonable range of parameters (gas metallicities, temperature and density) and no reddening (as implied by the H/H=0.480.07 value) were considered. The fit (Fig. 4) to the nebular continuum subtracted spectrum implies the presence of an old stellar population and an excess of blue light which cannot be accounted for with only old stars. If it is due to young stars, the best fit is obtained with an old stellar population of 5-10 Gyr of age that contributes with 80% of the continuum at 4020 Å (0) plus a young stellar population (age 10 Myr) which contributes 20%. However, based on these data alone we cannot distinguish if this blue excess is alternatively due to scattered nuclear radiation (the polarization level measured by Zakamska et al. (2006) was (2.72.2%).
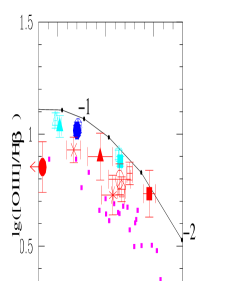
Figure 3: Diagnostic diagram and the gas ionization properties. Different symbols are used for different apertures. PA60: Solid symbols. PA76: Hollow symbols. Blue and cyan symbols correspond to the central and intermediate regions apertures, while red symbols correspond to apertures across the LSBN. The small magenta symbols are HII galaxies from Terlevich et al. (1992) catalogue. The solid black line represents standard AGN photoionization models (see text). Numbers -1 and -2 indicate the log(U) values corresponding to the nearest models. 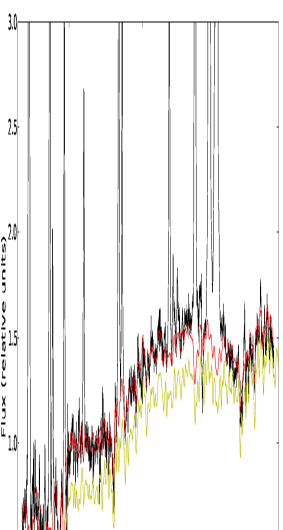
Figure 4: Nuclear spectrum (black) (the nebular continuum has been removed) and the best fit stellar population model (red) obtained with the code STARLIGHT (Cid Fernandes et al. 2005). An excess of blue light above the old stellar population (yellow) is implied by the analysis. We do not know whether this excess is due to young stars (blue) and/or scattered AGN light. -
•
1 2.5. The intermediate region (Ap. 3 and 5 Fig. 2 and 3). It extends at both sides of the central region, up to a distance of 2.0 to the E and 2.6 to the W respectively from the continuum centroid (PA60). The location of Ap. 3 and 5 in the diagnostic diagram (Fig. 3, cyan solid square and triangle) shows that they are predominantly photoionized by the AGN. This is also confirmed by the presence of strong HeII emission.
An interesting feature within the intermediate region, which is clearly seen in the GTC images (Fig. 1) is a detached blob, which looks rather compact (Ap. 5, Fig. 2). FWHM values along PA60 (1.150.05) and PA76 (1.10.1) implying a physical size of a few kpc. Its centroid is located at 1.3 from the continuum centroid. Faint continuum emission is detected. The lines are blueshifted relative to the rest of the ionized gas (Fig. 2) and show very asymmetric line profiles which reveal complex kinematics.
-
•
3. The low surface brightness nebula (LSBN) has a total extension of 180 kpc, as mentioned above (Fig. 2), and overlaps towards the East with the filament or tidal bridge identified in the images (Fig. 1). The fact that the FIRST and NVSS fluxes are consistent with each other shows that no significant radio emission at 1.4 GHz is present on scales 5 or 27 kpc and therefore any jet present is probably much smaller than the nebula. The spectrum integrated across Ap. 6 to 9 along PA76 is shown in Fig. 5.

Figure 5: LSBN spectrum integrated from Ap. 6 to 9 along PA76. Flux in units of 10-17 erg s-1 cm-2 Å-1. A study of the emission line kinematics of the LSBN along PA60 shows that they are quiescent: it emits very narrow, unresolved emission lines with FWHM100 to 140 km s-1 depending on spatial location, and the rest-frame velocity shifts relative to the nucleus are also small (200 km ). The lines are narrower than the IP measured from the sky lines at most spatial locations along PA76, confirming the general narrowness of the lines also in this direction.
In order to investigate the spatial variation of the ionization properties of the LSBN, several apertures where considered along the slit. Since the LSBN is knotty and inhomogeneous, we selected apertures that isolate individual features when possible (Fig. 2). We have plotted the location of the apertures along PA60 and PA76 in the diagnostic diagram (Fig. 3). It is important to note that the standard AGN photoionization models, although successful at reproducing many spectral properties of type 2 active galaxies in general and type 2 quasars in particular, cannot explain the large scatter in the diagnostic diagrams presented by this class of objects (e.g. Robinson et al. 1987), with a substantial fraction overlapping with HII galaxies. The locations of the LSBN apertures of SDSS J0123+00 in the diagrams are consistent with the scatter presented by the general population of type 2 active galaxies. Although a range of gas and/or AGN continuum properties has usually been claimed as responsible for the scatter, Villar-Martín et al. (2008) proposed that an alternative possibility is that young stars contribute to the gas excitation, in addition to the AGN. We explore this possibility further for SDSS J0123+00.
Fig. 3 shows that Ap. 2 and 6 line ratios along PA60, which are closer to the AGN, are consistent with pure AGN photoionization, while moving outwards (Ap. 1, at 6.6 or 35 kpc), the line ratios are consistent with HII star forming galaxies. A similar trend is found along PA76: Ap. 6 presents an intermediate spectrum, with line ratios between the standard AGN models and HII galaxies (HeII is also detected). All other apertures (4.5 or 24 kpc, most clearly Ap. 2, 7, 8, 9) overlap with the HII galaxy zone.
Therefore, although with the available information it is not possible to discard that the entire nebula is photoionized by the AGN, we find that the spatial variation of the LSBN line ratios can be explained if the inner regions are photoionized by the AGN, while moving outwards stellar photoionization becomes dominant. Line ratios based on [OI]6300, H, [NII]]6583, [SII]6716,6732 would help to discriminate between the two scenarios.
In the stellar photoionization scenario, we can estimate the gas oxygen abundance in regions purely ionized by stars, using the R23 method (Pilyugin & Thuan 2005). The spectrum integrated across the LSBN has H/H=0.430.07, consistent within the errors with the theoretical case B recombination value, and thus we assume no line reddening. To make sure that AGN photoionization is relatively negligible, we have used the spectra of those apertures along PA76 (e.g. Ap. 7,8,9) which are unambiguously placed among the HII galaxies and far from the standard AGN models in Fig. 3, taking the errorbars into account.
The individual spectra, as well as the integrated spectra across all these apertures, are too noisy to set useful constraints on the [OIII]4363 flux and . This introduces uncertainties on the abundance determination, due to the bimodal shape of the 12+log(O/H) vs. log(R23) function (Pilyugin & Thuan 2005). The log values measured for Ap. 7, 8 an 9 along PA76 are 1.010.06, 0.960.09 and 1.100.06 respectively and imply abundances well below solar, in the range 8% to 42% solar taking errors and uncertainties into account, and depending on the aperture. Similarly abundances are often found in compact HII galaxies (e.g. Guzmán et al. 1997, Terlevich et al. 1991). For comparison, we have used the SDSS spectrum to constrain the abundance within the inner AGN photoionized region using the method discussed in Humphrey et al. (2008). The resulting oxygen abundance must be 25% solar in order to reproduce the optical line ratios.
The narrowness of the spectral lines compared with the IP (see §2), implies that the spatial extent in the direction perpendicular to the slit is 1 or 5.3 kpc. For the brightest knots isolated along the slit, FWHM1.10.1 corresponding to 4.70.6 kpc, taking the seeing into account. Sizes 5 kpc are also measured for the UV rest frame continuum knots identified in the HST images of Zakamska et al. (2006).
The H luminosity for Ap. 7,8,9 is in the range (0.4-1.0)1040 erg s-1. If the gas is photoionized by stars, star forming rates (SFR) 0.09-0.23 M⊙ yr-1 are implied (Kennicutt 1998; given the large EW of the lines, stellar absorption of H is expected to be negligible). Considering the small knot sizes, slit flux losses could be 30%. This uncertainty does not affect our conclusions. Similar SFRs and sizes are found for some nearby compact HII galaxies (Telles, Muñoz-Tuñón, Tenorio-Tagle 2001, Guzmán et al. 1997).
4 Discussion and conclusions
SDSS0123+00 at 0.399 is associated with a giant, luminous ionized nebula, which extends for 180 kpc. This is one of the largest EELRs ever detected associated with an AGN. The EELR 31042 erg s-1 is similar to that of very luminous EELRs associated with type 1 quasars. Therefore, this object demonstrates that very luminous and giant EELR can also be associated with low radio luminosity quasars, contrary to expectations based on type 1 quasar studies (see §1). The low EELR abundances inferred (0.5) and the clear signs of interactions are features often found in type 1 quasars with luminous EELR.
SDSS0123+00 lies in a gas rich environment and it seems to be a member of an interacting system. The quasar appears to be physically connected by a tidal bridge to a companion galaxy at 100 kpc in projection. The giant EELR encompasses the bridge. Although we cannot discard the possibility that the entire EELR is photoionized by the AGN, the spatial variation of the line ratios can be explained if the gas in the inner regions (24 kpc) is predominantly ionized by the AGN while stellar photoionization becomes dominant as we move outwards. The star formation might have been triggered during the interaction. Whatever ionizes the gas, we find that the properties (sizes, line widths, line ratios and luminosities) of the individual knots isolated within the LSBN are consistent with nearby HII galaxies.
Based on the environmental properties (the tidal bridge and the companion galaxy “G1”), we propose that the origin of the EELR in this object is tidal debris from a galactic encounter. The companion must contain a substantial amount of metal poor gas, to explain the subsolar EELR abundances. The nuclear activity might have been triggered in such encounter, rather than in the final stages of a major galaxy merger (as the nuclei coalesce). Probably the closest approach in the encounter occurred 100 Myr ago, assuming a typical 300 km s-1 separation speed, and a true distance between the two galaxies of 100 kpc. Such a scenario would be consistent with recent imaging results for powerful radio galaxies (Ramos Almeida et et. 2010, in prep.).
Acknowledgments
Thanks to an anonymous referee for useful comments. Work funded with support from the Spanish MICINN (grants AYA2004-02703, AYA2007-64712 and AYA2009-13036-C02-01). AMS is supported by a UK STFC postdoctoral fellowship. EP is grateful to Ignacio González Serrano for useful discussions and help with OSIRIS data. Thanks to the GTC and VLT staff for their support during the observations.
References
- [\citeauthoryearCid Fernandes et al.2005] Cid Fernandes R., González Delgado R. M., Storchi-Bergmann T., Martins L., Schmitt H., 2005, MNRAS, 356, 270
- [\citeauthoryearCondon et al. 19981998] Condon J., Cotton W. D., Greisen E. W., Yin Q. F., Perley R., Taylor G., Broderick J., 1998, AJ, 115, 1693
- [\citeauthoryearFu & Stockton2009] Fu H., Stockton A., 2009, ApJ, 690, 953
- [\citeauthoryearGandhi, Fabian & Crawford2006] Gandhi P., Fabian A., Crawford C., 2006, MNRAS, 369, 1566
- [\citeauthoryear] Guzmán R. Gallego J., Koo D., Philips A., Lowenthal J., Faber S., Illingworth G., Vogt N., 1997, ApJ, 489, 559
- [\citeauthoryearHumphrey et al.2008] Humphrey A., Villar-Martín M., Vernet J., Fosbury R., di Serego Alighieri S., Binette L., 2008, MNRAS, 383, 11
- [\citeauthoryearHumphrey et al.2009] Humphrey A., Villar-Martín M., Sánchez S., Martínez-Sansigre A., González Delgado R., Pérez E., Tadhunter C., . Pérez-Torres M., 2009, MNRAS, submitted
- [\citeauthoryearKennicutt1989] Kennicutt R.C., 1989, ARA&A, 36, 189
- [\citeauthoryearMiller, Peacock, Mead1990] Miller L., Peacock J.A., Mead A.R., 1990, MNRAS, 244, 207
- [\citeauthoryear2005] Pilyugin L., Thuan T., 2005, ApJ, 631, 231
- [\citeauthoryearRobinson et al.1987] Robinson A., Binette L., Fosbury R., C. Tadhunter, 1987, MNRAS, 227, 97
- [\citeauthoryearStockton, Fu & Canalizo2006] Stockton A., Fu H. & Canalizo G., 2006, NewAR, 50 694
- [\citeauthoryear] Telles E., Muñoz-Tuñón C., Tenorio Tagle G., 2001, ApJ, 548, 671
- [\citeauthoryear] Terlevich R., Melnick J., Masegosa J., Moles M., Copetti M., 1991, A&AS, 91, 285
- [\citeauthoryearVillar-Martín et al.2008] Villar-Martín M., Humphrey A., Martínez-Sansigre A., Pérez-Torres M., Binette L., Zhang X.G, 2008, MNRAS, 390, 218
- [\citeauthoryearZakamska et al.2003] Zakamska N., Strauss M., Krolik J. et al. 2003, AJ, 126, 2125
- [\citeauthoryearZakamska et al.2006] Zakamska N., Strauss M., Krolik J. et al. 2006, AJ, 132, 1496