Morphologies of Radio, X-Ray, and Mid-Infrared Selected AGN**affiliation: Based on observations with: the NASA/ESA Hubble Space Telescope, obtained at the Space Telescope Science Institute, which is operated by AURA Inc, under NASA contract NAS 5-26555; Subaru Telescope, which is operated by the National Astronomical Observatory of Japan; XMM-Newton, an ESA science mission with instruments and contributions directly funded by ESA Member States and NASA under large program 175.A-0839; National Radio Astronomy Observatory, which is a facility of the National Science Foundation operated under cooperative agreement by Associated Universities; and the Spitzer Space Telescope, which is operated by the Jet Propulsion Laboratory, California Institute of Technology, under NASA contract 1407.
Abstract
We investigate the optical morphologies of candidate active galaxies identified at radio, X-ray, and mid-infrared wavelengths. We use the Advanced Camera for Surveys General Catalog (ACS-GC) to identify 372, 1360, and 1238 AGN host galaxies from the VLA, XMM-Newton and Spitzer Space Telescope observations of the COSMOS field, respectively. We investigate both quantitative (GALFIT) and qualitative (visual) morphologies of these AGN host galaxies, split by brightness in their selection band. We find that the samples are largely distinct, though extensive overlap exists between certain samples, most particularly for the X-ray and mid-IR selected sources with unresolved optical morphologies. We find that the radio-selected AGN are most distinct, with a very low incidence of having unresolved optical morphologies and a high incidence of being hosted by early-type galaxies. In comparison to X-ray selected AGN, mid-IR selected AGN have a slightly higher incidence of being hosted by disk galaxies. These morphological results conform with the results of Hickox et al. (2009) who studied the colors and large-scale clustering of AGN, and found a general association of radio-selected AGN with “red sequence” galaxies, mid-IR selected AGN with “blue cloud” galaxies, and X-ray selected AGN straddling these samples in the “green valley.” We also find that optical brightness scales with X-ray and mid-IR brightness, while little correlation is evident between optical and radio brightness. This suggests that X-ray and mid-IR selected AGN have similar Eddington ratios, while radio-selected AGN represent a different accretion mechanism with a lower and wider range of Eddington ratios. In the general scenario where AGN activity marks and regulates the transition from late-type disk galaxies into massive elliptical galaxies, this work suggests that the earlier stages are most evident as mid-IR selected AGNs. Mid-IR emission is less susceptible to absorption than the relatively soft X-rays probed by XMM-Newton, which are seen at later stages in the transition. Radio-selected AGN are then typically associated with minor bursts of activity in the most massive galaxies.
1 Introduction
In order to derive a coherent view of galaxy evolution we must investigate the different modes by which galaxies evolve. One of these modes is AGN activity in galaxies. There appears to be a strong connection between galaxies and their super massive black holes (SMBHs) as evidenced in the local universe by observed correlations between central SMBH masses and host galaxy properties, including luminosity (Kormendy & Richstone 1995; Marconi & Hunt 2003), velocity dispersion (Ferrarese & Merritt 2000; Gebhardt et al. 2000), and mass (Magorrian et al. 1998). These observations imply that galaxies and their SMBHs co-evolve in a systematic, yet not well understood process. Studying the morphologies of AGN host galaxies can provide valuable clues into the formation and evolution of these systems and may provide a general understanding of galaxy evolution.
At low redshifts (), Kauffmann et al. (2003) explore the properties of a large sample of narrow-lined AGN host galaxies from the Sloan Digital Sky Survey (SDSS; York et al., 2000) and find that AGN host galaxies have similar properties to ordinary early-type galaxies, albeit with younger stellar populations indicating recent episodes of star formation. Studying SDSS images of of the brightest AGN at , Kauffmann et al. (2003) find that they are hosted by approximate equal numbers of disk, spheroid, and interacting galaxies.
At higher redshift, closer to the peak of AGN activity, morphological studies of AGN host galaxies require the spatial resolution of the Hubble Space Telescope. To date, most large studies have only considered X-ray selected AGN. Gabor et al. (2009), studying a sample of spectroscopically-confirmed AGN at in the Cosmic Evolution Survey (COSMOS) (Scoville et al., 2007) field, conclude that X-ray AGN span a substantial range of morphologies which peak between bulge-dominated, early-type galaxies and disk-dominated, late-type galaxies. They suggest the AGN activity coincides with the transition between disk-dominated to bulge-dominated galaxies, and might not be triggered by major mergers. Georgakakis et al. (2009) performed visual classifications on a sample of 454 X-ray selected AGN in the Great Observatories Origins Deep Survey (GOODS) (Giavalisco et al., 2004) and All-wavelength Extended Groth strip International Survey (AEGIS) fields. Their sample was restricted to the redshift range , and they find that disk-dominated hosts contribute % to the total AGN space density and % to the luminosity density since . They conclude that AGN in disk galaxies are likely fueled by minor interactions and disk instabilities rather than by a major mergers.
However, previous Hubble studies have suffered by typically only considering AGN selected by a single method. Besides X-ray selection, AGN are also efficiently identified by radio luminosity and mid-IR color. In particular, the relatively soft ( keV) photons observed by Chandra and XMM-Newton come from very near the central SMBH and are susceptible to absorption. Radio and mid-IR emission are less susceptible to absorption, and thus readily identify both unobscured and obscured AGN. On the other hand, only % of AGN are radio loud (e.g., Stern et al., 2000), and mid-IR selection is only effective for the highest luminosity AGN (e.g., Donley et al., 2007; Eckart et al., 2010). Hickox et al. (2009), studying the spatial clustering of 585 AGN at in the AGN and Galaxy Evolution Survey (AGES; Kochanek, in prep.) of the Boötes field, find that: (a) radio-selected AGN are preferentially found in luminous red sequence galaxies and are strongly clustered; (b) X-ray-selected AGN are preferentially found in galaxies which populate the “green valley” of color-magnitude space and are clustered similarly to normal galaxies; and (c) mid-IR-selected AGN reside in slightly bluer, less luminous galaxies than the X-ray AGN and are also weakly clustered.
In this paper, we extend the results of Gabor et al. (2009) and Georgakakis et al. (2009) by considering the Hubble morphologies of AGN selected by more than their X-ray properties, and we extend the results of Hickox et al. (2009) by seeing whether the optical morphologies of AGN selected using different criteria are consistent with the expectations derived from their clustering properties. As an input sample, we consider radio, X-ray, and mid-IR selected AGN identified in the COSMOS survey. We use Hubble data to study the optical morphologies of the AGN host galaxies both quantitatively (with GALFIT) and qualitatively (visually). This paper is organized as follows: in §2 we describe the data sets used for this analysis, followed by a detailed discussion of catalog cross-correlation in §3. Section 4 discusses the methodology of the morphological classifications and results from this analysis. During the course of this investigation, we identified a handful of rare, interesting AGN, such as the dual AGN published in Comerford et al. (2009a), as well as offset AGN and lensed AGN candidates. These sources are discussed in §5. Finally, we discuss the results in 6. Where necessary, we adopt the concordance -cosmology with , , and .
2 The Data
2.1 Hubble ACS imaging
The cornerstone data set for the COSMOS survey is its wide-field Hubble Advanced Camera for Surveys (ACS) imaging (Scoville et al., 2007). With 583 single-orbit Hubble ACS F814W (-band; hereafter ) observations, it is the largest contiguous Hubble imaging survey to date. The imaging covers an area of approximately 1.8 square degrees in the COSMOS field, centered at RA=10:00:28.6, DEC=+02:12:21.0 (J2000). The 50% completeness limit for sources 0.5″ in diameter is . The imaging has a resolution of 0.09″ (FWHM) and a pixel scale of 0.05″ pix-1. The COSMOS survey was designed to study the evolution of galaxies, AGN, and dark matter in the context of large-scale structure (LSS). The high resolution imaging allows for the measurement of galaxy morphological parameters with high accuracy. A detailed description of the Hubble data processing is provided in Koekemoer et al. (2007).
2.2 VLA imaging
The VLA-COSMOS large project (Schinnerer et al., 2007) acquired deep, uniform 1.4 GHz data over the entire COSMOS field using the A-array configuration of the Very Large Array (VLA). This configuration provides a resolution of approximately 2″ (FWHM) at 1.4 GHz, which is well-matched to the spatial resolution of the optical and near-IR ground-based data. The deep observations provide a mean rms noise of Jy per beam. A total of 23 separate pointings were observed to fully cover the COSMOS field. The VLA-COSMOS project was constructed to study a wide range of cosmological questions, including the history of star formation and the growth of super-massive black holes through AGN activity.
2.3 XMM-Newton imaging
The XMM-Newton COSMOS survey (Hasinger et al. 2007, Cappelluti et al. 2009) acquired deep X-ray data over the entire COSMOS Hubble ACS field. A total of 55 pointings were observed (2.13 deg2) for a total of 1.5 Ms with an average vignetting corrected depth of 40 ks across the field of view. The survey has flux limits of 1.710-15 erg cm-2 s-1, 9.310-15 erg cm-2 s-1 and 1.310-14 erg cm-2 s-1 over 90% of the area (1.92 deg2) in the 0.5-2 keV, 2-10 keV and 5-10 keV energy bands, respectively. The XMM-Newton observations are important for identifying AGN, groups of galaxies, and galaxy clusters. The primary goal of the XMM-Newton COSMOS survey was to study the co-evolution of AGN and galaxies as a function of environment.
2.4 Spitzer imaging
The S-COSMOS survey (Sanders et al., 2007) is a Spitzer Legacy program which carried out a uniformly deep survey of the full COSMOS field in seven mid-IR bands (3.6, 4.5, 5.8, 8.0, 24, 70, and 160 m). The Infrared Array Camera (IRAC) (Fazio et al., 2004) and Multiband Imaging Photometer for Spitzer (MIPS) (Rieke et al., 2004) data are well suited to addressing the stellar-mass assembly of galaxies (through IRAC) and dust-embedded sources such as starburst galaxies and AGN (through MIPS and IRAC). In particular, heavily-obscured AGNs will be largely missed from surveys at UV, optical, and soft X-ray energies. The typical depth of S-COSMOS is between 1.2 and 2.2 ks. Refer to Table 4 in Sanders et al. (2007) for integration times and band sensitivities.
2.5 ACS-GC
The Advanced Camera for Surveys General Catalog111ugastro.berkeley.edu/ rgriffit/Morphologies/ (ACS-GC) data (Griffith et al., in prep.) was constructed to study the evolution of galaxy morphologies over a wide range of look-back times. The ACS-GC uniformly analyzes the largest Hubble ACS imaging surveys (AEGIS, GEMS, GOODS-S, GOODS-N, and COSMOS) using the GALAPAGOS code (Barden et al., in prep.) to measure quantitative galaxy morphologies for over 490,000 sources. The COSMOS survey comprises 65.3% of the catalogued sources. The ACS-GC data set also combines the large redshift surveys (DEEP2, COMBO17, zCOSMOS, COSMOS) to provide redshifts (spectroscopic and photometric) for a large fraction of this sample (65%). GALAPAGOS provides quantitative galaxy morphologies derived from GALFIT (Peng et al., 2002). We use single Sérsic (1968) models for all sources detected by SExtractor (Bertin & Arnouts, 1996). In crowded fields we simultaneously fit neighbors to avoid contamination by nearby sources. For every source in the ACS-GC catalog we provide a color image, a GALFIT residual image, and an atlas image, which combines all of the secondary data such as key morphological, photometric, and redshift information into a single file. Refer to Barden et al. (in prep.) or Häussler et al. (2007) for a full description of the GALAPAGOS code and refer to Griffith et al. (in prep.) for a full description of the ACS-GC.
|
3 Cross-Matching Catalogs
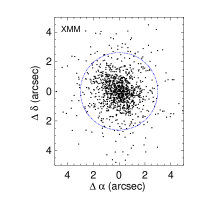
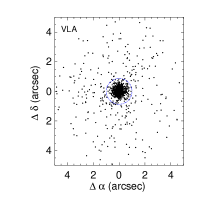
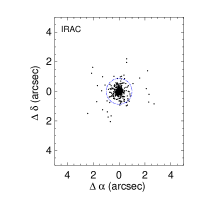
Optimal usage of these various data sets requires cross-matching sources across the multi-wavelength data. In order to determine the best matching radii for the various COSMOS imaging data sets, we created a sub-region, or test area, of the full survey which was imaged by Hubble, Spitzer, XMM-Newton, and VLA. We initially used very conservative (e.g., large) radii to match the Spitzer, XMM-Newton, and VLA samples to the Hubble imaging (5″, 5″ and 3″, respectively). We summarize the test area results in Table 1 ( column): of 1161 XMM-Newton sources in the test area, we matched 1117 (96%) to ACS-GC sources within 5″; of 1534 VLA sources ( mJy) in the test area, we matched 1440 (94%) to ACS-GC sources within 5″; and we matched all 881 IRAC sources ([5.8] 16.5, Vega) in the test area to ACS-GC sources within 3″. We visually inspected those sources which did not have an ACS-GC counterpart and found that most had faint optical counterparts below the ACS-GC detection threshold.
Motivated by our cross-matching results (Figure 1) we use a 3″ search radius for the final XMM-ACS matching and a 1″ search radius for the final VLA-ACS and IRAC-ACS matching. These final matchings also apply the mean astrometric offsets derived from the test area, typically , between the AGN selection catalog and the ACS-GC (see Table 1). The 1″ search radius for the IRAC-ACS and VLA-ACS matching yields a 4.4% spurious detection rate at the full depth of the ACS-GC catalog. The XMM-ACS matching, which required a larger matching radius, yields a 24.5% spurious identification for , which corresponds to the depth at which 90% of the X-ray sources have counterparts. The spurious identification rate, of course, is lower for brighter optical sources, with the XMM-ACS spurious identification rate dropping to less then 5% at , the magnitude limit considered for the visual morphological analysis discussed in §4.2.
| Sample | (″) | (″) | |||
|---|---|---|---|---|---|
| Radio | 2901 | 1440/1534 (94%) | 372/602 (62%) | ||
| X-ray | 1887 | 1117/1161 (96%) | 1360/1887 (72%) | ||
| Mid-IR | 1278 | 881/881 (100%) | 1238/1278 (97%) |
Note. — is the total number of sources in the public catalogs, lists the total and matched number of sources in the test region, and gives the total and matched number of sources in our main AGN samples. The final two columns list the mean positional offsets derived from the test region so that each catalog matches the ACS astrometric frame.
3.1 VLA-ACS
We construct two samples of radio AGN candidates in the COSMOS field. VLA1 consists of brighter sources, with flux densities greater than or equal to 1 mJy ( mJy). VLA2 consists of fainter sources, with flux densities of mJy. These cuts were motivated by Seymour et al. (2008) who, based on a detailed analysis of deep multiwavelength follow-up of faint radio sources in the 13H XMM-Newton/Chandra Deep Field Survey, show that virtually every 1.4 GHz radio source brighter than 1 mJy and the majority () of sources brighter than 0.3 mJy are AGN and not star-forming galaxies. The VLA catalog contains 602 sources with mJy. We cross match these sources to the entire ACS-GC catalog (320,293) and find 372 (62%) have optical counterparts within 1″. This relatively low counterpart fraction is due to a combination of the radio field-of-view being larger than the ACS field-of-view, as well as radio sources with complex radio morphologies. For example, approximately 30% of FIRST sources have resolved structure on scales of (Becker et al., 1995), with the classic example being a double-lobed radio source comprised of two radio-emitting lobes separated by up to a few Mpc straddling a host galaxy. Our simple positional matching scheme will find no (correct) identification for such a configuration and thus is likely responsible for our low identification fraction for the radio-selected AGN. There are 124 and 248 galaxies in the VLA1 and VLA2 samples, respectively.
3.2 XMM-ACS
The XMM-Newton catalog contains 1887 sources, of which 1387 (72%) have ACS counterparts within 3″. We identify 27 sources which are clearly Galactic stars ( and CLASS_STAR 0.9; see §3.4). Although this does not identify all of the Galactic stars in the XMM-Newton catalog, it does flag the brightest, least ambiguous Galactic sources. We thus have a total of 1360 XMM-Newton sources with ACS counterparts that are not bright, saturated stars. We construct two samples of X-ray sources. XMM1 consists of sources with soft (0.5-2.0 kev) X-ray fluxes erg cm-2 s-1 and the fainter sample, XMM2, consists of sources with erg cm-2 s-1. At the relatively shallow depth of the XMM-Newton COSMOS survey, it is expected that the vast majority of detected X-ray sources will be AGN (e.g., Eckart et al., 2006). There are 338 and 1022 sources in XMM1 and XMM2, respectively.
3.3 IRAC-ACS
We use the IRAC “wedge” (Stern et al., 2005) to select AGN candidates in the S-COSMOS data. This selection relies on the fact that while stellar populations fade longward of their 1.6 m peak, luminous AGNs exhibit red power-law emission throughout the mid-IR. This power-law, long-wavelength emission is relatively immune to gas and dust obscuration, making mid-IR selection sensitive to both obscured and unobscured luminous AGN (e.g., Lacy et al., 2004; Stern et al., 2005; Alonso-Herrero et al., 2006; Donley et al., 2007). However, this AGN selection technique fails for low-luminosity AGNs where the host galaxy contributes much of the mid-IR flux (e.g., Donley et al., 2007, 2008; Eckart et al., 2010). Note also that for extremely deep mid-IR data, the AGN color selection methods are contaminated by normal galaxies (e.g., Donley et al., 2008), though this should be a minimal effect for the bright mid-IR AGN samples considered here. In particular, Eckart et al. (2010) perform an X-ray stacking analysis of X-ray undetected, mid-IR-selected AGN from relatively shallow IRAC data. They find that such sources have, on average, significantly brighter and harder X-ray spectra than average mid-IR sources, consistent with the hypothesis that shallow mid-IR color selection identifies a population of predominantly obscured, high-luminosity AGN.
We find a total of 1278 AGN candidates which have [5.8] 16.5 (Vega), of which 1238 (97%) sources have ACS counterparts within 1″. We construct two samples of IRAC sources. IRAC1 consists of the brighter mid-IR AGN candidates, selected to the depth of the original IRAC Shallow Survey (Eisenhardt et al., 2004), the survey used to derive the empirical mid-IR criteria applied here (Stern et al., 2005). IRAC2 consists of a fainter sample, selecting candidates not already in IRAC1 but detected in all four IRAC bands down to the full depth of the Spitzer Deep, Wide-Field Survey (SDWFS) (Ashby et al., 2009). These criteria require robust () detections in all four IRAC bands. However, for the typical power-law source selected by the AGN wedge criteria, the detection limits are generally driven by the m band and correspond to flux density limits of Jy ([5.8] = 15.78, Vega) for IRAC1 and Jy (15.78 [5.8] 16.50, Vega) for IRAC2. There are 590 and 648 sources in the IRAC1 and IRAC2 samples, respectively.
3.4 Overlap between the AGN samples
These samples are not completely independent; sources classified as AGN candidates in one band are often classified as AGN candidates in another band. Studying a sample of AGN in the Boötes field, Hickox et al. (2009) find considerable overlap between their mid-IR and X-ray samples, while the radio-selected AGNs are distinct. We find similar results here, summarized in Table 2. When considering all AGNs, regardless of optical morphology, we find a modest overlap between sources identified as IRAC and X-ray AGN: we find of the IRAC AGN candidates have an XMM-Newton counterpart while of the XMM-Newton sources are also identified as AGN candidates from their mid-IR colors. These trends were also observed by Hickox et al. (2009), with 33%/50% cross identification for their IRAC-X-ray and X-ray-IRAC samples, respectively. We find less overlap between the radio and X-ray/IRAC samples, 4-16% for both. Only 23 sources are simultaneously identified as AGN using all three selection methods.
The simplest morphological classification is star–galaxy separation, or, rather, distinguishing unresolved sources (which might be Galactic stars or quasars) from resolved sources (typically galaxies). We use the SExtractor CLASS_STAR parameter to make this separation, with unresolved sources defined to have CLASS_STAR , and the remaining sources considered resolved. We now consider how this simple morphological criterion plays in with the overlap between the AGN samples.
The 23 sources simultaneously identified using all three AGN selection methods (e.g., X-ray bright, radio-loud AGN with mid-IR colors indicative of an AGN) are approximately evenly divided between optically extended sources (12) and optically unresolved sources (11). If we consider only those AGN with optically extended morphologies, we find the overlap between the AGN selection techniques is rather low: only 23% of optically resolved IRAC AGN candidates have XMM-Newton counterparts, and only 23% of optically resolved XMM-Newton sources have mid-IR colors indicative of AGN activity. Considering the VLA sample, only 14% of optically resolved radio sources have XMM-Newton counterparts, and only 11% of optically resolved radio sources have mid-IR colors indicative of AGN activity. This implies that to a large degree the various AGN selection techiques identify unique classes of AGNs.
The optically unresolved AGN show a very different trend altogether. Considering just the AGN with point source optical identifications, we find 71% of the IRAC sources have XMM-Newton counterparts and 57% of the XMM-Newton sources have IRAC counterparts. We also find that virtually all (19/22, or 86%) of the optically unresolved radio sources have an IRAC counterpart and 50% have an XMM-Newton counterpart. This implies that these sources represent similar classes of AGN, generally comprised of unobscured quasars. Note that we treat the AGN samples as independent populations in much of the following analysis, identifying morphological trends as a function of selection criterion and flux density. However, the reader is cautioned to keep in mind the overlap between the samples.
| Sample | Total | Radio | X-ray | Mid-IR | RadioX-rayMid-IR |
|---|---|---|---|---|---|
| Radio | 372 | 60 (16%) | 58 (16%) | 23 (6%) | |
| X-ray | 1360 | 60 (4%) | 463 (34%) | 23 (2%) | |
| Mid-IR | 1238 | 58 (5%) | 463 (37%) | 23 (2%) | |
| optically extended AGNs (CLASS_STAR ) | |||||
| Radio | 350 | 49 (14%) | 39 (11%) | 12 (3%) | |
| X-ray | 888 | 49 (5%) | 194 (22%) | 12 (1%) | |
| Mid-IR | 857 | 39 (5%) | 194 (23%) | 12 (1%) | |
| optically unresolved AGNs (CLASS_STAR ) | |||||
| Radio | 22 | 11 (50%) | 19 (86%) | 11 (50%) | |
| X-ray | 472 | 11 (2%) | 269 (57%) | 11 (2%) | |
| Mid-IR | 381 | 19 (5%) | 269 (71%) | 11 (3%) | |
Note. — The final column, RadioX-rayMid-IR, refers to AGN candidates identified by all three selection techniques.
4 Morphologies of Radio-, X-ray-, and Mid-IR-Selected AGN
In this section we describe two methods for investigating how host galaxy morphology correlates with AGN type. In 4.1 we use the Sérsic index to classify galaxies and find a large fraction of AGN hosts have high Sérsic values (), implying populations heavily dominated by bulge-dominated or early-type morphologies. However, in 4.2 we visually classify the brightest () galaxies in the sample and find that the X-ray and mid-IR populations are not dominated by early-type galaxies, but by disk galaxies. These results motivate the need for more complex quantitative methods for understanding these populations of galaxies. At the present time when the sample sizes are of order a few thousand, visual morphologies are still manageable. But as all-sky, high-resolution imaging surveys come online in the future, we will need to develop reliable and consistent algorithms for classifying these galaxies.
We note that surface brightness dimming could be an issue for the morphological assessments, making faint disks difficult to identify. However, this is not expected to be a significant concern, especially for the brighter sample with visual morphological classifications. Gabor et al. (2009) have done extensive simulations of how well morphological parameters are recovered in the presence of noise. These simulations, done as a function of galaxy mean surface brightness, show that morphological parameters for galaxies with mag arcsec-2 are recovered quite reliably and with no systematic offsets; e.g., Sérsic indices are recovered with (disk galaxies) and (spheroids) , and thus are unlikely to change the morphological classification of sources. At mag arcsec-2, these uncertainties are slightly higher, (disk galaxies) and (spheroids) . For the sample, 79% (88%) of AGN candidates have mag arcsec-2 ( mag arcsec-2). These brighter sources will largely allow for robust morphological classifications. Considering the full sample of AGN candidates, 63% (76%) of sources have mag arcsec-2 ( mag arcsec-2), with between 48% (IRAC2) and 90% (XMM1) of the various AGN subsamples having mean surface brightnesses mag arcsec-2 and between 67% (IRAC2) and 94% (XMM1) having mag arcsec-2. Therefore, though we expect the faintest galaxies to have uncertain morphological measurements, the brighter sources which dominate our various samples should allow for accurate morphological assessments and thus the statistical trends discussed below are expected to be robust.
4.1 Quantitative morphologies
The final COSMOS ACS-GC catalog contains 320,293 sources, which we use to quantitatively investigate the morphological characteristics of the AGN hosts. The GALAPAGOS analysis was performed prior to the AGN morphology investigation discussed herein, and hence we did not undertake any special procedures to account for potential contamination from a nuclear point source. In contrast, Gabor et al. (2009) analyzed 389 AGN candidates, simultaneously fitting an unresolved component with the resolved galaxy component. Using simulated images, Gabor et al. (2009) show that a nuclear point source can significantly bias the measurements of structural parameters. In practice, however, they find that only a small fraction of sources have a point source contribution significant enough to adversely effect the quantitative morphological parameters — specifically, only 7% of sources have a point source 3 mag fainter than the host galaxy. Pierce et al. (2010) found that AGNs which contribute 20% of the galaxy light can bias morphological measurements, making such systems appear bluer and more bulge dominated. Pierce et al. conclude that bulge-dominated, E/S0/Sa, and early-type morphology classifications are accurate for AGN host galaxies, unless the AGN manifests itself as a well-defined point source which can be flagged by inspecting the color images. With this in mind, this section discusses the automated, quantative morphological results for the AGN samples, while in 4.2 we also perform visual morphological classifications for the brightest galaxies in the sample, .
| Sample | IRAC1 | IRAC2 | XMM1 | XMM2 | VLA1 | VLA2 |
|---|---|---|---|---|---|---|
| 590 | 648 | 338 | 1022 | 124 | 248 | |
| point source | 257 (44%) | 124 (19%) | 189 (56%) | 283 (28%) | 8 (6%) | 14 (6%) |
| extended | 333 (56%) | 524 (81%) | 149 (44%) | 739 (72%) | 116 (94% ) | 234 (94%) |
| optically extended AGNs (CLASS_STAR ) | ||||||
| 4 (1%) | 13 (3%) | 1 (1%) | 12 (2%) | 1 (1%) | 5 (2%) | |
| 1.5 | 56 (17%) | 146 (28%) | 17 (11%) | 120 (16%) | 8 (7%) | 49 (21%) |
| 2.5 | 35 (11%) | 66 (13%) | 6 (4%) | 78 (11%) | 5 (4%) | 28 (12%) |
| 8 | 135 (41%) | 212 (41%) | 52 (35%) | 326 (44%) | 71 (61%) | 112 (48%) |
| 103 (31%) | 87 (17%) | 73 (49%) | 203 (28%) | 32 (28%) | 40 (17%) | |
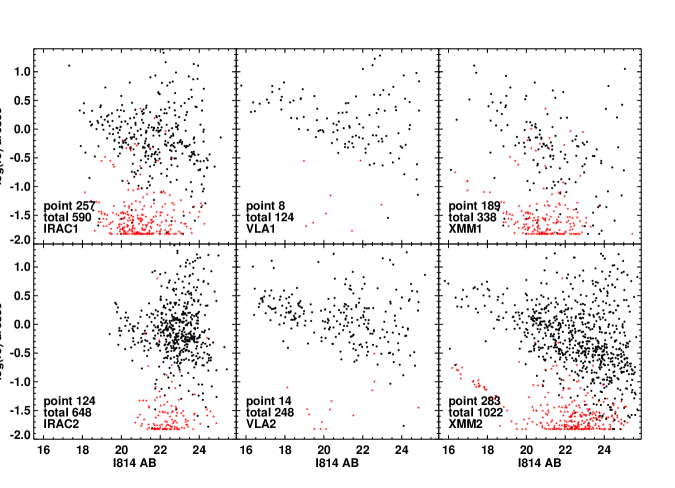
We derive the following quantitative parameters for the AGN host galaxies: half-light or effective radius (), Sérsic index (), apparent magnitude (MAG_BEST), and source stellarity index (CLASS_STAR). The first two are measured with GALFIT and the latter two are measured with SExtractor. The effective radius is the radius to which one half of the total light is emitted and is traditionally used to measure the size of a source. The Sérsic index is derived from the Sérsic (1968) profile and describes how the intensity of a source varies with distance from the center. The Sérsic profile represents a general form that encompasses both the exponential profile (), characteristic of disk galaxies, and the de Vaucouleurs profile (), characteristic of elliptical galaxies. We restrict the Sérsic index to be in the range . The stellarity index, which ranges from zero to one, separates compact sources (stars and quasars; CLASS_STAR 0.9) from extended galaxies (CLASS_STAR 0.9). Note that for stellar sources and compact galaxies, morphological parameters such as and are generally not reliable due to the sensitivity of the results to the assumed PSF.
| Sample | IRAC1 | IRAC2 | XMM1 | XMM2 | VLA1 | VLA2 |
|---|---|---|---|---|---|---|
| 444 | 238 | 280 | 458 | 81 | 188 | |
| point source | 228 (51%) | 70 (29%) | 172 (61%) | 150 (33%) | 7 (9%) | 11 (6%) |
| extended | 216 (49%) | 168 (71%) | 108 (39%) | 308 (67%) | 74 (91%) | 177 (94%) |
| optically extended AGNs (CLASS_STAR 0.9) | ||||||
| 1 (1%) | 4 (2%) | 1 (1%) | 1 (0%) | 1 (1%) | 1 (1%) | |
| 1.5 | 40 (19%) | 58 (35%) | 9 (8%) | 39 (13%) | 4 (5%) | 44 (25%) |
| 2.5 | 25 (12%) | 17 (10%) | 5 (5%) | 29 (9%) | 2 (3%) | 26 (15%) |
| 8 | 81 (38%) | 71 (42%) | 36 (33%) | 175 (57%) | 54 (73%) | 88 (50%) |
| 69 (32%) | 18 (11%) | 58 (54%) | 65 (21%) | 14 (19%) | 19 (11%) | |
 |
 |
 |
IRAC1 has a roughly equal number of point sources and extended sources (44/56%) while IRAC2, the fainter mid-IR AGN sample, is dominated by extended sources (81%). We find a similar trend for the X-ray sources with a roughly equal numbers of point sources and extended sources (56/44%) in XMM1 while XMM2 is dominated by extended sources (72%). The radio sample is quite different, with extended sources dominating (94%) both subsamples. Figure 2 plots size versus magnitude for the six samples. We observe that the VLA samples have overall larger sizes as well as brighter magnitudes as compared to the IRAC and X-ray samples. XMM2 also appears to have more faint optical counterparts, potentially due to contamination from spurious sources, which are expected to contribute 25% of the identifications at 24.5.
The size-magnitude relationship has traditionally been used to distinguish extended galaxies (e.g., normal and low surface brightness galaxies), compact galaxies and stellar-like objects. Quasars, stars, and compact galaxies populate the stellar locus and have high stellarity values. Figure 2 shows several surprising examples of sources with high stellarity that are also spatially extended. In order to understand these sources, we visually inspected a sample of 39 sources with CLASS_STAR 0.9 and . A majority of these sources have large residuals when the best fit morphological model is subtracted, implying that the galaxy model and the true galaxy image are not consistent and that the galaxy structural parameters are thus unreliable. A few (9 or 23%) of these sources are extended galaxies hosting a bright point source (e.g., §5.1). For the following analysis, we remove all sources with CLASS_STAR 0.9 due to the uncertainties in their structural parameters.
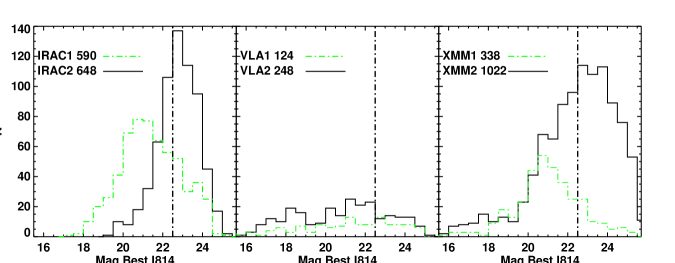
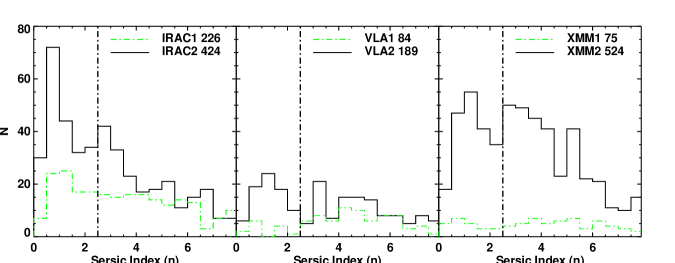
We divide the extended sources into five bins using the Sérsic index, with two of these bins being the boundary of our Sérsic models ( and ; see Tables 3 and 4, and Fig. 3). The other three bins are , comprised of late-type and spiral galaxies, , comprised of galaxies which have blended morphologies (i.e., bulge + disk), and , generally comprised of elliptical or early-type galaxies. We visually inspected the 32 spatially-extended sources which have and find that these sources are very low surface brightness galaxies with disturbed morphologies. Galaxies that have values which reach the boundaries are generally removed from further analysis. For , this will not significantly affect the results as such sources only contribute between 1% and 2% of the total samples. Eliminating sources will certainly affect the overall statistics for the samples, with between 17% (IRAC2) and 49% (XMM1) of the spatially extended samples having . For the extreme example of the XMM1 sample, fully 78% of the sources are either unresolved or have Sérsic index .
On the other hand, were we to we combine the sources with the sources, we would find a misleading overabundance of early-type morphologies. AGN host galaxies comprise a very broad range of morphological types ranging from morphologically “normal” galaxies which include elliptical and spiral galaxies to merging systems with complicated structural components. Some galaxy structures are not easily fit with single component models and hence return spurious results; these galaxies must be classified using different methods. We see that even when host galaxies are considered distinct, the AGN hosts are still often classified as bulge-dominated galaxies. The radio samples have the largest such percentages, with VLA1 (VLA2) comprised of 61% (48%) early-type host galaxies (). The mid-IR and X-ray AGN samples have 40% bulge-dominated galaxies for both the faint and bright samples. Late-type morphologies () range from 7% for the VLA1 sample to 28% for the IRAC2 sample. Blended galaxies () constitute 10% of all of the samples.
Figure 3 (top) shows the magnitude distribution for our six samples; the brighter samples are shown by green dashed lines. We find that the optical flux densities roughly correlate with both the X-ray and mid-IR fluxes: XMM1 and IRAC1 optical magnitudes are systematically brighter, with the peak of the distribution around , while the XMM2 and IRAC2 are systematically fainter by about two magnitudes. The radio sample does not show any correlation between the optical and radio flux densities, implying that the radio-selected AGN must sample a broad distribution of Eddington ratios.
4.2 Visual morphologies
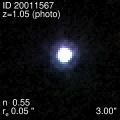
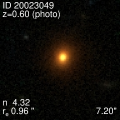
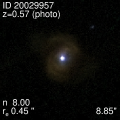
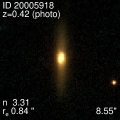
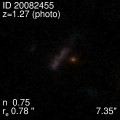
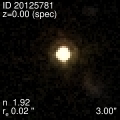
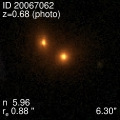
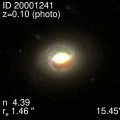
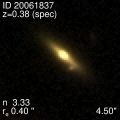
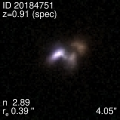
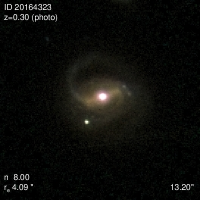
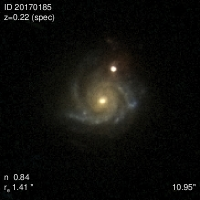
We also measured visual morphologies for the 1290 (unique) AGN candidates with . Visual morphologies were performed on pseudocolor images constructed by P. Capak (private communication) using the ACS data as an illumination map and deep Subaru , , and images as a color map. To achieve this, each Subaru image was divided by the average of the three Subaru images and then multiplied by the ACS image. This preserves the flux ratio between images while replacing the overall illumination pattern with the data. Each image was then divided by to enhance the color difference between star-forming and passive galaxies. The processed , , and images were then assigned to the blue, green, and red channels, respectively. The resulting images have the high spatial resolution of the ACS imaging but color gradients at ground-based resolution. Visual classifications were performed independently by the two authors, and our independent analysis agreed for the majority (84%) of the sources. For the remaining 210 sources where the initial independent analysis did not initially agree, we reviewed the sources together and assigned a consensus morphology. Such sources tended to be red galaxies with S0 morphologies. We split the sample into five morphological types (see Figure 4): point sources, bulge-dominated galaxies, disk galaxies, S0 galaxies, and other:
|
|
point sources — compact point sources with no extended structural components. These include bright quasars and Galactic stars;
bulge-dominated galaxies — elliptical galaxies which are dominated by a bulge and lack a disk component;
disk galaxies — galaxies comprised of a wide range of types (e.g., Sa thru Sc), all hosting a clear disk component (though not necessarily disk-dominated);
S0 galaxies — early-type galaxies which have an extended disk component and red colors (this classification has some overlap with the disk classification and, in fact, is where many of the independent morphological visual classifications disagreed; however, S0 galaxies are distinguished by their lack of spiral structure in the disk component, as well as their strong bulge component); and
other — disturbed morphologies or morphologies which cannot be easily classified.
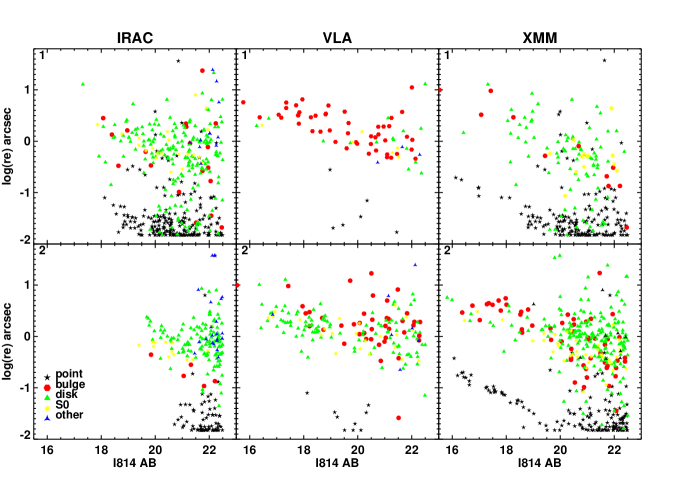 |
Figure 4 shows ten representative color images of classified galaxy morphologies. It also motivates the need for visual morphologies of these types of galaxies. We can see that seven out of ten of these sources would have been classified as bulge-dominated early-type galaxies from Sérsic indices alone (e.g., ). Two of these sources would have been classified as late-type galaxies or disk galaxies, one of which is a point source with an unreliable Sérsic index. The other point source would have been classified as bulge+disk. The S0 galaxies are usually included in the , bulge-dominated sample, while the visual inspection allows this unique class to be robustly identified. For galaxies not dominated by a bright, compact nucleus, the quantitative morphologies generally agree with the visual morphologies. Figure 5 plots magnitude versus size as a function of visual type and AGN subsample (similar to Fig. 2, except coded by visual morphology rather than CLASS_STAR). We present the results of the visual morphological classifications in Table 5.
Visually classifying these galaxies allows us to split the sample into more discrete morphological bins rather than the three offered by the Sérsic index. For example, sources which were classified as bulge-dominated, early-type galaxies due to a high Sérsic index are often classified as disk galaxies visually. From Table 5 we can see that IRAC1 and XMM1 have high fractions of point sources (47% and 61%, respectively), low fractions of bulge/early-type galaxies (4% for both), and large fractions of disk-dominated galaxies (41% and 31%, respectively). IRAC2 and XMM2 have slightly lower fractions of point sources (30% and 31%, respectively) and larger fractions of disk galaxies (53% and 46%, respectively). IRAC2 has very few (2%) bulge/early-type galaxies, while aside from the VLA samples, XMM2 has the largest fraction (12%) of bulge/early-type galaxies. VLA1 has the largest fraction (59%) of bulge/early-type galaxies. This sample also has a large fraction (22%) of disk galaxies. VLA2 is dominated by disk galaxies (57%) and 22% of these sources are classified as bulge/early-type galaxies. The S0 and other classification contribute small percentages to all of the samples.
| Sample | IRAC1 | IRAC2 | XMM1 | XMM2 | VLA1 | VLA2 |
|---|---|---|---|---|---|---|
| 444 | 238 | 280 | 458 | 81 | 188 | |
| point source | 209 (47%) | 72 (30%) | 175 (61%) | 147 (31%) | 6 (7%) | 9 (5%) |
| bulge/early-type | 19 (4%) | 5 (2%) | 11 (4%) | 55 (12%) | 48 (59%) | 42 (22%) |
| disk/late-type | 184 (41%) | 127 (53%) | 86 (31%) | 211 (46%) | 18 (22%) | 108 (57%) |
| S0 | 21 (5%) | 13 (6%) | 13 (5%) | 39 (9%) | 6 (7%) | 22 (12%) |
| other | 11 (3%) | 21 (9%) | 0 (0%) | 9 (2%) | 3 (4%) | 7 (4%) |
Comparing the results from the visual classifications (Table 5) to the quantitative classifications (Table 4, for the sample) shows a large discrepancy. We see that the point sources are identified equally well using either quantitative morphologies or visual classifications, while the late-type and early-type classifications often differ considerably. Quantitatively, we find an overabundance of bulge-dominated galaxies while our visual classification shows that a large fraction of the galaxies are actually disk galaxies. AGN host galaxies comprise a very small fraction of the total galaxy sample, but these results indicate that more complex methods in analyzing such galaxies are required.
5 Interesting Sources
While visually inspecting the COSMOS AGN candidates for this analysis — both the magnitude-limited inspections in §4.2 as well as considering outliers in §4.1 — we identified a number of peculiar or rare AGN candidates, discussed here. We find a small class of AGN hosted by face-on disk galaxies with compact, bright nuclear sources (§5.1). We find several galaxies which appear to host two or more nuclear point sources (§5.2). Such sources are likely candidates for the late stages of the merger of two SMBHs, such as the COSMOS dual AGN confirmed in Comerford et al. (2009a, see also Civano et al. 2010). We identify several AGN host galaxies which appear to contain an offset bright point source (§5.3). These sources may represent earlier phases of SMBH mergers, but might also be supernovae or chance superpositions. We also identify a handful of lensed AGN candidates, or otherwise interesting sources (§5.4).
5.1 Disk galaxies with a compact nucleus
|
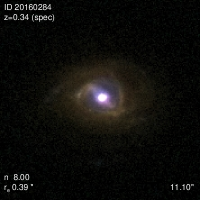
We visually identify 41 galaxies which appear to host a stong, compact nucleus, suggestive of an unobscured AGN (see Table 6). We find 34/27/4 such systems identified using X-ray/IRAC/radio criteria, respectively, with several sources identified using multiple criteria. In particular, 20 of these sources were identified from both IRAC and X-ray criteria and one source was identified using all three selection criteria (ID 20160284; Fig. 6 left). This last source was classified as a quasar by SDSS, and shows broad H and H emission lines as well as narrow [O III] emission lines. These galaxies generally represent a population of galaxies known as Seyfert galaxies, presumably type 1 Seyferts based on the strong, nuclear cores; however, spectra are required to distinguish them as type 1 or type 2. The rarity of these systems implies that the unobscured AGN phase in most galaxies happens within a very rapid timescale, e.g., the theoretical model of Hopkins et al. (2006) suggests that the observable lifetime for a bright optical quasar is years, while the Seyfert-like galaxies identified here appear to have lower nuclear luminosities than bright quasars.
| ID | RA | Dec | AGN Type | |||
|---|---|---|---|---|---|---|
| 20001881 | 150.1731933 | 1.6163286 | 0.57 | 19.51 | 4 | |
| 20018586 | 149.9741093 | 1.6434971 | 1.03 | 1.11 | 20.78 | 9 |
| 20029957 | 150.5394505 | 1.9236122 | 0.57 | 19.63 | 1 | |
| 20033437 | 150.3272416 | 1.9285469 | 0.57 | 20.19 | 5 | |
| 20038068 | 150.1391437 | 1.8769805 | 1.41 | 20.39 | 1 | |
| 20040478 | 150.0249868 | 1.9147607 | 0.94 | 20.65 | 9 |
Note. — Coordinates are J2000. is the SExtractor MAG_BEST magnitude (AB system). AGN Type indicates which sample(s) each source comes from: +1 - IRAC1, +2 - IRAC2, +4 - XMM1, +8 - XMM2, +16 - VLA1, and +32 - VLA2. The full list of 41 sources is provided as an on-line table.
5.2 Dual/multiple nuclei AGN
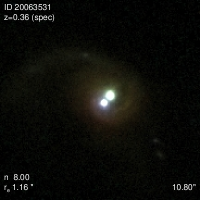
|
According to hierarchical galaxy formation theory, massive galaxies assemble through the merging of smaller galactic components, with smaller galaxies forming first and then merging into successively larger bodies. It is also believed that SMBHs appear to reside at the centers of most massive galaxies (Kormendy & Gebhardt, 2001). Given this picture, we should often find two or more SMBHs in the process of merging. These merging SMBHs will initially be widely separated (1 kpc) “dual” SMBHs. After 100 Myr they will become true binary SMBHs, gravitationally bound to one another with parsec-scale separations; the merging into a single central SMBH happens over much longer timescales (Begelman et al., 1980) and is expected to be a major source of gravitational waves. Hopkins et al. (2006) find that the merging of two equal mass, gas rich systems can produce or accentuate AGN or quasar activity. Though these systems should be commonly observed, only a few cases have been discovered to date.
The classic example of a nearby dual AGN is NGC 6240 (Komossa et al., 2003) which has two SMBHS spatially resolved by Chandra. To date, the most common method for detecting and identifying dual AGN has been spectroscopically, in which multiple high-ionization state, narrow emission lines are observed in a single AGN (e.g., Gerke et al., 2007; Comerford et al., 2009b; Xu & Komossa, 2009).
Another method for finding these systems is with the use of high resolution imaging. By spatially resolving multiple nuclei within a single galaxy, this method has the ability to conclusively demonstrate that multiple emission lines in a spectrum are not due to complex kinematics within a single AGN. However, spectroscopy is also required in order to demonstrate that the multiple nuclei are not chance superpositions and that both are, indeed, active. Comerford et al. (2009a) reports the discovery of a dual AGN galaxy in the COSMOS field which shows two bright point sources residing at the center of a merger remnant spiral galaxy (J100043.15+020637.2; Fig. 7, left). The physical separation between the nuclei is 0.5″, or 2.5 kpc at the redshift of the galaxy, . In addition to the Hubble imaging, observations from Keck, zCOSMOS, SDSS, XMM-Newton, Spitzer, and the VLA fortify the evidence for AGN activity in this galaxy (see also Civano et al., 2010). The discovery of this source has motivated us to visually search and identify other potential candidates for dual AGN activity, and we present three such candidates in Figure 7. See Madsen et al. (in prep.) for Keck spectroscopic observations of these candidates.
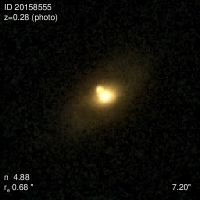
5.3 Offset AGN candidates
|
AGNs are not required to reside at the centers of galaxies and some can be found offset from the galaxy center. Barth et al. (2008) report on the discovery of a triplet of emission-line nuclei in the disturbed galaxy NGC 3341. It is expected that minor mergers can also trigger episodes of nuclear activity (Hernquist & Mihos, 1995) with multiple AGN present in some minor mergers so long as the secondary galaxies also harbor SMBHs. NGC 3341 appears to contain two dwarf galaxies merging with a massive disk galaxy. One of the dwarf galaxies has a Seyfert 2 spectrum, while the other dwarf galaxy appears to have a LINER spectrum. The primary nucleus appears to indicate low-level AGN activity, making this a good candidate for a dual, or even a triple, AGN. Figure 8 shows three examples of galaxies which host an offset source. The bright, offset sources (often unresolved) could be explained in one of three ways: (i) a supernova explosion in a spiral arm, (ii) chance superposition, or (iii) an offset AGN, potentially triggered by a minor merger. Spectroscopy and/or multi-epoch, high-resolution imaging is required to distinguish between these interpretations.
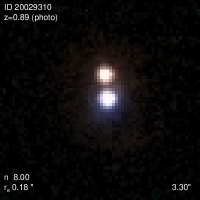
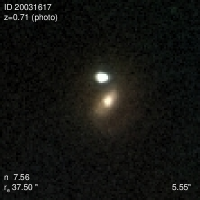
5.4 AGN lens candidates
|
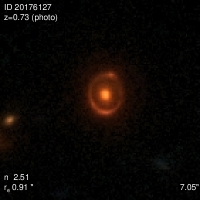
We also find three AGN with peculiar morphologies suggestive of gravitational lensing. Lensed systems always provide the potential for measuring the mass of the lensing galaxy. However, since AGN typically are time variable systems, rare lensed AGN systems provide an additional cosmological probe through time delays (e.g., Schechter et al., 1997). COSMOS 100038.28+024133.8 (object 20176127; Fig. 9, left), which is a weak radio source, appears to be a 1.2″ diameter Einstein ring. In fact, the source was not included in the VLA AGN candidate sample (§3.1) since its radio flux density is below 0.3 mJy and thus is potentially due to processes related to star formation rather than nuclear activity. This source was also identified in Faure et al. (2008) as one of 67 galaxy-galaxy strong lens candidates in the COSMOS field.
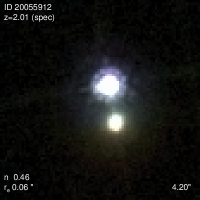
Cross-correlating the XMM-Newton archive with the SDSS third data release (DR3) quasar catalog (Schneider et al., 2005), Young et al. (2008) identified SDSS J100201.50+020329.4 (object 20055912; Fig. 9, middle) as one of only 17 moderate-redshift () quasars with extremely red optical colors (). They attempt to use the optical and X-ray data to discern whether the red colors are caused by an unusual intrinsic continuum or by dust reddening. Based on the moderately flat X-ray spectrum of SDSS J1002+0203 () but relatively low level of dust reddening inferred from the optical spectroscopy, Young et al. (2008) classify this source as having an intrinsically red AGN continuum. They further suggest that the different physics of AGN with low accretion rates might be responsible for the unusually red color. The low spatial resolution of the SDSS imaging, however, misses the nearby companion, offset by 0.8″ to the SSW, which is clearly visible in the COSMOS Hubble imaging. This presumably foreground galaxy undoubtedly affects the SDSS photometry of the quasar. However, assuming that the second object is a foreground early-type galaxy with minimal gas or dust, it would not affect the X-ray spectrum of the quasar. The foreground galaxy would also presumably be lensing the background quasar at some level (though not strongly, since no counterimages are evident). It would be interesting to obtain high-resolution images of other quasars in the Young et al. (2008) sample to see if they could also be explained by chance superpositions and source blending in the SDSS photometry rather than unusual AGN continua.
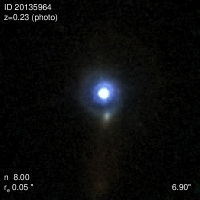
Finally, COSMOS 100232.13+023537.3 (object 20135964; Fig. 9, right) presents a very unusual morphology with a blue unresolved core surrounded by a 1.4″ diameter ring-like structure with a southern extension. This AGN candidate is one of only 23 (out of 2413) AGN candidates selected independently by all three selection criteria. The structure is initially suggestive of a gravitational lens, albeit with the atypical configuration of the quasar being the lens, not the lensed background source (e.g., Courbin et al., 2010). However, a recent spectrum obtained with the Low Resolution Imaging Spectrograph (LRIS; Oke et al., 1995) on the Keck I telescope reveals that both the quasar and the southern knot are at the same redshift, implying that the unusual morphology is due to merger activity and not gravitional lensing.
6 Discussion
In this paper, we use the ACS-GC data set in combination with radio, X-ray, and mid-IR imaging in the COSMOS field to investigate the morphological diversity of AGN host galaxies. We utilize high resolution images obtained with the Hubble ACS instrument to both quantitatively (GALFIT) and qualitatively (visually, to ) segregate our AGN sample into discrete morphological bins. We use the radio, X-ray, and mid-IR imaging to select our AGN candidates and separate the samples into six categories, two per wavelength and split by flux density in the AGN selection band.
We investigate the overlap between the AGN samples and find significant overlap for the unresolved AGN candidates. The majority of the unresolved radio AGN are also selected by either X-ray emission or mid-IR colors, and there is also considerable overlap between the X-ray and mid-IR unresolved sources. However, only a small fraction () of the unresolved AGN selected in the X-rays or mid-IR are selected as radio AGN, consistent with a minority fraction of AGN being radio loud. Only a small fraction of the optically resolved AGN samples are identified using multiple techniques.
The radio-selected AGN are the most distinct population, with a relatively low incidence of unresolved optical morphologies, e.g., classical quasars (). In contrast, approximately half of the bright X-ray and mid-IR selected AGN samples are optically unresolved (ranging from 44% to 61%), and nearly a third of the fainter X-ray and mid-IR selected AGN samples are optically unresolved (ranging from 19% to 33%). The broad band spectral energy distributions of quasars are typically dominated by nuclear emission, and such systems are generally believed to be emitting near their Eddington limit (e.g., Kollmeier et al., 2006). This is consistent with the correlations between optical brightness and X-ray and mid-IR brightness that we observe in Fig. 3 for the X-ray and mid-IR samples. In contrast, the radio-selected AGN show no correlation between their optical and radio brightnesses, suggesting that such sources represent AGN accreting at a range of Eddington ratios and experience SMBH accretion mechanisms distinct from the quasars.
From our visual classifications, we find that the brighter radio-selected AGN generally (59%) reside in bulge-dominated, early-type galaxies, consistent with a literature that stretches back nearly 50 years (Matthews et al., 1964; Pentericci et al., 2001; Best et al., 2005). Fainter radio sources, however, preferentially (57%) reside in disk galaxies. Note, however, that the two highest fractions of bulge-dominated hosts are consistently the two radio samples. The X-ray and mid-IR AGN samples are most likely to be associated with point sources or disk galaxies, with such identifications accounting for between 77% and 92% of the samples. For the brighter X-ray and mid-IR samples, point source identifications are more common, while the fainter X-ray and mid-IR samples are more likely to be hosted by disk galaxies. The fraction of these samples associated with early-type or S0 galaxies is low, accounting for of the mid-IR selected samples and a similar fraction for the bright X-ray sample. In contrast, the fainter X-ray sample has a much higher rate of being hosted by early-type or S0 galaxies, 21%.
These morphological results are consistent with Hickox et al. (2009), who studied the colors, luminosities, and clustering of AGN selected by different criteria. Hickox et al. (2009) find radio-selected AGN tend to reside in luminous red sequence galaxies, are strongly clustered, and have low Eddington ratios. This is consistent with our result that radio-selected AGN are the most likely to have elliptical or early-type morphologies. Hickox et al. (2009) find X-ray selected AGN reside in less clustered environments, have higher Eddington ratios than radio AGN, and preferentially occupy the “green valley” of color-magnitude space. For mid-IR selected AGNs, Hickox et al. (2009) find them to be weakly clustered, have Eddington ratios similar to X-ray AGN, and to reside in slightly bluer, less luminous galaxies (e.g., reside in the “blue cloud”). Our morphological analysis, considering samples selected over a wider redshift range and from a deeper survey, support these results. We find that the X-ray and mid-IR AGN candidates broadly share similar morphologies, though the X-ray AGN, particularly the fainter X-ray AGN, have a much higher incidence of being hosted by early-type or S0 galaxies. In the general framework where AGN activity marks or regulates the transition from late-type galaxies into massive, red sequence galaxies, this work suggests a statistical chronological progression from mid-IR selected AGN to X-ray selected AGN, both often accreting at near Eddington rates, to eventual residence on the red sequence where smaller bursts of nuclear activity are at non-Eddington rates and associated with radio emission.
We have investigated the morphological properties of a large sample of AGN, and analyzed how these morphologies depend on how the AGN were selected. A more detailed analysis attempting to more firmly place these results within the context of galaxy formation and evolution would require (near-) complete spectroscopic data for both the AGN and their non-active counterparts, work that is actively being done in the COSMOS field. Spectroscopy would allow us to confirm the nuclear activity through emission line diagnostics, split the samples between unobscured and obscured AGN, as well as investigate evolutionary trends. We include the morphological classifications of this large data set in the Appendix to support that future work.
Appendix A Electronic Catalog of AGN Candidates
We include two large electronic catalogs: Table 7 provides the morphological information for the full sample of 2413 AGN candidates discussed in this paper. Table 8 provides useful phomometric and spectroscopic information for the same sources.
| ID | RA | Dec | CLASS_STAR | (″) | VIS | AGN Type | ||
|---|---|---|---|---|---|---|---|---|
| 20000085 | 150.7105669 | 1.6054066 | 0.00 | 20.19 | 0.64 | 0.24 | B | 32 |
| 20000120 | 150.6741353 | 1.5972655 | 0.03 | 21.01 | 0.38 | 0.83 | B | 8 |
| 20000338 | 150.7121413 | 1.5881418 | 0.00 | 23.72 | 8.16 | 5.24 | 1 | |
| 20000360 | 150.6680447 | 1.6164943 | 0.03 | 19.99 | 3.56 | 7.99 | B | 8 |
| 20000364 | 150.6854324 | 1.6159961 | 0.00 | 21.80 | 1.02 | 2.23 | B | 1 |
| 20000417 | 150.6238949 | 1.6036156 | 0.03 | 20.72 | 0.67 | 4.17 | B | 8 |
Note. — Coordinates are J2000. is the SExtractor MAG_BEST magnitude (AB system). VIS lists the visual morphological classification for sources brighter than : A = bulge-dominated, B = disk, C = unresolved (point source), D = S0, and E = other. AGN Type indicates which sample(s) each source comes from: +1 - IRAC1, +2 - IRAC2, +4 - XMM1, +8 - XMM2, +16 - VLA1, and +32 - VLA2. The full list of 2413 sources is provided as an on-line table.
| ID | [3.6] | [4.5] | [5.8] | [8.0] | ||||||
|---|---|---|---|---|---|---|---|---|---|---|
| 20000085 | 0.34 | 0.62 | ||||||||
| 20000120 | -0.15 | 3.37 | 2.44 | 0.65 | ||||||
| 20000338 | 17.30 | 16.26 | 15.17 | 14.02 | 1.96 | |||||
| 20000360 | 0.19 | 0.96 | -0.46 | 0.37 | 0.38 | |||||
| 20000364 | 16.34 | 15.87 | 15.38 | 14.35 | 1.02 | |||||
| 20000417 | -0.14 | 0.75 | 1.28 | 0.98 |
Note. — IRAC magnitudes are in the Vega system. XMM-Newton flux densities (, and , in the keV, keV and keV bands, respectively) are in units of . Radio flux densities at 1.4 GHz () are in units of mJy. The full list of 2413 sources is provided as an on-line table.
References
- Alonso-Herrero et al. (2006) Alonso-Herrero, A. et al. 2006, ApJ, 640, 167
- Ashby et al. (2009) Ashby, M. L. N. et al. 2009, ApJ, 701, 428
- Barth et al. (2008) Barth, A. J., Bentz, M. C., Greene, J. E., & Ho, L. C. 2008, ApJ, 683, L119
- Becker et al. (1995) Becker, R. H., White, R. L., & Helfand, D. J. 1995, ApJ, 450, 559
- Begelman et al. (1980) Begelman, M. C., Blandford, R. D., & Rees, M. J. 1980, Nature, 287, 307
- Bertin & Arnouts (1996) Bertin, E. & Arnouts, S. 1996, A&AS, 117, 393
- Best et al. (2005) Best, P. N., Kauffmann, G., Heckman, T. M., Brinchmann, J., Charlot, S., Ivezić, Ź., & White, S. D. M. 2005, MNRAS, 362, 25
- Cappelluti et al. (2009) Cappelluti, N. et al. 2009, A&A, 497, 635
- Civano et al. (2010) Civano, F. et al. 2010, ApJ, submitted (astro-ph/1003.0020)
- Comerford et al. (2009a) Comerford, J. M., Griffith, R. L., Gerke, B. F., Cooper, M. C., Newman, J. A., Davis, M., & Stern, D. 2009a, ApJ, 702, L82
- Comerford et al. (2009b) Comerford, J. M. et al. 2009b, ApJ, 698, 956
- Courbin et al. (2010) Courbin, F., Tewes, M., Sluse, D., Meylan, G., Djorgovski, S. G., Mahabal, A., & Rerat, F. 2010, ApJ, submitted (astro-ph/1002.4991)
- Donley et al. (2008) Donley, J. L., Rieke, G. H., Pérez-González, P. G., & Barro, G. 2008, ApJ, 687, 111
- Donley et al. (2007) Donley, J. L., Rieke, G. H., Pérez-González, P. G., Rigby, J. R., & Alonso-Herrero, A. 2007, ApJ, 660, 167
- Eckart et al. (2010) Eckart, M. E., McGreer, I. D., Stern, D., Harrison, F. A., & Helfand, D. J. 2010, ApJ, 708, 584
- Eckart et al. (2006) Eckart, M. E., Stern, D., Helfand, D. J., Harrison, F. A., Mao, P. H., & Yost, S. A. 2006, ApJS, 165, 19
- Eisenhardt et al. (2004) Eisenhardt, P. R. et al. 2004, ApJS, 154, 48
- Faure et al. (2008) Faure, C. et al. 2008, ApJS, 176, 19
- Fazio et al. (2004) Fazio, G. G. et al. 2004, ApJS, 154, 10
- Ferrarese & Merritt (2000) Ferrarese, L. & Merritt, D. 2000, ApJ, 539, L9
- Gabor et al. (2009) Gabor, J. M. et al. 2009, ApJ, 691, 705
- Gebhardt et al. (2000) Gebhardt, K. et al. 2000, ApJ, 539, L13
- Georgakakis et al. (2009) Georgakakis, A. et al. 2009, MNRAS, 397, 623
- Gerke et al. (2007) Gerke, B. F. et al. 2007, ApJ, 660, L23
- Giavalisco et al. (2004) Giavalisco, M. et al. 2004, ApJ, 600, L93
- Hasinger et al. (2007) Hasinger, G. et al. 2007, ApJS, 172, 29
- Häussler et al. (2007) Häussler, B. et al. 2007, ApJS, 172, 615
- Hernquist & Mihos (1995) Hernquist, L. & Mihos, J. C. 1995, ApJ, 448, 41
- Hickox et al. (2009) Hickox, R. C. et al. 2009, ApJ, 696, 891
- Hopkins et al. (2006) Hopkins, P. F., Hernquist, L., Cox, T. J., Di Matteo, T., Robertson, B., & Springel, V. 2006, ApJS, 163, 1
- Kauffmann et al. (2003) Kauffmann, G. et al. 2003, MNRAS, 346, 1055
- Koekemoer et al. (2007) Koekemoer, A. M. et al. 2007, ApJS, 172, 196
- Kollmeier et al. (2006) Kollmeier, J. et al. 2006, ApJ, 648, 128
- Komossa et al. (2003) Komossa, S., Burwitz, V., Hasinger, G., Predehl, P., Kaastra, J. S., & Ikebe, Y. 2003, ApJ, 582, L15
- Kormendy & Gebhardt (2001) Kormendy, J. & Gebhardt, K. 2001, in American Institute of Physics Conference Series, Vol. 586, 20th Texas Symposium on relativistic astrophysics, ed. J. C. Wheeler & H. Martel, 363–381
- Kormendy & Richstone (1995) Kormendy, J. & Richstone, D. 1995, ARA&A, 33, 581
- Lacy et al. (2004) Lacy, M. et al. 2004, ApJS, 154, 166
- Magorrian et al. (1998) Magorrian, J. et al. 1998, AJ, 115, 2285
- Marconi & Hunt (2003) Marconi, A. & Hunt, L. K. 2003, ApJ, 589, L21
- Matthews et al. (1964) Matthews, T. A., Morgan, W. W., & Schmidt, M. 1964, ApJ, 140, 35
- Oke et al. (1995) Oke, J. B., Cohen, J. G., Carr, M., Cromer, J., Dingizian, A., Harris, F. H., Labrecque, S., Lucinio, R., Schaal, W., Epps, H., & Miller, J. 1995, PASP, 107, 375
- Peng et al. (2002) Peng, C. Y., Ho, L. C., Impey, C. D., & Rix, H. 2002, AJ, 124, 266
- Pentericci et al. (2001) Pentericci, L., McCarthy, P., Röttgering, H. J. A., Miley, G. K., van Breugel, W. J. M., & Fowbury, R. 2001, 135, 63
- Pierce et al. (2010) Pierce, C. M. et al. 2010, MNRAS, iun press(astro-ph/1002.2365)
- Rieke et al. (2004) Rieke, G. H. et al. 2004, ApJS, 154, 25
- Sanders et al. (2007) Sanders, D. B. et al. 2007, ApJS, 172, 86
- Schechter et al. (1997) Schechter, P. L. et al. 1997, ApJ, 475, L85+
- Schinnerer et al. (2007) Schinnerer, E. et al. 2007, ApJS, 172, 46
- Schneider et al. (2005) Schneider, D. P. et al. 2005, AJ, 130, 367
- Scoville et al. (2007) Scoville, N. et al. 2007, ApJS, 172, 38
- Sérsic (1968) Sérsic, J. L. 1968, Atlas de galaxias australes, ed. J. L. Sérsic
- Seymour et al. (2008) Seymour, N. et al. 2008, MNRAS, 386, 1695
- Stern et al. (2000) Stern, D. et al. 2000, AJ, 132, 1526
- Stern et al. (2005) —. 2005, ApJ, 631, 163
- Xu & Komossa (2009) Xu, D. & Komossa, S. 2009, ApJ, 705, 20
- York et al. (2000) York, D. G. et al. 2000, AJ, 120, 1579
- Young et al. (2008) Young, M., Elvis, M., & Risaliti, G. 2008, ApJ, 688, 128