Detectability of Exoplanets in the Beta Pic Moving
Group with the Gemini Planet Imager
Abstract
We model the detectability of exoplanets around stars in the Beta Pic Moving Group (BPMG) using the Gemini Planet Imager (GPI), a coronagraphic instrument designed to detect companions by imaging. Members of the BPMG are considered promising targets for exoplanet searches because of their youth ( MY) and proximity (median distance pc). We wrote a modeling procedure to generate hypothetical companions of given mass, age, eccentricity, and semi-major axis, and place them around BPMG members that fall within the V-band range of the GPI. We count as possible detections companions lying within the GPI’s field of view and H-band fluxes that have a host-companion flux ratio placing them within its sensitivity. The fraction of companions that could be detected depends on their brightness at 12 Myr, and hence formation mechanism, and on their distribution of semi-major axes. We used brightness models for formation by disk instability and core-accretion. We considered the two extreme cases of the semi-major axis distribution - the log-normal distribution of the nearby F and G type stars and a power-law distribution indicated by the exoplanets detected by the radial velocity technique. We find that the GPI could detect exoplanets of all the F and G spectral type stars in the BPMG sample with a probability that depends on the brightness model and semi-major axis distribution. At spectral type K to M1, exoplanet detectability depends on brightness and hence distance of the host star. GPI will be able to detect the companions of M stars later than M1 only if they are closer than 10 pc. Of the four A stars in BPMG sample, only one has V-band brightness in the range of GPI; the others are too bright.
1 Introduction
The primary goal of the Gemini Planet Imager (GPI), a coronagraphic instrument under construction for the Gemini Observatory (Graham et al. 2007; see also Future Instrumentation at www.gemini.edu), is the detection of exoplanets directly by imaging. Young stars will be important targets for GPI science because their exoplanets are expected to dim as they age and cool. Over the past 20 years astronomers have identified groups of relatively nearby young stars distinguished by their space motion through the galaxy, hence the name “Nearby Young Moving Groups” (NYMGs). The TWA group at median distance 56 pc is the youngest, MY, and the Pic and AB Dor groups are the nearest with median distances 35 and 30 pc, respectively (Zuckerman and Song, 2004; Torres et al. 2006; Fernández et al. 2008). Their ages are about 12 MY for Pic and 30-100 MY for AB Dor (Fernández et al. 2008). By analyzing the kinematics of the NYMGs, Fernández et al. (2008) showed that they share a common origin at the edges of the giant molecular cloud that formed the Sco-Cen star forming region. On this scenario, the supernova that heated the Local Bubble also triggered the formation of the stars in the NYMGs.
Owing to their youth and proximity stars in the NYMGs are promising targets for exoplanet searches by high resolution and high contrast imaging. With detectable contrast ratios of , the GPI is designed to image brown dwarfs and exoplanets that may surround a star. Astronomers can then spectrally analyze the composition of their atmospheres, which has further implications in astrobiology and stellar and planetary evolution (eg. Oppenheimer and Hinkley, 2009). Lépine and Simon (2009) described a pilot program to identify new low-mass probable members of the Pic moving group (BPMG). Schlieder et al. (2009) are continuing the program and expanding it to include the AB Dor moving group. Our goals in the work described here were to evaluate the detectability of exoplanets in the BPMG and hence to provide guidance for observing programs of the BPMG, and other NYMGs, as new members are discovered.
2 Detectability of Brown Dwarfs and Exoplanets in the BPMG
2.1 GPI Field of View and Sensitivity
Detectability of companions using the GPI is determined by its field of view (FOV) and by its sensitivity to the flux of faint companions near the much brighter host star. The radius of the occulting disc of the coronagraph sets the inner boundary of the FOV. Observations are made with the host star image centered behind the occulting disk. The outer boundary is a square of dimensions centered on the occulting disk (Graham et al. 2007). At the 35 pc median distance of the BPMG members, the FOV of the GPI encompasses host-companion separations to 50 AU. For a 1 M⊙ host, this implies orbital periods to 350 y.
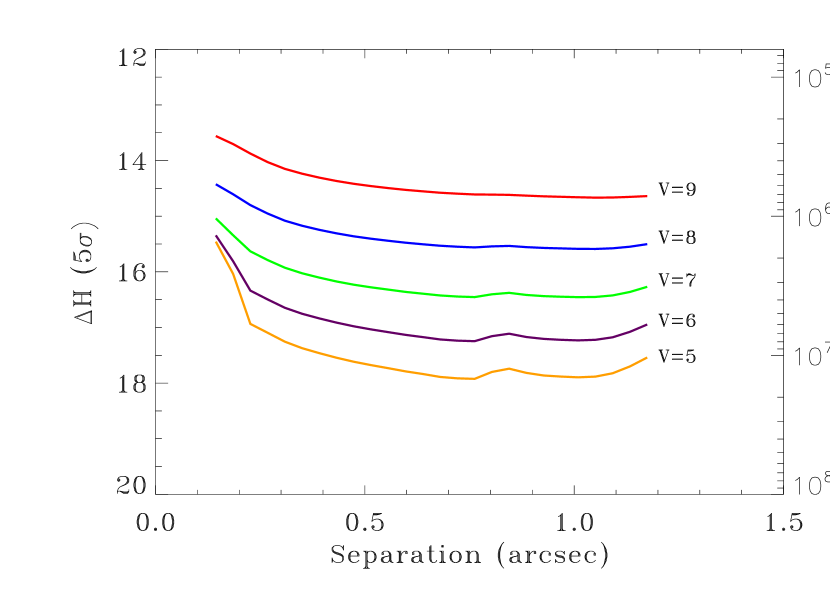
The most important parameter determining the detectability of a companion within the FOV is the ratio of its brightness to that of the host star. The detectable brightness ratio, or contrast, in turn depends on the quality of the wavefront correction achieved by the telescope’s adaptive optics (AO) system. Thus, the detectable contrast depends on the brightness of the host star at V, the band at which the AO system operates, and the wavelength at which the companion is observed, usually the H-band for the GPI. The contrast curves (Figure 1) are expressed as the 5- H-band magnitude difference between the companion and host star as a function of their angular separation that is detectable in 1 hour of observation (J. Graham, private communication). The detectable contrast assumes installation at Gemini-South and that speckle noise dominates the images. The curves are given at 5- values of the host star brightness, V= 5 to 9 mag.
2.2 Modeling the BPMG Sample
Table 1 lists the 29 published members of the BPMG (Fernández et al 2008; Lépine and Simon 2009). The J, H, and K-band magnitudes are from the 2MASS survey. We evaluated the detectability of possible companions for BPMG members in the brightness range at which the contrast curves are given and extropolated them to V=10 in order to include HIP 29964. Our analysis thus included 15 BPMG stars111The A spectral type stars HIP 79881 and HD 172555 with V=4.9 and 4.8 are slightly brighter than the V=5 sensitivity curve in Figure 1. The nature of the companions for these stars should be very similar to that for the 5.0 magnitude A0V star Tel.; these are identified with an asterisk in Table 1, column 1. We needed to estimate the host star mass in order to model the companion’s motion. To accomplish this, we used the spectral type listed by Fernández et al. 2008), Kenyon and Hartmann’s (1995) spectral type to effective temperature scale, and estimated the mass with Siess’ web-based isochrone calculation tool222http://www-astro.ulb.ac.be/ siess/server/iso.html at age 10 MY (Siess et al. 2000).
According to current views, planets are thought to form in circumstellar disks by one of two mechanisms: by core-accretion (Lissauer and Stevenson 2007) or by disk instability (Durisen et al. 2007). These are dubbed the “cold start” and “hot start” mechanisms (eg. Fortney et al. 2008, F08; Nielsen and Close 2009). F08 calculated the IR luminosities of 1-10 companions at 10 MY age for the core-accretion and “hot start” formation models (our Table 2). Baraffe et al. (1998, 2003) also calculated the IR luminosities of companions for the hot start scenario (our Table 3); their H-band luminosities for 1-10 exoplanets are similar to F08’s values but slightly brighter. In our modeling we use F08’s results for the core-accretion luminosities and Baraffe et al’s results for the disk instability luminosities. The latter cover a larger mass range than F08’s disk instability luminosities.
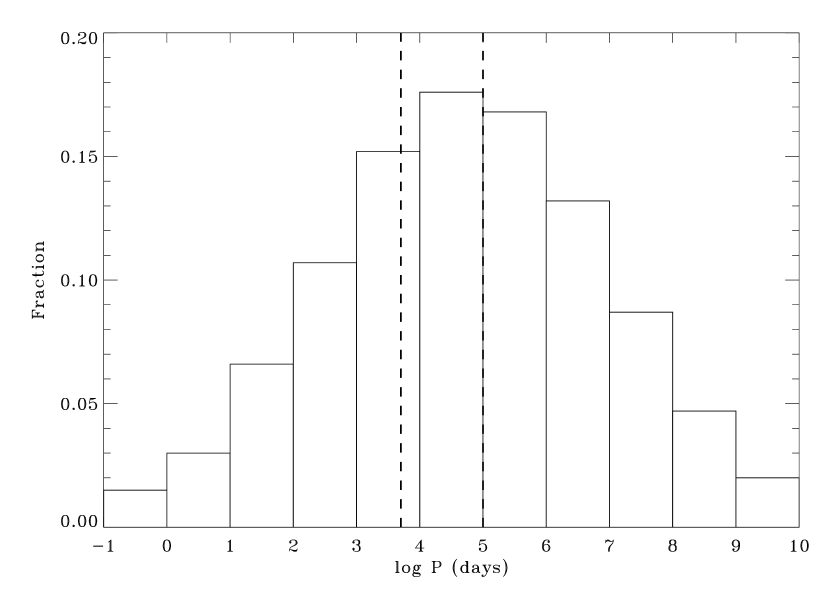
The exoplanet semi-major axis distribution at separations falling within the GPI’s FOV, 7 to 50 AU for host star at 35 pc, is unknown at present. It will not be known until many more exoplanetary systems like those associated with Fomalhaut and HR 8799 (Kalas et al 2008; Marois et al 2008) are identified. We use, therefore, two distributions for our analysis that may represent the possible extremes. The first is that of stellar companions orbiting nearby main sequence F and G stars (Duquennoy & Mayor 1991; hereafter DM91). We binned the distribution at (Figure 2) and drew values of the period randomly according to frequencies indicated. The short vertical lines in Figure 2 indicate the period range 18 to 350 y corresponding to 7 and 50 AU orbital separations from a 1 M⊙star. This model of the exoplanet orbital distribution is very favorable for their detection because the FOV of the GPI encompasses companions at the its peak.
At the other extreme, we used power law relationship in period, , derived by by Cumming et al. (2008) for planets detected by the radial velocity technique. To bound the power-law distribution we considered only planets at orbital periods of , corresponding to orbital separations 0.42 to 194 AU. We chose the inner bound because the observed distribution of exoplanets discovered by the radial velocity technique departs from a power-law at smaller separations (see for example Figs. 7 or 12 of Nielsen and Close 2009). We chose the upper bound because Nielsen and Close found that hosts with exoplanets distributed according to cannot, with very high confidence, harbor planets beyond 100 AU. We binned C08’s distribution at .
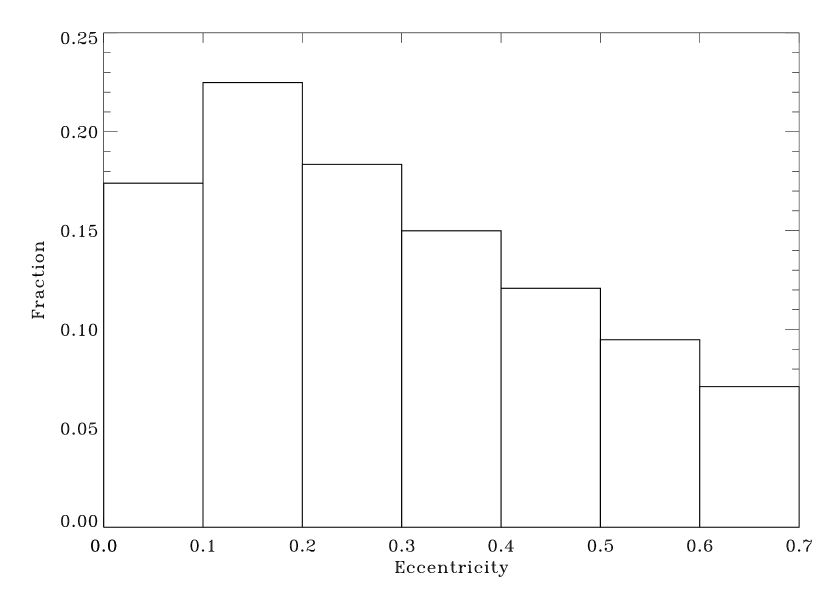
We evaluated the detectability of companions as follows. For each BPMG member, we cycled through the possible companion masses listed in Tables 2 and 3. When using the DM91 period distribution, for each companion mass we generated 1000 orbits on which it might lie. For the C08 period distribution, we generated 10000 orbits, all lying, in this case, between . The eccentricity distribution (Figure 3) is adapted from that observed for exoplanets as given on the web site of the Berkeley group333http://exoplanets.org/planets.shtml. We binned the distribution by and selected values of according to the frequencies indicated in the figure.
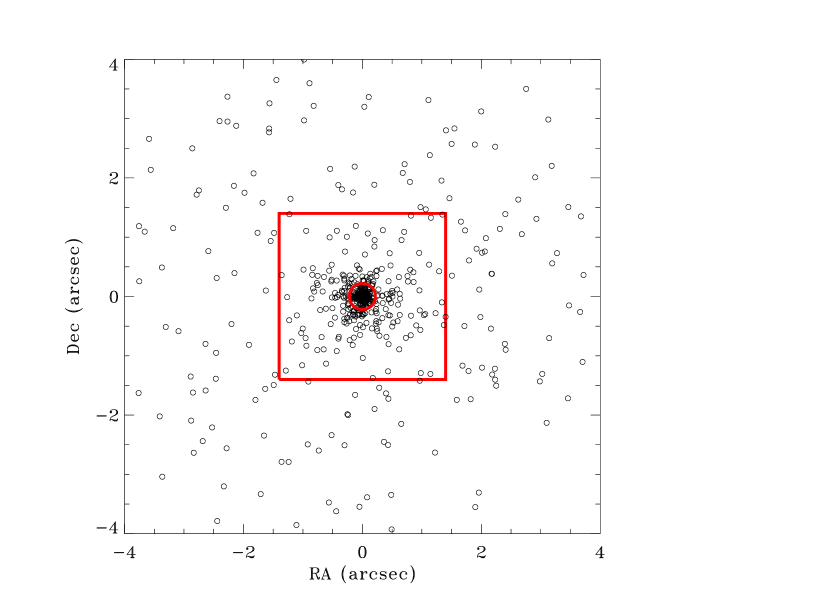
We assumed that all the other orbital parameters, most importantly the orbital inclination, are distributed randomly. With these values of the orbital parameters we calculated the apparent positions of the 1000 (or 10000) model companions with respect to the host. An example for the BPMG member HIP 10680 and DM91 semi-major axis distribution is shown in Figure 4. At its 39.4 pc distance, 378 of the model companions are hidden behind the occulting disc, 403 fall outside the outer boundary of the FOV, leaving 219 within the FOV for possible detection. Thus, at best, an imaging observation of HIP 10680 would start with only a chance of detecting a companion with the orbital parameters satisfying our assumed distributions. For each companion mass a fresh set of randomly selected orbits and apparent positions are computed. The number of companions within the FOV therefore varies slightly according to the statistics of sampling.
To evaluate the detectability of the companions we consider the sensitivity of the GPI. For each companion mass we obtain its apparent H magnitude at the distance of the host, and evaluate the difference between it and the host. For each of the hypothetical companions that fall within the FOV at a particular angular separation from the host, we compare the 5- sensitivity interpolated for the host star V magnitude with the apparent magnitude difference. If the difference is smaller than H at 5- we count the companion as a possible detection. After evaluating all the companions of a given mass within the FOV, we proceed to the next mass in Table 2 or 3.
3 Results and Discussion
3.1 Detection of Companions in the BPMG
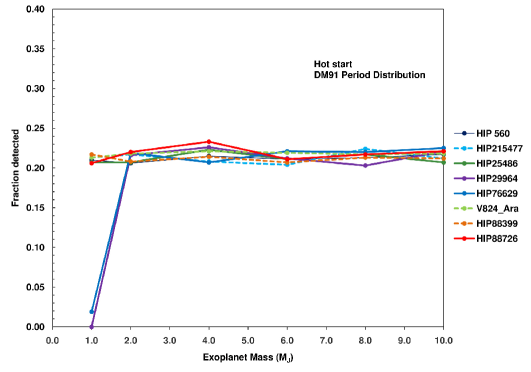
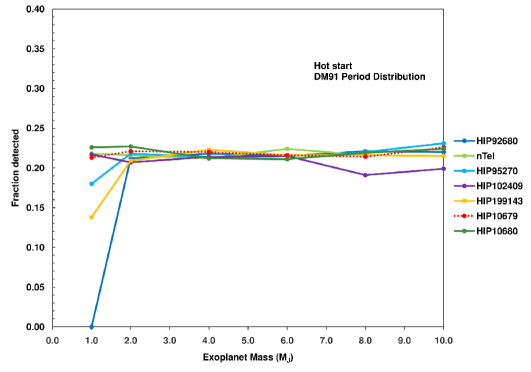
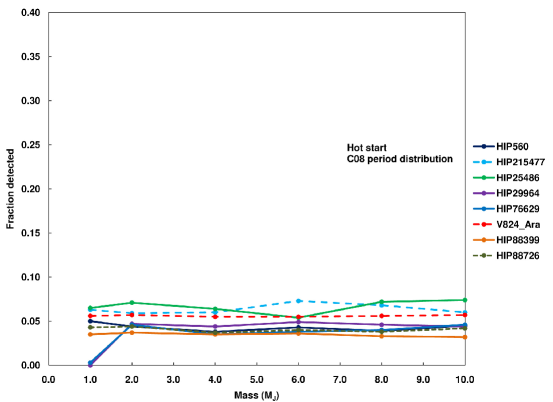
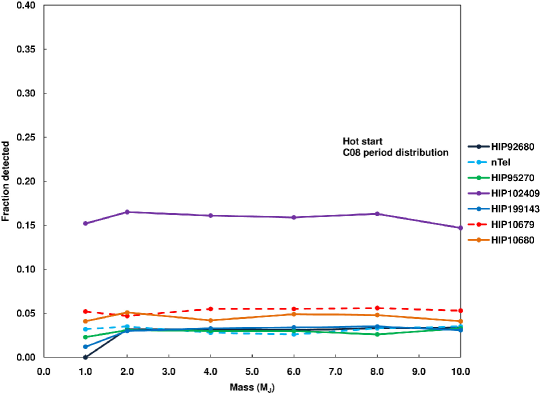
The results of the modeling procedure for the hot and cold start brighness values and DM91 and C08 orbital distributions are displayed in Figures 5 to 8. The figures show the fraction of 10 Myr-old possible companions detected at the 5- level, at least, in 1 hr of GPI observation of the 15 members of the BPMG (out of the 24 in Table 1), with V-band magnitudes within the senstivity limits of the GPI. With declinations below all 15 are observable by Gemini South.
For each BPMG member in Run 1, which use the hot start model exoplanets distributed according to the DM91 distribution, the fraction of companions that could be detected is approximately constant at 0.22 for companion masses . The small differences of the average detected fraction for a given host reflect the varying number of detectable model companions within the FOV at the host’s distance and its apparent magnitude. Fluctuations around the means are purely statistical and are attributable to the different parameters selected for each trial companion mass (§2.2). For these companion masses, the star-companion contrast is within GPI’s sensitivity limit, and any companion in the FOV is detected. Thus, for hosts bright enough at V for good AO corection, the limiting factor in their detection is not the sensitivity of GPI but rather its FOV. The small variations in the detection probability below arise in differences in host star brightness and distance.
At 9.9 pc distance, HIP 102409 is the closest of the of BPMG 15 members but the fraction of its possible companions detected is comparable to that of the others. At its distance, the FOV samples the range 2-14 AU corresponding to a range of periods log P3 to 4, slightly below the peak of the assumed period distribution. Evidently the increased brightness of the host owing to its proximity is offset by the slightly smaller numbers of possible companions lying within the FOV and illustrates the tradeoffs of distance, spectral type, and apparent magnitude that affect the exoplanet detectability.
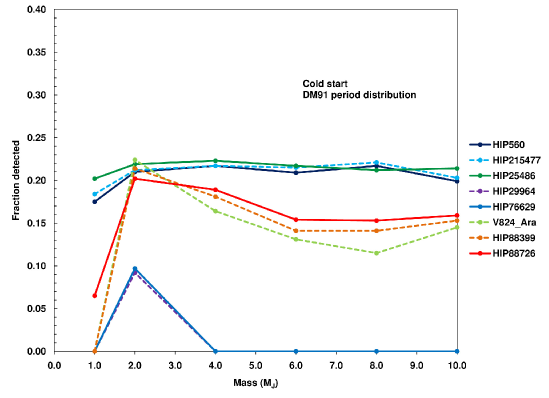
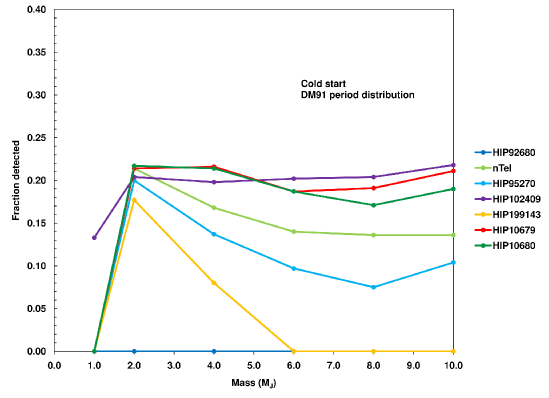
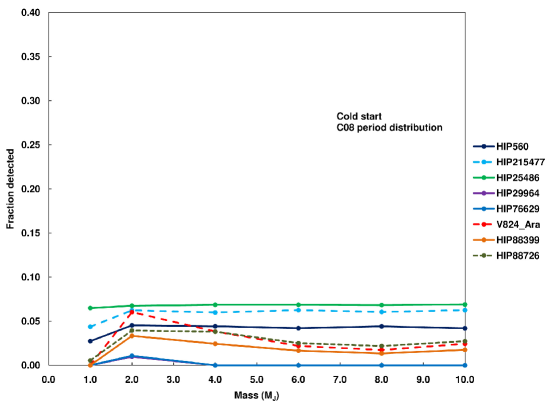
The fraction of companions detected in Run 2 for cold start models with the DM91 distribution (Figure 6) is much less than those in Run 1 because core-accretion produces fainter companions. For example, Tables 2 and 3 indicate that 10 exoplanets that formed from a hot start scenario have H-magnitudes of 11 to 12, while in cold start models their H-band magnitude is 18. The fluctuations are statistical. The detected fraction is not equal for all the hosts. Again, HIP 102409 benefits from its close proximity to Earth. Other stars such as HIP 215477, HIP 25486, and HIP 10679 also have high detectability fractions primarily because they are relatively near the Earth. While HIP 560, HIP 29964 and HIP 76629 have similar distances and H magnitudes, HIP 560 is much brighter in the V band which produces better AO correction and thus improved sensitivity to exoplanets.
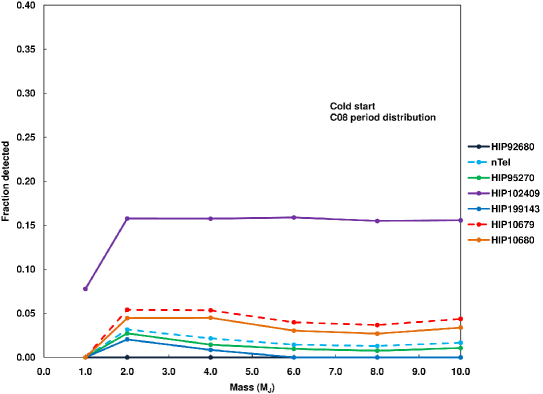
Results for the C08 power-law period orbital distribution are shown in Figures 7 and 8 (Runs 3 and 4). Tthe fraction of detectable exoplanets drops dramatically to 0.05 for companion masses . Since we apply this distribution only to periods between to 6, the fraction detected applies only to exoplanets in this range. The power-law distribution favors planets at short orbital periods and these tend to fall behind GPI’s occulting disk. In these calculations, HIP 102409 has the highest fraction of exoplanet detectability; its proximity and the spectral type produce a much more favorable star-planet contrast (H13) than the other members (H15-17).
3.2 Discussion
The essential result of our modeling is that the GPI has the potential to image exoplanets with around host stars in the BPMG provided (1) that the stars are sufficiently bright for the required AO correction, (2) that the orbital distribution of exoplanets extends beyond AU, and (3) that the exoplanets are not much fainter than predicted by the cold start formation model. These qualifications are very important. The V-band brightness required for high quality AO correction provides the severest cut of the BPMG sample, from the 29 members in Table 1 to the 15 observable stars, identified with an asterisk in Table 1 and appearing in, for example, Fig. 5.
This exclusion also becomes evident in a comparison of our analysis with imaging searches for exoplanets already carried out (Masciadri et al. 2005; Biller et al. 2007). Nielsen and Close (2009) analyzed both surveys on a uniform basis and provide a convenient list of the stars observed. Biller et al. (2007) and Masciadri et al. (2005) observed 13 of the stars in Table 1 and did not any detect exoplanets. Only 3 of the 13 are sufficiently bright at V for the GPI (HIP 29964 SpTy K6/7, HIP 76629 K0, and V824 Ara G2). Ten of the 13 stars observed by Masciadri et al and Biller et al are not accessible to GPI, one because it is too bright, the A7 star HD 172555. The remaining 9 stars, one K7 and 8 early M’s, are too faint for the GPI. On the other hand, the 15 stars that are observable by GPI include only one M star444It is unecessary therefore to include a correction for the paucity of Jupiter-mass exoplanets associated with M stars (Johnson et al. 2007)., the M1 HIP 102499 (and that only by extrapolating the sensitivity curves to its V=9.9 mag). The others include 3 SpTy K stars, all 9 F and G stars in Table 1, and 2 of the 4 A stars (the other 2 are too bright). Clearly, exoplanet searches in the BPMG using the GPI will have to favor the stars bright at V.
A comparison of Figs. 5 and 7, or Figs 6 and 8, illustrates the interplay of GPI’s FOV and the exoplanet orbital distribution. Fortuitously, for targets in the BPMG, the FOV includes the peak of the DM91 distribution. The C08 distribution decreases across the FOV as , a decrease of about a factor of 6 from 7 AU to 50 AU. This accounts for the detectivity ratio for the C08 and DM91 orbital distributions. The ratio is about the same for the hot start and cold start models but with greater scatter as a function of exoplanet mass and greater variablity among the stars in the cold start models. Our use of the C08 distribution applies only to exoplanets with periods between and days; the ratio will be smaller if the C08 distribution applies at shorter periods. If the GPI is used to observe 15 stars in Figs. 5-8 and detects a few exoplanets, nominally 3, astronomers would learn that the DM91 distribution approximates the actual distribution at AU and that the planets formed according to the hot start scenario. If on the other hand the search yields no exoplanet detections at all, astronomers would be able to rule out the applicability of the DM91 at about the 95% confidence level, but would not be able to distinguish between the formation models.
Nielsen and Close’s (2007) study of all the stars observed by Biller et al. (2007) and Masciadri et al. (2005) shows that at the 68% confidence level no more than 20% of the stars can have a companion in the host-exoplanet separation range 22 to 807 AU for Baraffe et al’s (2003) hot start models and 25 to 557 AU for Fortney et al’s (2008) cold start models. Nielsen and Close’s result therefore suggests that for exoplanets with in this separation range the DM91 distribution may not apply. Nielsen and Close also find that the observed stars, with 95% confidence limit, cannot harbor exoplanets according to the C08 distribution beyond 65 AU (hot start models) and 182 AU (cold start models). These bounds are outside the GPI’s FOV. If GPI observation of the 15 stars accessible in the BPMG were to yield no detections at all, this would lower the upper bound on the applicability of the C08 distribution. It would also pose an interesting puzzle given that exoplanets are associated with the A stars Fomalhaut and HR 8799. The non-detection would suggest that the exoplanet orbital distribution depends on the mass of the host star and favors the presence of distant exoplanets if the star is sufficiently massive.
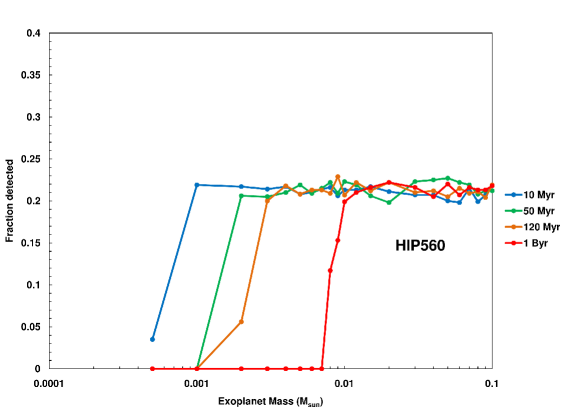
Figure 9 illustrates the dependence of exoplanet detectability on system age. We considered a star like HIP 560, with its distance and spectral type, but of different ages, 10 MY, 50 MY, 120 MY and 1 BY. We used the hot start models and the DM91 distribution. The result for 10 MY is the same in Fig. 5 and is representative of the age of the Pic and TW Hya moving groups. The age of the AB Dor moving group lies between 50 and 120 MY. The asymptotic detectability for cold start models and the C08 distribution scales as in Figs. 5 to 8. Figure 10 shows that the minimum detectable mass increases significantly with age and that the GPI will detect essentially all stellar companions of nearby main sequence stars. At 1 BY, only companion masses greater than are detectable by GPI.
4 Summary
We have found that for stars in the BPMG with mag,
1) GPI will be able to detect exoplanets with mass greater than for both hot start or core-accretion scenarios.
2) The V-band brightness for adequate AO correction requirement restricts the target sample to stars earlier than K7 spectral type.
3) Given the GPI’s high sensitivity, the two most important factors governing the exoplanet detection are the instrument’s field of view and the period distribution of the exoplanets. The number of exoplanets detected will distinguish between a distribution similar to that of the nearby F and G stars (i.e. DM91) and the power-law distribution derived by Cumming et al. (2008).
4) Stars to 100 MY old are prime targets for GPI observation because of the favorable star-planet contrast. For older stars such as a 1-Byr F star at the 35 pc typical distance of the BPMG, the GPI will be able to detect all companions with .
References
- Baraffe et al. (2003) Baraffe, I. Chabrier, G., Barman, T.S., Allard, F., & Hauschildt, P.H. 2003, A&A, 402, 701
- Biller et al. (2007) Biller, B. A., Close, L. M., Masciadri, E., Nielsen, E., Lenzen, R., Brandner, W., McCarthy, D., Hartung, M., Kellner, S., Mamajek, E., Henning, T., Miller, D., Kenworthy, M., & Kulesa, C. 2007, ApJS, 173,
- Cumming et al. (2008) Cummings, A. R., Butler,P., Marcy, G.W., Vogt, S.S., Wright, J.T. & Fischer, D.A. 2008, PASP, 120, 531 (C08)
- Duquennoy & Mayor (1991) Duquennoy, A. & Mayor, M. 1991, A&A, 248, 485 (DM91)
- Durisen et al. (2007) Durisen, R.H., Boss, A.P., Mayer, L., Nelson, A.F. & Quinn, W.K.M. 2007, in Protostars and Planets V, ed. B.Reipurth, D. Jewitt, & K. Keil (Tucson: Univ. Arizona Press), 607
- Fernández (2008) Fernández, D., Figueras, F., & Torra, J. 2008, A&A, 480, 751
- Fortney et al. (2008) Fortney, J.J., Marley, M.S., Saumon, D., Lodders, K. 2008, ApJ, 683, 1104 (F08)
- Graham et al. (2007) Graham, J.R., Macintosh, B., Doyon, R., et al. 2007, Exoplanet Task Force White Paper, http://arxiv.org/abs/0704.1454
- Hubickyj et al. (2005) Hubickyj, O., Bodenheimer, P. & Lissauer, J.J. 2005, Icarus, 179, 415
- Johnson et al. (2007) Johnson, J.A., Butler, R.P., Marcy, G.W., Fischer, D.A., Vogt, S.S., Wright, J.T., & Peek, K.M.G. 2007, ApJ, 670, 833
- Kalas et al. (2008) Kalas, P., Graham, J., Chiang, E., Fitzgerald, M., Clampin, M., Kite, E., Stapelfeldt, K., Marois, C., Krist, J. 2007, Science, 322, 1345
- Kenyon & Hartmann (1995) Kenyon, S. J., & Hartmann, L. 1995, ApJS, 101, 117
- Lafréniere et al. (2007) Lafreniére, D., et al. 2007, ApJ, 670, 1367
- Lépine and Simon (2009) Lépine, S. and Simon, M. 2009, AJ, 137, 3632
- Lissauer and Stevenson (2007) Lissauer, J. J., & Stevenson, D. J. 2007, in Protostars and Planets V, ed. B. Reipurth, D. Jewitt, & K. Keil (Tucson: Univ. Arizona Press), 591
- Marois et al. (2008) Marois, C., Macintosh, B., Barman, T., Zuckerman, B.; Song, I. Patience, J., Lafreniére, D., Doyon, R. 2008, Science, 322, 1348
- Marley et al. (2007) Marley, M.S., Fortney, J.J., Hubickyj, O., Bodenheimer, P., & Lissauer, J.J. 2007, ApJ, 655, 541
- Masciadri et al. (2005) Masciadri, E., Mundt, R., Henning, T., Alvarez, C., & Barrado y Navascués, D. 2005, ApJ, 625, 1004
- Mayor & Queloz (1995) Mayor, M. & Queloz, D. 1995, Nature, 378, 355
- Nielsen et al. (2008) Nielsen, E.L., Close, L.M., Biller, B.A., Masciadri, E., & Lenzen, R. 2008, ApJ, 674, 466
- Nielsen et al. (2009) Nielsen, E.L. and Close, L.M. 2009, ApJ in press, astro-ph arXiv:0909.453
- Oppenheimer & Hinkley (2009) Oppenheimer, B. R. & Hinkley, S. 2009, ARAA, 47, 253
- Schlieder et al. (2009) Schlieder, J. E., Simon, M., & Lepine, S. 2009, American Astronomical Society Meeting Abstracts, 214, #421.02
- Siess et al. (2000) Siess, L., Dufour, E. & Forestini, M. 2000, A&A, 358, 593
- Torres et al. (2006) Torres, C. A. O., Quast, G. R., da Silva, L., de La Reza, R., Melo, C. H. F., Sterzik, M. 2006, A&A, 460, 695
- Zuckerman & Song (2004) Zuckerman, B. & Song, I. 2004, ARA&A, 42, 685
| Name | RA | DEC | Spectral TypeaaSpectral types and distances were used from Table 7 of Fernández et al. (2008). | bbEffective temperatures estimated from Kenyon and Hartmann’s (1995) spectral type to effective temperature scale (see text | M⊙ccMasses estimated from Siess’ online isochrone tool (see text) | D(pc)aaSpectral types and distances were used from Table 7 of Fernández et al. (2008). | V | JddJ, H, and K magnitude values were used from the 2MASS survey (J.Schlieder, private communication.) | HddJ, H, and K magnitude values were used from the 2MASS survey (J.Schlieder, private communication.) | KddJ, H, and K magnitude values were used from the 2MASS survey (J.Schlieder, private communication.) |
|---|---|---|---|---|---|---|---|---|---|---|
| HIP560∗ | 00 06 50.09 | -23 06 27.1 | F2IV | 6890 | 1.7 | 39.1 | 6.181 | 5.45 | 5.331 | 5.24 |
| HIP215477∗ | 04 37 36.13 | -02 28 24.8 | F0V | 7200 | 1.8 | 29.8 | 5.216 | 4.743 | 4.769 | 4.536 |
| GJ3305 | 04 37 37.47 | -02 29 28.4 | M0.5 | 3850 | 0.6 | 29.8 | 10.74 | 7.299 | 6.639 | 6.413 |
| HIP23309 | 05 00 47.13 | -57 15 25.5 | M0/1 | 3785 | 0.5 | 26.3 | 10.112 | 7.095 | 6.429 | 6.244 |
| HIP25486∗ | 05 27 04.76 | -11 54 03.5 | F7 | 6280 | 1.6 | 26.8 | 6.305 | 5.267 | 5.086 | 4.926 |
| HIP27321 | 05 47 17.09 | -51 03 59.5 | A3V | 8720 | 2.0 | 19.3 | 3.853 | 3.669 | 3.544 | 3.525 |
| HIP29964∗ | 06 18 28.21 | -72 02 41.5 | K6/7 | 4133 | 0.9 | 38.5 | 9.995 | 7.53 | 6.984 | 6.814 |
| HIP76629∗ | 15 38 57.54 | -57 42 27.3 | K0V | 5250 | 1.5 | 39.8 | 8.16 | 6.382 | 5.994 | 5.852 |
| HIP79881 | 16 18 17.90 | -28 36 50.5 | A0 | 9520 | 2.2 | 43 | 4.782 | 4.855 | 4.939 | 4.738 |
| V824 Ara∗ | 17 17 25.50 | -66 57 03.7 | G2IV | 5860 | 1.6 | 31.4 | 6.878 | 5.288 | 4.907 | 4.701 |
| HD155555C | 17 17 31.29 | -66 57 05.6 | (M4.5) | 3310 | 0.2 | 31.4 | 12.7 | 8.541 | 7.916 | 7.628 |
| HIP88399∗ | 18 03 03.41 | -51 38 56.4 | F5V | 6440 | 1.7 | 46.9 | 7.016 | 6.158 | 6.022 | 5.913 |
| HIP88726∗ | 18 06 49.90 | -43 25 30.0 | A5V | 8200 | 1.9 | 43.9 | 5.67 | 4.68 | 4.488 | 4.386 |
| HD 172555 | 18 45 26.90 | -64 52 16.5 | A7 | 7850 | 1.9 | 29.2 | 4.773 | 4.381 | 4.251 | 4.298 |
| CD641208 | 18 45 37.03 | -64 51 45.9 | K7 | 4060 | 0.8 | 29.2 | 11.028 | 6.906 | 6.318 | 6.096 |
| HIP92680∗ | 18 53 05.87 | -50 10 49.9 | K0Vp | 5250 | 1.5 | 49.7 | 8.414 | 6.856 | 6.486 | 6.366 |
| nTel∗ | 19 22 51.21 | -54 25 26.2 | A0Vn | 9520 | 2.2 | 47.7 | 5.02 | 5.096 | 5.147 | 5.008 |
| HIP95270∗ | 19 22 58.94 | -54 32 17.0 | (F5.5) | 6515 | 1.7 | 50.6 | 7.046 | 6.2 | 5.98 | 5.91 |
| HIP102141 | 20 41 51.12 | -32 26 07.3 | (M4.5e) | 3305 | 0.2 | 10.2 | 11.02 | 5.807 | 5.201 | 4.944 |
| HIP102409∗ | 20 45 09.53 | -31 20 27.2 | M1e | 3720 | 0.5 | 9.9 | 8.77 | 5.435 | 4.831 | 4.528 |
| HD199143∗ | 20 55 47.67 | -17 06 51.0 | F8V | 6200 | 1.6 | 47.7 | 7.328 | 6.206 | 5.945 | 5.81 |
| AZCap | 20 56 02.74 | -17 10 53.8 | (K7/M0) | 3955 | 0.7 | 47.7 | 10.631 | 7.849 | 7.249 | 7.039 |
| HIP10679∗ | 02 17 24.73 | +28 44 30.5 | G2V | 5860 | 1.6 | 34 | 7.75 | 6.57 | 6.355 | 6.262 |
| HIP10680∗ | 02 17 25.27 | +28 44 42.3 | F5V | 6440 | 1.7 | 39.4 | 7 | 6.05 | 5.84 | 5.787 |
| HIP11437A | 02 27 29.25 | +30 58 24.6 | K8 | 3850 | 0.6 | 42.3 | 10.083 | 7.87 | 7.235 | 7.08 |
| HIP11437B | 02 27 28.09 | +30 58 40.1 | (K3) | 4730 | 1.3 | 42.3 | 12.46 | 8.817 | 8.141 | 7.921 |
| HIP12545 | 02 41 25.89 | +05 59 18.4 | (M..) | 3850 | 0.6 | 40.5 | 10.2 | 7.904 | 7.234 | 7.069 |
| HIP24418AB | 05 01 58.80 | +09 59 00.0 | M3V: | 3470 | 0.3 | 32.1 | 11.5 | 7.212 | 6.657 | 6.37 |
| HIP112312A | 22 44 57.97 | -33 15 01.7 | M4 | 3370 | 0.2 | 23.6 | 13.131 | 7.785 | 7.153 | 6.932 |
| Mass () | hot start | core-accretion |
|---|---|---|
| 1.0 | 18.27 | 19.43 |
| 2.0 | 16.05 | 18.11 |
| 4.0 | 13.95 | 18.52 |
| 6.0 | 12.82 | 18.73 |
| 8.0 | 12.13 | 18.79 |
| 10.0 | 11.52 | 18.69 |
| Mass () | |
|---|---|
| 0.5 | 20.16 |
| 1.0 | 17.79 |
| 2.0 | 15.79 |
| 3.0 | 14.65 |
| 4.0 | 13.85 |
| 5.0 | 13.22 |
| 6.0 | 12.68 |
| 7.0 | 12.27 |
| 8.0 | 11.87 |
| 9.0 | 11.54 |
| 10.0 | 11.26 |
| 12.0 | 10.75 |
| 15.0 | 9.87 |
| 20.0 | 8.91 |
| 30.0 | 8.28 |
| 40.0 | 8.25 |
| 50.0 | 7.84 |
| 60.0 | 7.73 |
| 70.0 | 7.52 |
| 80.0 | 7.32 |
| 90.0 | 7.14 |
| 100.0 | 6.93 |