A method for setting upper limits to the extragalactic background light with Fermi-LAT and TeV observations of blazars
Abstract
We propose a method for setting upper limits to the extragalactic background light (EBL). Our method uses simultaneous Fermi-LAT and ground-based TeV observations of blazars and is based on the assumption that the intrinsic spectral energy distribution (SED) of TeV blazars lies below the extrapolation of the Fermi-LAT SED from GeV to TeV energies. By extrapolating the Fermi-LAT spectrum, which for TeV blazars is practically unattenuated by photon-photon pair production with EBL photons, a firm upper limit on the intrinsic SED at TeV energies is provided. The ratio of the extrapolated spectrum to the observed TeV spectrum provides upper limits to the optical depth for the propagation of the TeV photons due to pair production on the EBL, which in turn sets firm upper limits to EBL models. We demonstrate our method using simultaneous observations from Fermi-LAT and ground-based TeV telescopes of the blazars PKS 2155-304 (catalog ) and 1ES 1218+304 (catalog ), and show that high EBL density models are disfavored. We also discuss how our method can be optimized and how Fermi and X-ray monitoring observations of TeV blazars can guide future TeV campaigns, leading to potentially much stronger constraints on EBL models.
1 Introduction
The EBL reflects the cosmologically important time-integrated history of light production and re-processing in the Universe. For this reason, measuring its intensity is highly desirable. The two components of the EBL are dust emission peaking at and starlight peaking at . The actual level of the EBL is very difficult to measure, due to the dominance of foreground emission, mostly from interplanetary dust in our solar system (for reviews see Hauser & Dwek, 2001; Kashlinsky, 2005), and the EBL level remains unknown within a factor of few. Model-independent lower limits to the EBL, based on galaxy counts (e.g. Dole et al. 2006, Béthermin et al. 2010), are the only strict lower limits on the EBL to date. Modeling the EBL can lead to definite prediction, however uncertainties in the star formation rate, initial mass function, dust extinction, and how they evolve with redshift, has led to significant discrepancy among models (Salamon & Stecker, 1998; Stecker et al., 2006; Primack et al., 2005; Gilmore et al., 2009; Kneiske et al., 2002, 2004; Razzaque et al., 2009; Finke et al., 2010; Franceschini et al., 2008). Recently, Georganopoulos et al. (2008) proposed a new method based on detecting as GeV emission EBL radiation that has been inverse Compton-scattered by relativistic electrons in the lobes of nearby radio galaxies such as Fornax A.
The EBL in the 1-10 m range can in principle be obtained by using the TeV blazars as background light sources and modeling its attenuation due to pair production with EBL photons: by assuming that the intrinsic TeV spectrum is known from modeling of the broadband blazar SED, one can derive the mid-IR EBL by comparing the observed to the presumed intrinsic spectrum (e.g., Stecker, de Jager, & Salamon, 1992; Stanev & Franceschini, 1998; Renault et al., 2001). Because it is not possible to determine with confidence the intrinsic TeV spectrum, a variation of this method has been proposed that sets limits on the EBL by assuming that the intrinsic blazar TeV spectrum cannot be arbitrarily hard: from simple shock acceleration arguments one would not expect an intrinsic TeV photon index harder than (e.g., Aharonian et al., 2006). Detailed shock acceleration simulations, however, indicate that harder VHE spectral indices may be possible (Stecker, Baring, & Summerlin, 2007). A large lower electron Lorentz factor (Katarzyński et al., 2006), and Compton scattering of the cosmic microwave background in an extended jet may also lead to hard TeV spectra (Böttcher et al., 2008). These considerations significantly relax the EBL limits derived by assuming (Mazin & Raue, 2007; Finke & Razzaque, 2009).
Methods that constrain the EBL through purely spectral arguments are free of the uncertainties of adopting a particular physical model. Such methods, based solely on TeV data, have been proposed by Dwek & Krennrich (2005), who considered unnatural TeV SEDs that exhibit an exponential increase at their high energy end and by Schrödter (2005) who assumed that all TeV blazars in flaring states have TeV spectra with the same maximum intrinsic photon index . Here we present a spectral method for obtaining upper limits to the EBL energy density that makes use of simultaneous LAT and TeV observations. In §2 we describe our method and apply it to recent simultaneous LAT and TeV observations observations of PKS 2155-304, in §3 we discuss how we can produce stronger constraints on the EBL and demonstrate this using simultaneous GeV/TeV observations of 1ES 1218+304, and in §4 we conclude.
2 An upper limit for the intrinsic TeV SED of TeV blazars
Our current observational understanding of blazars points toward a SED that consists of two spectral components or more colloquially “bumps”. The first bump peaks at IR to X-ray energies and it is almost certainly synchrotron emission from a population of relativistic electrons in a partially ordered magnetic field. The second bump peaks at MeV to multi-GeV energies and is thought to be due to inverse Compton scattering of synchrotron photons (Band & Grindlay, 1986; Bloom & Marscher, 1996), a dusty torus (Błażejowski et al., 2000), a broad-line region (Sikora et al., 1994), or an accretion disk (Dermer, Schlickeiser, & Mastichiadis, 1992). For the blazars that have been discovered so far, this second bump ranges in power between times the power of the synchrotron bump. It is also possible that the high energy bump is a result of emission from hadrons co-accelerated with the jet, which can radiate by hadronic synchrotron (Mücke & Protheroe, 2001) or photomeson production (Mannheim & Biermann, 1992) and the resulting cascades. Protons may also convert to neutrons, escape the relativistic jet, then convert back to protons and radiate (Atoyan & Dermer, 2003). So far, no observational evidence for a third, higher energy bump has been found and we consider it unlikely that a third SED component at TeV energies will be more powerful than the extrapolation of the GeV SED at TeV energies.
Our working assumption is motivated by these considerations and is weaker than the statement that there is no third SED bump: we assume that the extrapolation of the Fermi-detected SED at TeV energies is higher than the intrinsic TeV SED of the source. This means that the ratio of the actually observed TeV flux to the extrapolated one at any given TeV energy , provides a strict upper limit to the EBL-induced pair absorption optical depth at this energy,
| (1) |
This optical depth can then be compared to the optical depth calculated for the various EBL models. The models for which the optical depth is greater that are then excluded.
An important consideration for our method stems from the mismatch of the relatively long time required to obtain a sufficiently good SED of typical TeV blazars with Fermi (no less than a day) to the significantly smaller variability time observed by TeV telescopes (in some cases lasting less than an hour, e.g. Aharonian et al., 2007). It is clear that, because we want to compare simultaneous spectra, the TeV fluxes observed during the rapid TeV variability events seen in TeV sources should not be used together with the Fermi SED derived after integrating for days.
2.1 Application to PKS 2155-304
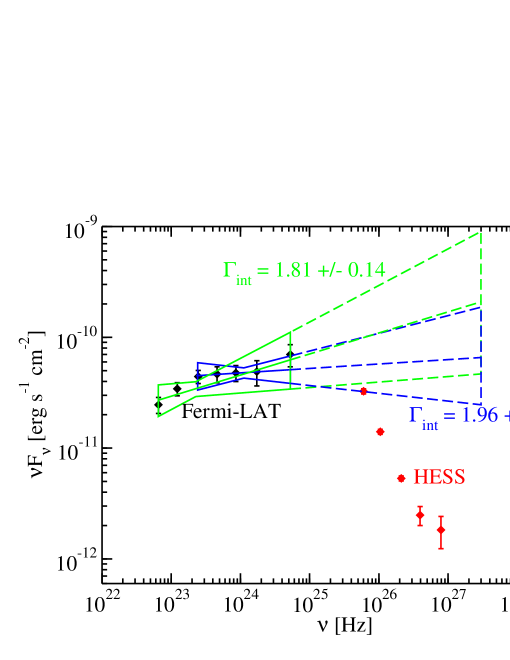
The blazar PKS 2155-304, a high peak frequency BL Lac object at redshift , was the target of a multiwavelength campaign in late August and early September 2008, which included observations by the Fermi Gamma-Ray Space Telescope and the HESS atmospheric Cherenkov telescope (Aharonian et al., 2009b). It is these observations to which we now turn our attention. The -ray SED from this campaign can be seen in Fig. 1. Aharonian et al. (2009b) found that the Fermi SED derived from data between MJD 54704-54715, the period of the TeV observations, can be described by a simple power law with spectral index . A longer train of Fermi observations between MJD 54682-54743 exhibits a similar GeV state. If one includes these data, the exposure increases by a factor of and the preferred GeV spectrum is now a broken power law, whose high energy part has a photon index (Aharonian et al., 2009b). While a conservative estimate of the photon index used for obtaining an upper limit to the TeV flux is that derived from the simultaneous observations only, the lack of strong variability in the GeV (as well as the TeV) regime, suggests that it is reasonable to adopt the high energy photon index as a better description.
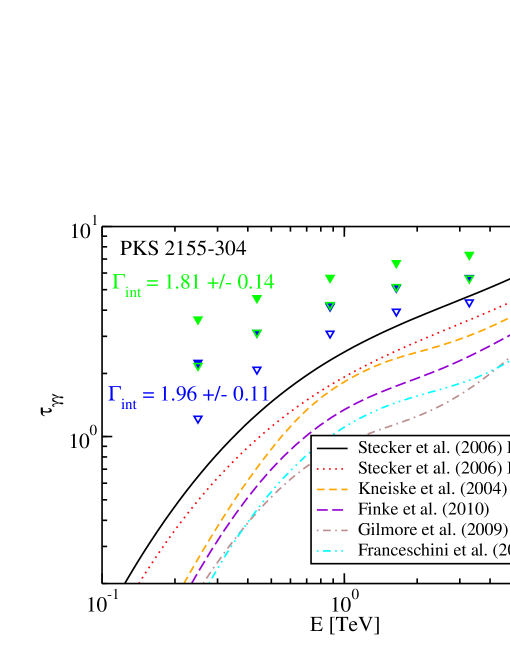
The single power-law, with spectral index and high energy power-law fit, of the broken power-law are shown as “bow tie” error plots in Fig. 1, extrapolated to the HESS energy range. These extrapolations are used as upper limits to the intrinsic flux of the TeV SED, unabsorbed by the EBL. The upper limit on is calculated from equation (1) for these two extrapolations, and the results are shown in Fig. 2 along with the absorption optical depth predictions of several EBL models. As expected, the steeper GeV index provides stronger constraints to the EBL models. Note that the fast evolution model of Stecker et al. 2006 lies below the limit on at the highest TeV energy for and, in fact, is inconsistent with it at the level.
3 How to produce stronger constraints on the EBL
We now discuss how the yield of our method can be maximized. We base our discussion on the fact that Fermi is continuously monitoring the entire sky, including the extragalactic TeV sources. To facilitate our discussion consider a source that has a LAT spectral index and a TeV spectral index (spectral indexes are connected to photon indexes through the relation ). Let us further assume that the transition between the two power laws takes place at an energy GeV, practically the energy border between LAT and ground based TeV telescopes. Then at an energy within the TeV regime, the flux one would expect by extrapolating the LAT spectrum is , while the flux we actually observe at energy is , where is the flux at energy . This means that the maximum pair production optical depth that we can infer from observations of this source is
| (2) |
Note that since increases with , the higher the TeV energy in which a source is detected, the stronger the constraints will be. As expected, the smaller the spectral break of a source is, the stronger the resulting constraint on will be. Therefore, at a given redshift , the most promising sources are those that exhibit the smallest . If a source varies, states with the smallest will provide the strongest constraints. We discuss this further below.
3.1 The benefits of high TeV states
A general pattern observed in both the low and high energy bumps of blazar SEDs is that variability events usually manifest themselves with a hardening of the high energy part/tail of the bump (e.g., Albert et al., 2007; Aharonian et al., 2009a), with the amplitude of variability decreasing at progressively lower energies. It is, therefore, natural to anticipate that when a TeV blazar is in a high state, the spectrum will harden and rise in amplitude more at TeV than at GeV energies (variability can explain the fact that in some variable sources like MRK 421 or S5 0716+714 the extrapolation of the GeV SED of a given non-flaring epoch to TeV energies (Abdo et al., 2009b) can be below the actually detected TeV emission at flaring states). This means that in a flaring state the method will provide more severe limits on EBL models.
As a potential example of the benefits of catching a source at a high state, we return to the case of PKS 2155-304, whose TeV flux in the August-September 2008 Fermi-HESS campaign was close to the lowest archival TeV data. The source exhibited a spectral break (, ). In a pre-Fermi 2006 campaign (Aharonian et al., 2009a), the TeV spectral index during flaring states hardened up to . If a similarly hard TeV spectrum is recorded simultaneously with Fermi observations and if the Fermi spectrum does not harden significantly, then , which would reduce by a factor of , posing important constraints on the EBL (all the upper limits in Figure 2 would shift downward by a factor of ).
The ideal high states should last long enough to provide us with a solid determination of the Fermi flux and photon index. In addition, the source should remain relatively steady while in the high flux state, so that the average Fermi and TeV measurements are a good representation of the source during this high but not rapidly variable state. A high level of GeV flux is also very useful, because if there is curvature in the Fermi band, it is possible that a broken power law fit will be better than a simple power law and one can then use the higher energy steeper part of the Fermi SED to extrapolate to TeV energies and produce lower values of (as we did for PKS 2155-304).
3.2 Sources at different redshifts, the case of 1ES 1218+304
Even if there are sources described by pure power laws in the entire GeV - TeV regime without the need for a break, their observed spectra would be imprinted with a break solely attributed to EBL absorption. Such breaks would increase with increasing redshift. In the more pragmatic case that there is a distribution of intrinsic breaks, then, as the blazar sequence (Fossati et al. 1998) suggests, the breaks should become stronger for the more powerful sources seen at higher redshifts, because the peak frequency of the high energy component shifts to lower energies as the source power increases. The increase of with redshift would thus be a convolution of two effects: the blazar-sequence-like shift of the TeV spectrum to steeper values (which is intrinsic) and the increase of EBL absorption with distance.
If is dominated by the former, our method would derive its strongest EBL constraints from nearby sources. If, however, the intrinsic increase of the break with redshift is small or negligible, sources at higher redshifts, even with steep TeV spectra (the most distant example is 3C 279 discovered by MAGIC (Albert et al., 2008) at with ), would provide us with strong constraints on the EBL. Because we do not actually know the intrinsic breaks of the TeV sources, the question that naturally arises is under what conditions higher redshift sources with steep TeV spectra can provide as useful constraints on the EBL as their nearby siblings that have significantly harder TeV spectra.
The important thing to notice here is that the relevant quantity that constrains the EBL is not , but , where is the luminosity distance of the source: sources with the same value of will provide the same constraints on the EBL (assuming that the evolution in the EBL energy density itself with redshift is negligible for small redshifts). This means that, for fixed values of and , a particular constraint on the EBL is satisfied for sources with a fixed value of . More distant sources with larger breaks will provide the same constraints as more nearby sources, as long as they have the same . As an example, let us use as a reference the state of PKS 2155-304 we discussed above, with and Mpc. A source at the distance of Mrk 421 (, Mpc) will provide the same constraints on the EBL if it exhibits . Any break greater than will not be as constraining as the stronger break of the more distant PKS 2155-304.
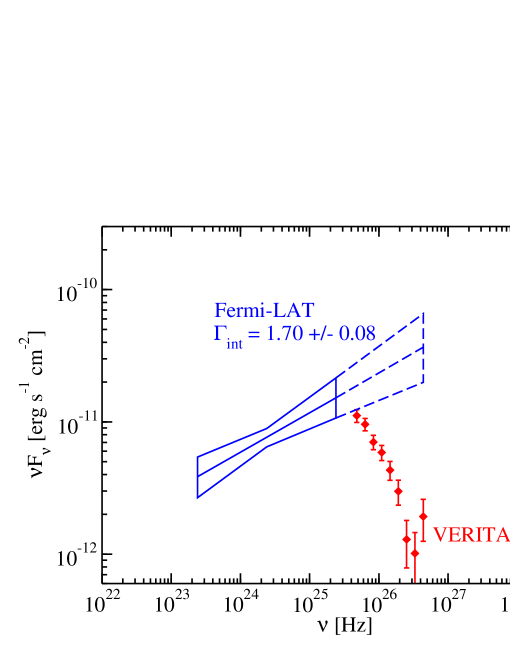
Going to higher redshifts, the more distant TeV BL Lac 1ES 1218+304 (Albert et al., 2006) (, Mpc) would provide the same constraints on the EBL if it exhibits . Breaks gentler than that will produce stronger constraints on the EBL than those derived from the state of PKS 2155-304 we studied here. Recently, it has been reported that PKS 1218+304 has been observed by VERITAS from 2008 December 29 to 2009 April 23 (Acciari et al. 2010). This is quasi-simultaneous to the LAT observation of the source in the 11 month Fermi-LAT catalog (A. Abdo et al. 2010 in preperation)111The catalog is published online at http://fermi.gsfc.nasa.gov/ssc/data/access/lat/1yr_catalog/ , which continuously exposed PKS 1218+304 from 2008 August 4 to 2009 July 4. These LAT and VERITAS spectra give indicating they can provide a stronger constraint on EBL models.
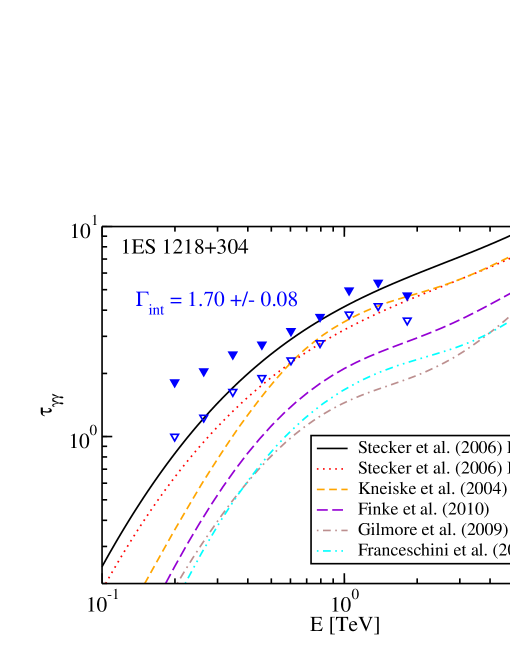
Following the same procedure as in the case of PKS 2155-304, we plot in Figure 3 the -ray SED, together with the ‘bow tie’ extrapolation of the GeV spectrum to VERITAS energies. As before, the extrapolation is used as an upper limit to the intrinsic flux of the TeV SED and the upper limit on is calculated from equation (1) and plotted in Fig. 4 along with the absorption optical depth predictions of several EBL models. As can be seen, the fast evolution model of Stecker et al. (2006) lies below the upper limit on for all but the two lowest TeV energies, and below the level at the highest TeV energy. In particular, the highest point ( TeV) is inconsistent with Stecker’s fast evolution model at . Also the Stecker et al. (2006) baseline model, and the Kneiske et al. (2004) best fit model are inconsistent at the level and level with at the highest TeV energy.
4 Conclusions
We presented a simple, model-independent method for setting upper limits to the EBL. Our method is based on the assumption that the level of the intrinsic TeV emission of blazars is below the extrapolation of the LAT SED to TeV energies. We applied our method to PKS 2155-304 and 1ES 1218+304, the only two TeV blazars of known redshift for which published simultaneous LAT-TEV observations currently exist. Even with these first applications of our method, the highest level EBL models are disfavored. Future LAT-TeV simultaneous observations hold the promise of pushing the EBL upper limits much further. We argued that it is important to devote TeV time not only to nearby sources, but also to more distant sources, hoping in both cases to observe high TeV states that for a given source will exhibit smaller GeV to TeV spectral break , and will, therefore, produce stronger constraints.
Because the most difficult observations to obtain are in the TeV band, requests to monitor particular sources with TeV facilities can be triggered from Fermi observations of high states of TeV sources. A complementary approach is X-ray monitoring of the TeV blazars. In this case, because the X-ray emission of most TeV blazars is the high energy tail of the synchrotron component, high X-ray states are, in general, a good proxy for high TeV states (e.g. Aharonian et al. (2009a)). Such X-ray monitoring holds the promise of catching states in which, while the GeV emission does not increase substantially, the TeV emission does.
We note here that our method assumes that the entire spectral break from the LAT to the TeV bands is due to EBL pair production absorption. This is an extreme assumption and it is highly probable that a substantial fraction of the break is intrinsic to the source. This in turn means that the actual level of the EBL may be significantly lower than the upper limits produced by our method. It would be very exciting and possibly hinting to new physics (e.g., Amelino-Camelia & Piran, 2001) if the lowest collective values of that our method will produce, challenge the lower level on the EBL inferred by galaxy counts (e.g., Madau & Pozzetti, 2000; Fazio et al., 2004; Béthermin et al., 2010). We anticipate that current and upcoming TeV-GeV blazar monitoring campaigns will provide plenty of opportunity for applying our method.
References
- Abdo et al. (2009a) Abdo, A. A. et al. (the Fermi collaboration) 2009a, ApJ, 700, 597
- Abdo et al. (2009b) Abdo, A. A. et al. (the Fermi collaboration) 2009b, ApJ, 707, 1310
- Acciari et al. (2010) Acciari, V. A., et al. 2010, ApJ, 709 L163
- Aharonian et al. (2006) Aharonian, F. et al. 2006, Nature, 440, 1018
- Aharonian et al. (2007) Aharonian, F., et al. 2007, ApJ, 664, L71
- Aharonian, Khangulyan, & Costamante (2008) Aharonian, F., Khangulyan, D., Costamante, L. 2008, MNRAS, 387, 1206
- Aharonian et al. (2009a) Aharonian, F., et al. 2009a, A&A, 502, 749
- Aharonian et al. (2009b) Aharonian, F., et al. 2009b, ApJ, 696, L150
- Albert et al. (2006) Albert, J., et al. 2006, ApJ, 642, L119
- Albert et al. (2007) Albert, J., et al. 2007, ApJ, 663, 125
- Albert et al. (2008) Albert J. et al. 2008, Science, 320, 1752
- Amelino-Camelia & Piran (2001) Amelino-Camelia, G. & Piran, T. 2001, PhRvD 64, 036005
- Atoyan & Dermer (2003) Atoyan, A. M., & Dermer, C. D. 2003, ApJ, 586, 79
- Band & Grindlay (1986) Band, D. L., & Grindlay, J. E. 1986, ApJ, 308, 576
- Błażejowski et al. (2000) Błażejowski, M., Sikora, M., Moderski, R., & Madejski, G. M. 2000, ApJ, 545, 107
- Béthermin et al. (2010) Béthermin, M. Dole, H., Beelen, A. Aussel, H. 2010, A&A, in press, also in astro-ph/1001.0896
- Bloom & Marscher (1996) Bloom, S. D., & Marscher, A. P. 1996, ApJ, 461, 657
- Böttcher et al. (2008) Böttcher, M., Dermer, C. D., & Finke, J. D. 2008, ApJ, 679, L9
- Dermer, Schlickeiser, & Mastichiadis (1992) Dermer,C. D., Schlickeiser, R., & Mastichiadis, A. 1992, A&A, 256, L27
- Dermer et al. (2009) Dermer, C. D., Finke, J. D., Krug, H., Böttcher, M. 2009, ApJ, 692, 32
- Dole et al. (2006) Dole, H. et al. 2006, A&A, 451, 417
- Dwek & Krennrich (2005) Dwek, E. & Krennrich, F. 2005, ApJ, 618, 657
- Fazio et al. (2004) Fazio, G. G., et al. 2004, ApJS, 154, 39
- Finke et al. (2010) Finke, J. D., Razzaque, S., & Dermer, C. D. 2010, ApJ, 712, 238
- Finke & Razzaque (2009) Finke, J. D., & Razzaque, S. 2009, ApJ, 698, 1761
- Fossati et al. (1998) Fossati, G., Maraschi, L., Celotti, A., Comastri, A., Ghisellini, G. 1998, MNRAS, 299, 433
- Franceschini et al. (2008) Franceschini, A., Rodighiero, G., & Vaccari, M. 2008, A&A, 487, 837
- Georganopoulos et al. (2008) Georganopoulos, M., Sambruna, R. M., Kazanas, D., Cillis, A. N., Cheung, C. C., Perlman, E. S., Blundell, K. M., & Davis, D. S. 2008, ApJ, 686, L5
- Gilmore et al. (2009) Gilmore, R. C., Madau, P., Primack, J. R., Somerville, R. S., & Haardt, F. 2009, arXiv:0905.1144
- Hauser & Dwek (2001) Hauser, M., & Dwek, E. 2001, ARA&A, 39, 249
- Kashlinsky (2005) Kashlinsky, A. 2005, Physics Reports, 409, 361
- Katarzyński et al. (2006) Katarzyński, K., Ghisellini, G., Tavecchio, F., Gracia, J., Maraschi, L. 2006, MNRAS, 368, L52
- Kneiske et al. (2002) Kneiske, T. M., Mannheim, K. & Hartmann, D. H. 2002, A&A 386, 1
- Kneiske et al. (2004) Kneiske, T. M., Bretz, T., Mannheim, K. & Hartmann, D. H. 2004, A&A 413, 807
- Lanzetta et al. (1993) Lanzetta, K. M. et al. 1993, ApJS, 84, 109
- Madau & Pozzetti (2000) Madau, P., & Pozzetti, L. 2000, MNRAS, 312, L9
- Mannheim & Biermann (1992) Mannheim, K., & Biermann, P. L. 1992, A&A, 253, L21
- Mazin & Raue (2007) Mazin, D. & Raue, M. 2007 A&A, 471, 439
- Miller et al. (1978) Miller, J. S. 1978, in ’BL Lac Objects’, ed. Wolfe A. M.
- Mücke & Protheroe (2001) Mücke, A., & Protheroe, R. J. 2001, Astroparticle Physics, 15, 121
- Primack et al. (2005) Primack, J. R., Bullock, J. S., & Somerville, R. S. 2005, in AIP Conf. Ser. 745, High Energy Gamma-Ray Astronomy, ed. F. A. Aharonian, H. J. Völk, & D. Horns (Melville, NY: AIP), 23
- Razzaque et al. (2009) Razzaque, S., Dermer, C. D., & Finke, J. D. 2009, ApJ, 697, 483
- Renault et al. (2001) Renault, C., Barrau, A., Lagache, G., Puget, J.-L. 2001, A&A371, 771
- Salamon & Stecker (1998) Salamon, M. H., & Stecker, F. W. 1998, ApJ, 493, 547
- Schrödter (2005) Schrödter, M. 2005, ApJ, 628, 617
- Sikora et al. (1994) Sikora, M., Begelman, M. C., & Rees, M. J. 1994, ApJ, 421, 153
- Stanev & Franceschini (1998) Stanev, T. & Franceschini, A. 1998, ApJ, 494, 159
- Stecker, de Jager, & Salamon (1992) Stecker, F. W., de Jager, O. C., & Salamon, M. H. 1992, ApJ, 390, 49
- Stecker et al. (2006) Stecker, F. W., Malkan, M. A. & Scully, S. T. 2006, ApJ, 648, 774
- Stecker, Baring, & Summerlin (2007) Stecker, F. W., Baring, M. G., Summerlin, E. 2007, ApJ, 667, L29