HD molecules at high redshift:
The absorption system at towards Q 1232+082
††thanks: Based on observations carried out at the ESO
with the UVES mounted on
the VLT, on Cerro Paranal in Chile,
under progs. ID 65.P-0038, 71.B-0136 (P.I. Srianand), and 68.A-0106, 69.A-0061, 70.A-0017 (P.I. Petitjean)
Abstract
We present a detailed analysis of the H2 and HD absorption lines detected in the Damped Lyman- (DLA) system at towards the quasar Q 1232+082. We show that this intervening cloud has a covering factor smaller than unity and covers only part of the QSO broad emission line region. The zero flux level has to be corrected at the position of the saturated H2 and optically thin HD lines by about 10%. We accurately determine the Doppler parameter for HD and C i lines ( = 1.860.20 km/s). We find a ratio / = that is significantly higher than what is observed in molecular clouds of the Galaxy. Chemical models suggest that in the physical conditions prevailing in the central part of molecular clouds, deuterium and hydrogen are mostly in their molecular forms. Assuming this is true, we derive D/H (3.6. This implies that the corresponding baryon density of the Universe is . This value coincides within 1 with that derived from observations of the CMBR as well as from observations of the D/H atomic ratio in low-metallicity QSO absorption line systems. The observation of HD at high redshift is therefore a promising independent method to constrain . This observation indicates as well a low astration factor of deuterium. This can be interpreted as the consequence of an intense infall of primordial gas onto the associated galaxy.
keywords:
observational cosmology, primordial deuterium, primeval molecular clouds, QSO: individuals: Q1232+082.1 Introduction
Molecular hydrogen in its two forms, H2 and HD, being the main cooling agent of primordial gas, plays a central role in the evolution of gas condensations and the formation of the first objects in the post-recombination Universe (see Puy et al. (1993), Palla & Galli (1995), Lepp et al. (2002), McGreer & Bryan (2008), Bromm et al. (2009)). Observations of these molecules in high-redshift clouds provide us with clues on the physico-chemical processes at work and the physical conditions prevailing in the early Universe.
The other important issue associated with deuterium follows from the fact that, among the light elements created by Primordial Nucleosynthesis, deuterium is the one whose abundance is most sensitive to the baryon density of the Universe, , or equivalently the baryon-to-photon ratio, , (e.g. Sarkar (1996), Olive et al. (2000), Coc et al. (2005), Fields & Olive (2006), Pettini et al. (2008)). The primordial deuterium abundance can be directly constrained from observation of deuterium absorption lines in high-redshift quasar spectra formed about 10-13 Gyrs ago. So far, all available D/H measurements at high-redshift are based on the determination of the column density ratio (D i)/(H i) in low-metallicity QSO absorption systems. However, this method encounters a number of difficulties. Firstly, the velocity separation between D i and H i absorption lines due to the isotope shift is rather small (km s-1). This implies that the (H i) column density must be small enough so that the D i lines are not blended into the corresponding H i lines but, at the same time high enough so that the D i lines can be detected. Secondly, the presence of the Lyman- forest makes the detection of the D i Lyman- line somewhat ambiguous because we cannot be sure that the lines treated as D i Lyman- are not weak H i Lyman- from another intervening cloud.
This explains why, in spite of intensive efforts, only nine relevant measurements have been performed to date (Pettini et al. 2008 and references therein). Moreover, it should be noted that the dispersion in the measurements exceeds the individual errors. This may indicate either the individual errors are underestimated or the method suffers from systematic effects (see a discussion of the difficulties inherent to the method by Steigman, 2007).
Here, we discuss an alternative way of constraining the primordial D/H ratio using the HD/H2 ratio measured in low-metallicity high-redshift molecular clouds. Such investigations became possible after the discovery of the first molecular absorbing cloud at high redshift (Levshakov & Varshalovich 1985). However, molecules at high redshift are rarely detected. Indeed, H2 is detected in absorption in only about 10 % of the Damped Lyman- (DLA) systems and to date only 14 H2 detections have been reported (Ledoux et al. 2003, Noterdaeme et al. 2008a). HD is seen in only two of these systems (see Varshalovich et al. (2001) for the first one and Srianand et al. (2008) for the second one). The second HD absorption system towards SDSS J143912+111740 was studied in detail by Noterdaeme et al. (2008b). They found / = for a metallicity close to solar and a molecular fraction = 2(H2)/[2(H2) + (H i)] = 0.27. This is significantly higher than what is observed in the ISM of the Galaxy for a comparable metallicity (, Lacour et al., 2005a). This can be understood if a large fraction of the deuterium in the gas originates from pristine gas infalling onto the host galaxy. Here, we present a detailed analysis of the first observed HD absorption system at towards QSO 1232+082. We present the observations in Section 2, the data analysis and the observed HD/H2 and D/H ratios in Section 3 before concluding in Section 4.
2 Observations
The high spectral resolution spectrum of the high redshift quasar PKS 1232+082 ( and ) was obtained over several observing campaigns in the course of a survey for and follow-up studies of molecular hydrogen in DLA systems with the Ultraviolet and Visible Echelle Spectrograph (UVES) mounted on the ESO Kueyen VLT telescope on Cerro Paranal in Chile (Petitjean et al. 2000, Ledoux et al. 2003, Noterdaeme et al. 2008a). We used Dichroic #1 and central wavelengths 390 and 564 nm in the blue and red spectroscopic arms respectively. The total exposure time on the source was 17.5 h. The CCD pixels were binned 22 and the slit width adjusted to 1” matching the mean seeing conditions of0.9”. This yields a resolving power of R45,000. The data were reduced using the UVES pipeline based on the ESO MIDAS system. Wavelengths were rebinned to the vacuum-heliocentric rest frame and individual scientific exposures co-added using a sliding window and weighting the signal by the total errors in each pixel.
3 Analysis of the absorption system
The detailed analysis of this absorption system reveals two interesting peculiarities: (i) firstly, as it is apparent in Fig. 1 and Fig. 2, at least the central part of the absorbing cloud does not cover the background source completely (the covering factor of the cloud is not unity) and (ii) secondly, the observed Doppler parameter, , is larger for H2 lines (4.5 km/s) than for HD and C i lines (1.9 km/s). These two effects (described in Sec. 3.1 and 3.2) have important consequences on the determination of the column densities and HD/H2 ratio (Sec. 3.3 and 3.4).
3.1 Covering factor effect
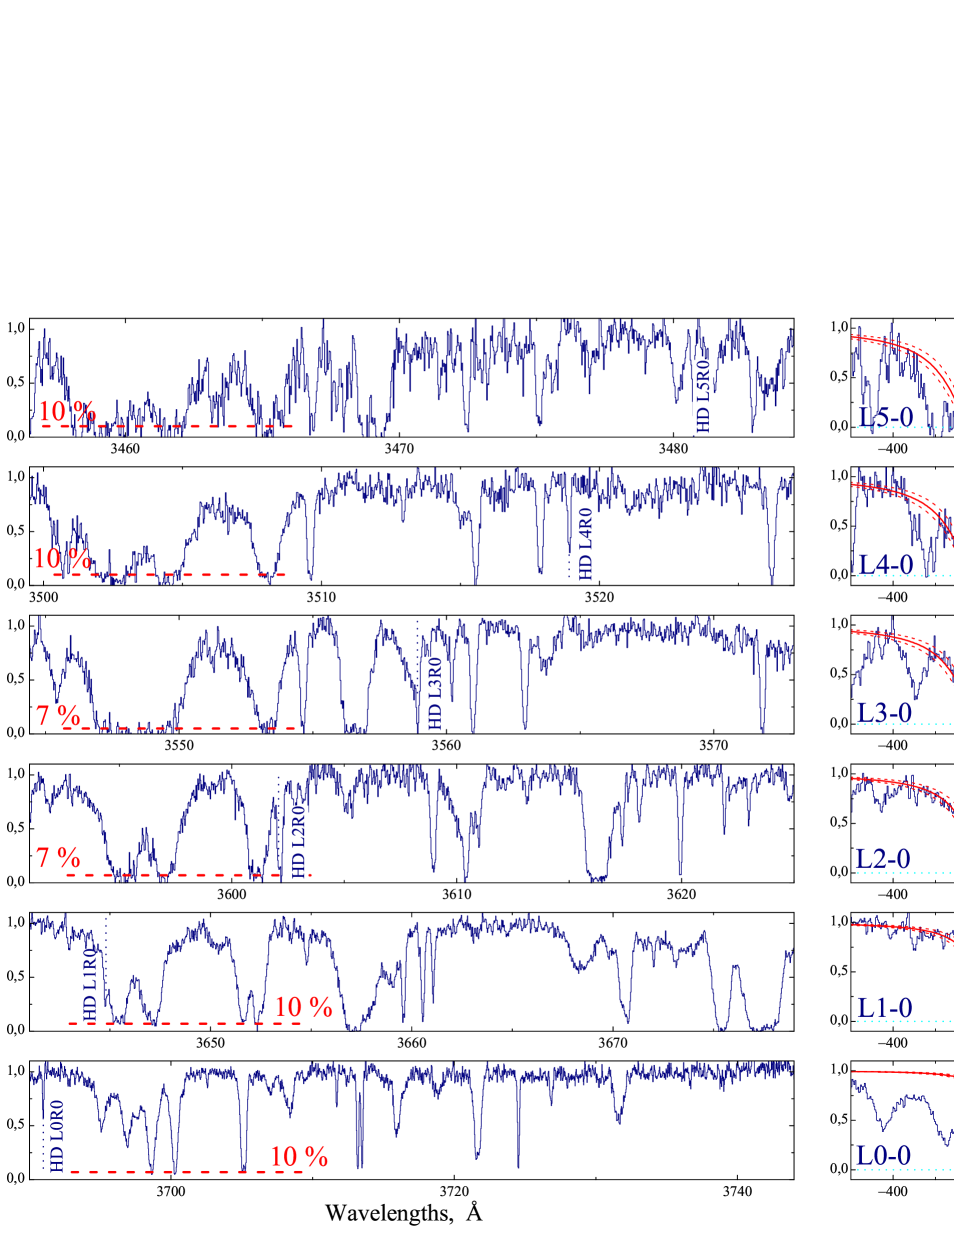
It can be seen on Fig. 1 that the profiles of strong saturated H2 absorption lines do not go to the zero flux. Some of them even show damped wings. This is apparent for the lines redshifted on top of the QSO Lyman- and O vi emission lines, in particular it is the case for the L0-0 and L1-0 H2 absorption lines. We have carefully checked that this cannot be due to an error in the positioning of the zero flux. Indeed, it can be seen on Fig. 2 that all the strong intervening Lyman- lines do go to the zero flux with a mean uncertainty of % (due to, for instance, uncertainties in the scattered light subtraction).
This means that part of the QSO radiation is not intercepted by the molecular cloud. There are several explanations for this, including: (i) the emission region of the background source has an angular size larger than the angular size of the absorbing cloud, (ii) there are two distinct background sources (tight double quasars, e.g. Foreman et al. 2009) or (iii) the quasar is lensed which implies the presence of several unresolved images.
To our knowledge this is the first time such an intervening cloud is observed and we believe this deserves a detailed discussion that we postpone to a forthcoming paper (Balashev et al. 2009a). Here, we will correct the column density determinations from this partial covering factor and concentrate on the HD content of the cloud.
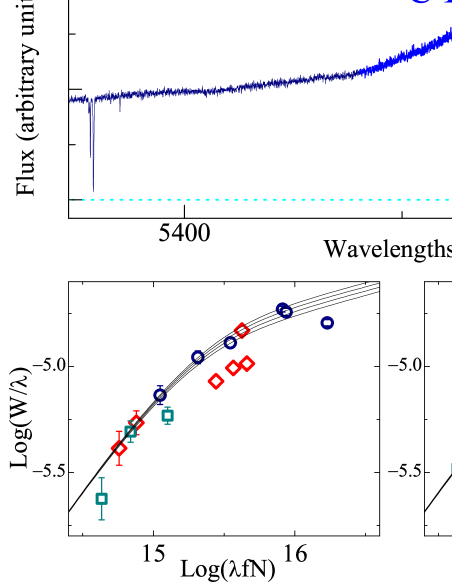
We can ascertain the partial covering factor of the cloud using the numerous C i absorption lines that are detected in the spectrum. In particular six lines are located on top of the C iv emission line (see Fig. 3). One line originates from the true C i ground state whereas, respectively, three and two lines originate from the first and second fine structure excited states (C i∗ and C i∗∗ absorption lines). We plot the positions of these lines together with other C i lines observed in the spectrum in a standard curve of growth diagram giving log () versus log () (see left hand side lower panel of Fig. 3). It can be seen that the six absorption lines located on top of the C iv emission line are situated below the curve of growth followed by the other lines. We have to correct for a covering factor of 75 % to recover a unique curve of growth (right hand side lower panel of Fig. 3). This implies that the cloud covers the QSO continuum emission region completely (ascertained by the fact that e.g. the C ii1334 line is going to zero) but only part of the broad line region. The covering factor depends on the considered emission line because regions emitting different emission lines have different sizes.
In the following, we aim at deriving the column densities of H2 and HD. Since the H2 lines are saturated, it is easy to correct for the partial covering factor by correcting the zero level. However the HD lines are not strongly saturated and we need to estimate the covering factor of these lines. Three HD absorption lines L5-0 R0, L4-0 R0 and L-00 R0 are unblended and will be used to derive (HD). It can be seen on Fig. 1 that L5-0 is redshifted at 3480 Å, on top of the QSO Lyman- emission line, L4-0 is redshifted at 3520 Å, on top of C iii987 QSO emission line, and L0-0 is redshifted at 3690 Å, on top of the O vi1031,1037 QSO emission line (see composite quasar spectra in e.g. Vanden Berk et al. 2001). As the H2 absorption lines in these wavelength ranges all have a covering factor of 90% and since most of the H2 must be co-spatial with HD, we apply the same covering factor to the HD absorption lines (see Section 3.3).
3.2 Broadening effect
Whereas an accurate determination of is possible because the most important H2 transitions are damped, the determination of the column densities for moderately saturated lines like the HD lines strongly depends on the Doppler parameter. This is why it is important to study the broadening of the lines in details.
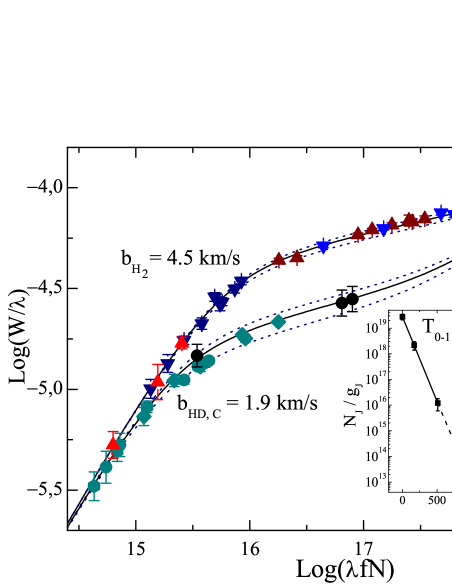
We show in Fig. 4 the curves of growth of the H2, C i and HD lines after correction for partial covering factor. It is apparent that a unique Doppler parameter describes the curve of growth of all the H2 lines on the one hand and of the C i and HD lines on the other. Corresponding values are 4.5 km s-1 and 1.9 km/s. The corresponding column densities are given in Table 1. The Doppler parameter is observed to be the same for all H2 rotational levels with a value much larger than what is expected from thermal broadening. Indeed, the excitation diagram is shown as an inset in Fig. 4 and the excitation temperature is found to be TK for the three lower rotational levels and larger for higher excitation levels. The first temperature is thought to reflect the kinetic temperature of the gas and corresponds to a thermal component of the Doppler parameter of km/s. This means that the observed Doppler parameters are mostly due to turbulent motions in the gas.
It has been observed in a few cases that the Doppler parameter of H2 lines increases with the rotational level (see Spitzer & Cochran (1973); Jenkins & Peimbert (1997); Lacour et al. (2005b) for observations in the Galaxy and Noterdaeme et al. (2007) for observations in a DLA at high redshift). Balashev et al. (2009b) have shown that this can be interpreted as a consequence of (i) radiative transfer effect: the directional radiation can lead to broadening of the high rotation level velocity distribution due to saturation of radiative pumping lines; (ii) the structure of the cloud: absorption from high rotational levels arise mostly from the external part of the cloud where temperature and turbulence are larger. In addition, not only C i atoms are ionized more easily than H2 is destroyed, but H2 is more effectively self-shielded than HD. Therefore C i and HD species are expected to be located in the central part of the cloud where turbulence is minimal and H2 molecules are mostly in their low rotational levels. Since we determine the H2 value from high rotational levels, it is not surprising to derive different a larger Doppler parameter for H2 compared to C i–HD.
| H2 | HD | ||||
| Rotational | log (J) | Rotational | log (J) | ||
| Level | (cm-2) | (km s-1) | Level | (cm-2) | (km s-1) |
| J=0 | 19.450.10 | J=0 | 15.53 | 1.860.20 | |
| J=1 | 19.290.15 | (15.510.13)⋆ | (1.580.18)⋆ | ||
| J=2 | 16.780.24 | 4.5 | J=1 | ||
| J=3 | 16.360.10 | 4.5 | |||
| J=4 | 14.700.06 | ||||
| J=5 | 14.360.07 | ||||
| cm-2 | cm-2 | ||||
⋆values calculated without taking into account covering factor
3.3 H2 and HD column densities
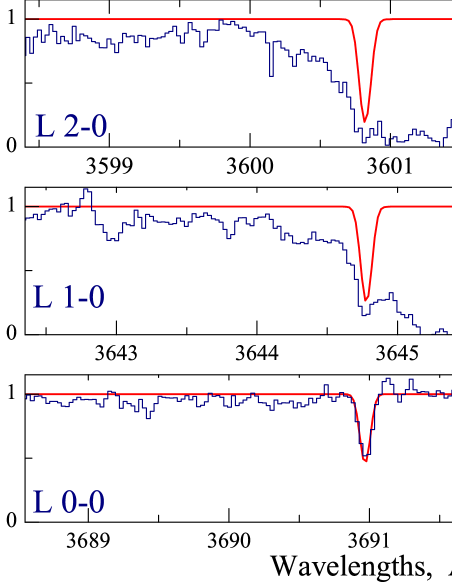
Column densities of H2 in different rotational levels (J = 0 to 5) are obtained by simultaneous fits to the Lyman 0-0 to 5-0 band transition lines (see Fig. 1). The results of the fits are presented in Table 1. The total H2 column density is cm-2. This is consistent within 1 with the results by Noterdaeme et al. (2008a). Note that the smaller value obtained by Srianand et al. (2000) is due to the fact that partial covering factor of L0-0 lines was not recognized because of the much lower signal-to-noise ratio of the data available at that time. This implies a molecular fraction of log = log[2(H2)/((HI)+2(H2))] = 0.920.15 if we assume that the neutral hydrogen is co-spatial with the molecules. We note that this is therefore probably a lower limit of the molecular fraction in the molecular part of the cloud.
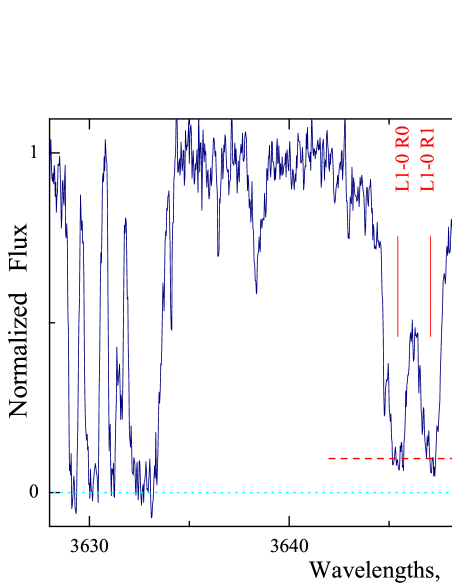
The first rotational level of deuterated molecular hydrogen is detected in six (from 0-0 to 5-0) Lyman bands covered by the observations (Fig. 5). Unfortunately, three of six lines are strongly blended and cannot be used to derive line parameters. Therefore we use only the L5-0, L4-0 and L0-0 transitions. Laboratory wavelengths and oscillator strengths for the three lines are given in Table 2. We apply a 10% correction factor to the zero flux at the position of the lines equal to what is observed for the H2 lines located close to their position in the spectrum (see Fig. 1). To convince ourselves that such covering factor must be applied, we note that HD-L4-0 at 3519 Å is located only 1 Å away from a saturated H2 line at 3519 Å that has to be corrected from this covering factor. However, we have checked that if we do not correct for partial covering factor, the best fit of the lines yields very similar result (log (HD) 15.51 and 1.58 km s-1; see Table 1). The following discussion is therefore done in the case of the lines being corrected.
The fit of the three lines is degenerate and leads to two equally acceptable solutions, consistent with two different positions of the curve of growth: either = 0.89 km/s and log (HD) = 16.55 or = 1.86 km/s and log (HD) = 15.52. Since the strength of the 15 observed C i lines are consistent with = 1.86 km/s (see Fig. 4), we favor the second solution. Indeed we expect C i and HD to be co-spatial (see discussion at the end of section 3.2). Results of analysis are illustrated in Fig. 6.
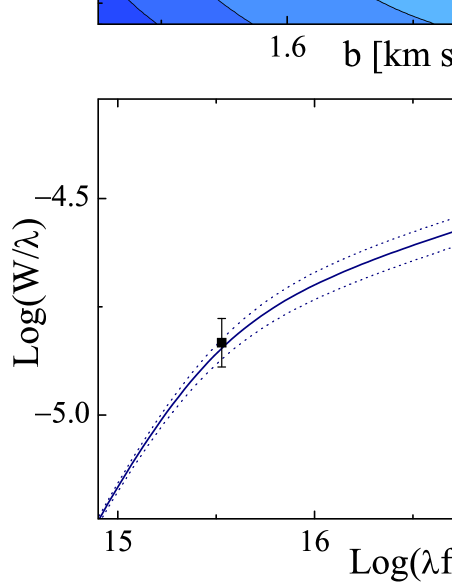
The total HD column density is therefore cm-2 (note that the calculated error includes the error on the Doppler parameter, b) and the ratio /= is the largest one ever observed in any astrophysical objects of the Galaxy (, Lacour et al., 2005a) and beyond (, Noterdaeme et al., 2008b).
| Lines | ⋆ (Å) | |
|---|---|---|
| L0R0 | 1105.84055 | 0.00082 |
| L1R0 | 1092.00126 | 0.00311 |
| L2R0 | 1078.83104 | 0.0068 |
| L3R0 | 1066.27568 | 0.0114 |
| L4R0 | 1054.29354 | 0.0161 |
| L5R0 | 1042.85005 | 0.0201 |
⋆HD laboratory wavelengths from Ivanov et al. (2008)
3.4 The D/H ratio from HD/H2
The absorption system at = 2.3377 toward Q 1232+082 has one of the lowest total metallicities among the 14 H2 system known to date, [S/H] = , for one of the highest molecular fraction (log = , see also Noterdaeme et al. 2008a). This implies that at least the densest and most central parts of the cloud has a chemical composition close to primordial. We can therefore use the HD/H2 ratio to estimate the primordial D/H ratio.
Certainly, the chemistry of molecular clouds makes the determination of the D/H isotope ratio from HD/H2 rather uncertain. Nevertheless, molecular cloud models (e.g. Le Petit et al., 2002, that is an extension of a previous PDR model, Abgrall et al., 1992; Le Bourlot, 2000) suggest that deuterium is molecular only when hydrogen is predominantly in its molecular form. In the case of Q 1232+082, we are probably very close to the conditions at which the D/HD transitions occurs. Indeed, this transition happens for cm-3, K, (when the fractions of H in H2 and D in HD are less than 4%) that corresponds approximately to what is measured in the DLA (Srianand et al. 2000, 2005; Noterdaeme et al. 2008). The formation of HD in that case is dominated by the D++H2 interaction (Le Petit et al. 2002). FUSE and Copernicus observations have also shown that in the ISM of the Galaxy, the HD/H2 ratio increases with the molecular fraction and that HD/2H2 could trace D/H well when (Lacour et al. 2005a; Linsky et al., 2006; Snow et al., 2008), when both HD and H2 are self-shielded from photo-dissociation. Self-shielding becomes efficient as soon as the optical depth of the discrete absorbing transitions is of the order of 1, that is when the column densities of HD and H2 are about cm-2. In our case, they are and cm-2, respectively. All this supports the idea that the conditions in the cloud are close to what is needed to have D/H HD/2H2 within our measurement errors.
Under the above assumption we thus derive D/H HD/2H2 (3.6)10-5 in the cloud. This corresponds to a negligible astration factor. Since the total metallicity in the absorbing cloud is not pristine, this implies that the associated object has probably undergone strong infall of primordial gas as already noted by Noterdaeme et al. (2008a).
4 Constraining
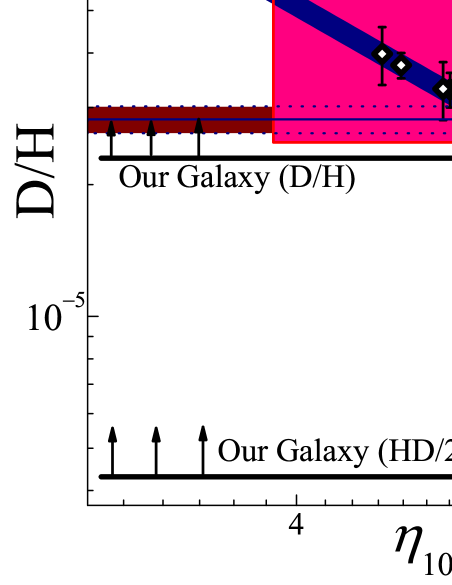
Constraints on the baryon-to-photon ratio or equivalently on the baryon density from different observations are summarized in Table 3 and illustrated in Fig. 7. The results of primordial nucleosynthesis are indicated as an inclined violet line and our result is shown as the red error box. The value derived from CMBR analysis is indicated by a vertical cyan strip. Pettini et al. (2008) mean value obtained from a compilation of D i/H i measurements in low-metallicity high-redshift clouds is indicated as an horizontal brown strip. However, Pettini et al. (2008) do not consider the Levshakov et al. (2002), Crighton et al. (2004) and Pettini & Bowen (2001) measurements when calculating this mean value. Indeed, nine determinations of the D/H ratio in low-metallicity high-redshift clouds are reported in the literature. They are shown as open circles with error bars. Whatever points are used, it is apparent from Fig. 7 that the scatter in the D i/H i measurements is much larger than the errors quoted by Pettini et al. (2008). This shows that uncertainties from all methods are large and that the derivation of D/H from measurements of HD/H2 could nicely complement other measurements especially with the advent of future large telescopes.
| Redshift | D/H | Ref.a | ||
|---|---|---|---|---|
| Local Galactic Disk | 0 | 1 | ||
| HD/2H2 | 0 | 2 | ||
| Q2206199 | 2.08 | 3 | ||
| ∗Q1009+2956 | 2.50 | 4 | ||
| ∗Q1243+3047 | 2.53 | 5 | ||
| ∗HS0105+1619 | 2.54 | 6 | ||
| ∗Q0913+072 | 2.62 | 7 | ||
| ∗SDSS15580031 | 2.70 | 8 | ||
| Q03473819 | 3.03 | 9 | ||
| Q19371009 | 3.26 | 10 | ||
| ∗Q19371009 | 3.57 | 11 | ||
| ∗Average | 23.6 | 7 | ||
| CMBR | 1500 | 12 | ||
| HD/2H2 | 2.3377 | this work |
aReferences – (1) Linsky et al. (2006),
(2) Lacour et al. (2005a), (3) Pettini & Bowen (2001) (4) Burles & Tytler (1998b),
(5) Kirkman et al. (2003), (6) O’Meara et al. (2001) (7) Pettini et al. (2008),
(8) O’Meara et al. (2006), (9) Levshakov et al. (2002), (10) Crighton et al. (2004),
(11) Burles & Tytler (1998a), (12) Komatsu et al. (2009)
∗ –
Measurements used by Pettini et al. (2008) to estimate the primordial
D/H ratio.
5 Conclusion
We have analyzed in detail the absorption system at = 2.3377 towards Q 1232+082 in which H2 and HD molecules are observed. This is the system where HD detection was reported for the first time (Varshalovich et al. 2001) and the second system in which the HD/H2 ratio is studied. We find:
-
1.
The intervening absorbing cloud does not cover the background source completely. The continuum source is covered but not the totality of the broad line region.
-
2.
The Doppler parameter measured for H2 absorption lines is approximately the same for all high rotational levels, = 4.5 km/s, and is larger than what is observed for C i and HD transitions, = 1.9 km/s. The excitation temperature of the three first rotational levels is indicative of a kinetic temperature of 70 K; the excitation temperature of the J = 3 to 5 levels being larger.
-
3.
We correct for the partial covering effect and measure the H2 and HD column densities. The total H2 and HD column densities are cm-2 and cm-2 and therefore their ratio / = . This is the largest value for HD/H2 ever observed for any astrophysical objects in the Galaxy and beyond. The HD/H2 ratio in this low-metallicity cloud is significantly larger than what is observed in interstellar clouds of the Galaxy. The astration factor of deuterium is basically zero.
-
4.
The physical conditions in the cloud makes it plausible that all hydrogen and deuterium are in molecular form. Thus, we conjecture that D/H HD/2H2 and find D/H (3.6)10-5, that is very close to the primordial values derived from other techniques. We note however that the dispersion of the D/H measurements in clouds with primordial abundances is much larger than the given errors on the measurements casting some doubts on the error box of the final result. Finally it must be reminded that the astrophysical measurements of primordial abundances of Li and 3He are still not completely consistent with the Big-Bang nucleosynthesis (e.g. Coc et al. (2005), Cyburt et al. (2008)). All this argues in favor of using the HD/H2 method with better data in order to better constrain D/H. This will be possible with the advent of the foreseen Extremely Large Telescopes.
Acknowledgments. This work has been supported by a bilateral program of the Direction des Relations Internationales of CNRS in France, by the Russian Foundation for Basic Research (grant 08-02-01246a), and by a State Program “Leading Scientific Schools of Russian Federation” (grant NSh-2600.2008.2).
References
- Abgrall et al. (1992) Abgrall H., Le Bourlot J., Pineau des Forêts G., 1992, A&A, 253, 525
- Balashev et al. (2009a) Balashev S., Varshalovich D., Ivanchik A., and Petitjean P., 2009a, in preparation
- Balashev et al. (2009b) Balashev S., Varshalovich D., Ivanchik A., 2009b, Astronomy Letters, 35, 150
- Ge & Bechtold (1999) Ge J., Bechtold J., 1999, Highly Redshifted Radio Lines, ASP Conf. Series, 156, 121
- Bromm et al. (2009) Bromm V., Yoshida N., Hernquist L., McKee C.F., 2009, Nature, 459, 49
- Burles & Tytler (1998a) Burles S., Tytler D., 1998a, ApJ, 499, 699
- Burles & Tytler (1998b) Burles S., Tytler D., 1998b, ApJ, 507, 732
- Coc et al. (2005) Coc A., Angulo C., Vangioni-Flam E., Descouvemont P., Adahchour A., 2005, Nucl. Phys. A, 752, 522
- Crighton et al. (2004) Crighton N. H. M., Webb J. K., Ortiz-Gil A., Fernandez-Soto A., 2004, MNRAS, 355, 1042
- Cyburt et al. (2008) Cyburt R.H., Fields B.D., Olive K.A., 2008, JCAP, 11, 12
- Fields & Olive (2006) Fields B. D., Olive K. A., 2006, Nucl. Phys. A, 777, 208
- Foreman et al. (2009) Foreman G., Volonteri M., Dotti M., 2009, ApJ, 693, 1554
- Ivanov et al. (2008) Ivanov T. I., Roudjane M., Vieitez M. O., de Lange C. A., Tchang-Brillet W.-U L., Ubachs W., 2008, PRL, 100, 093007
- Jenkins & Peimbert (1997) Jenkins E.B., Peimbert A., 1997, ApJ, 477, 265
- Kirkman et al. (2003) Kirkman D., Tytler D., Suzuki N., O’Meara J.M., Lubin D., 2003, ApJSS, 149, 1
- Komatsu et al. (2009) Komatsu E., et al., 2009, ApJS, 180(2), 330
- Lacour et al. (2005a) Lacour S., et al., 2005a, A&A, 430, 967
- Lacour et al. (2005b) Lacour S., et al., 2005b, ApJ, 627, 251
- Le Bourlot (2000) Le Bourlot J., 2000, A&A, 360, 656
- Ledoux et al. (2003) Ledoux C., Petitjean P., Srianand R., 2003, MNRAS, 346, 209
- Le Petit et al. (2002) Le Petit F., Roueff E., Le Bourlot J., 2002, A&A, 390, 369
- Lepp et al. (2002) Lepp S., Stancil P.C., Dalgarno A., 2002, J. Phys. B, 35, R57
- Levshakov & Varshalovich (1985) Levshakov S. A., Varshalovich D.A., 1985, MNRAS, 212, 517
- Levshakov et al. (2002) Levshakov S. A., Dessauges-Zavadsky M., D’Odorico S., Molaro P., 2002, ApJ, 565, 696
- Linsky et al. (2006) Linsky J. L., et al., 2006, ApJ, 647, 1106
- McGreer & Bryan (2008) McGreer I.D., Bryan G.L., 2008, ApJ, 685, 8
- Noterdaeme et al. (2007) Noterdaeme P., Ledoux C., Petitjean P., Le Petit F., Srianand R., Smette A., 2007, A&A, 474, 393
- Noterdaeme et al. (2008a) Noterdaeme P., Ledoux C., Petitjean P., Srianand R., 2008a, A&A, 481, 327
- Noterdaeme et al. (2008b) Noterdaeme P., Petitjean P., Ledoux C., Srianand R., Ivanchik A., 2008b, A&A, 491, 397
- Olive et al. (2000) Olive K.A., Steigman G., Walker T.P., 2000, Phys. Rep., 333, 389
- O’Meara et al. (2001) O’Meara J. M., Tytler D., Kirkman D., Suzuki N., Prochaska J. X., Lubin D., Wolfe A. M., 2001, ApJ, 552, 718
- O’Meara et al. (2006) O’Meara J. M., Burles S., Prochaska J. X., Prochter G. E., Bernstein R. A., Burgess K. M., 2006, ApJ, 649, L61
- Palla & Galli (1995) Palla F., Galli D., 1995, ApJ, 451, 44
- Petitjean et al. (2000) Petitjean P., Srianand R., and Ledoux C., 2000, A&A, 364, L26
- Pettini & Bowen (2001) Pettini M., Bowen D. V., 2001, ApJ, 560, 41
- Pettini et al. (2008) Pettini M., Zych B. J., Murphy M. T., Lewis A., Steidel C.C., 2008, MNRAS, 391, 1499
- Puy et al. (1993) Puy D., Alécian G., Le Bourlot J., Léorat J., Pineau des Forêts G., 1993, A&A, 267, 337
- Sarkar (1996) Sarkar S., 1996, Rep. on Progress in Phys., 95, 1493
- Snow et al. (2008) Snow T.P., Ross T.L., Destree J.D., Drosback M.M., Jensen A.G., Rachford B.L., Sonnentrucker P., Ferlet R., 2008, ApJ, 688, 1124
- Spitzer & Cochran (1973) Spitzer L. J., Cochran W. D., 1973, ApJ, 186, 23
- Srianand et al. (2008) Srianand R., Noterdaeme P., Ledoux C., Petitjean P., 2008, A&A, 482, L39
- Srianand et al. (2000) Srianand R., Petitjean P., Ledoux C., 2000, Nature, 408, 931
- Srianand et al. (2005) Srianand R., Petitjean P., Ledoux C., Ferland G., Gargi S., 2005, MNRAS, 362, 549
- Steigman (2007) Steigman G., 2007, Ann. Rev. Nucl. Part. Sci., 57, 463
- Vanden Berk (2001) Vanden Berk, D. E., et al., 2001, AJ, 122, 549
- Varshalovich et al. (2001) Varshalovich D., Ivanchik A., Petitjean P., Srianand R., Ledoux C., 2001, Astronomy Letters, 27, 683