Surprising Metallicity of a Newly Discovered M79 Post-AGB Star
Abstract
A detailed chemical composition analysis based on a high-resolution () CCD spectrum is presented for a newly discovered post-AGB star in the globular cluster M79 for the first time. The elemental abundance results of M79 Post-AGB star are found to be -0.7, +1.4, 0.5, and -0.1. The surprising result is that the iron abundance of the star is apparently about 0.6 dex less than that of the cluster’s red giants as reported by published studies including a recent high-resolution spectroscopic analysis by Carretta and colleagues.
Department of Astronomy and The W.J. McDonald Observatory, University of Texas, Austin, TX 78712, USA
1. Introduction
In this study, published recently in full by Şahin & Lambert (2009), we report on an abundance analysis of the A-type m79 PAGB star discovered by Siegel & Bond (2009, in preparation) in the globular cluster M79 and compare its composition to that of the cluster’s red giants. The initial mass of this star must have been slightly in excess of the mass of stars now at the main sequence turn-off, say, . The star’s composition may be referenced to that of the cluster’s red giant stars for which abundance analyses have been reported. Comparison of abundances for the PAGB and RGB stars may reveal changes imposed by the evolution beyond the RGB; such changes are not necessarily attributable exclusively to internal nucleosynthesis and dredge-up. It was in the spirit of comparing the compositions of the PAGB and RGB stars that we undertook our analysis. For the RGB stars, we use results kindly provided in advance of publication by Carretta (2008, private communication).
2. Observations
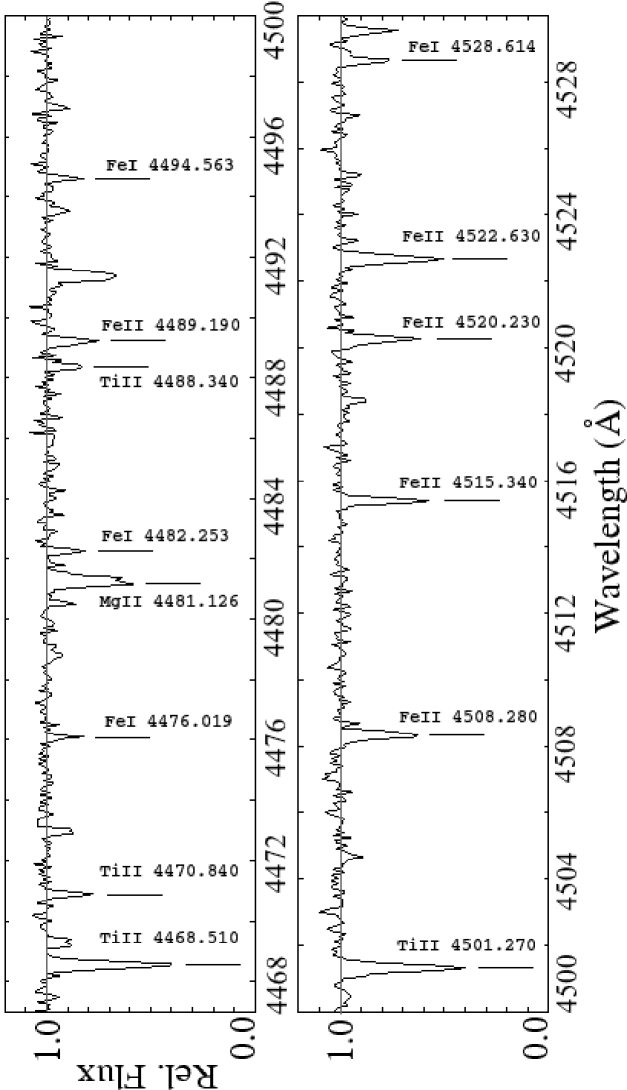
Spectra for the abundance analysis were obtained on five nights between 2008 January 15 and March 3 with the 2.7 meter Harlan J. Smith reflector and its é cross-dispersed échelle spectrograph (Tull et al. 1995). Full spectral coverage is provided from 3800 Å to 5700 Å with incomplete but substantial coverage beyond 5700 Åto 10 200 Å ; the effective short and long wavelength limits are set by the useful S/N ratio. A ThAr hollow cathode lamp provided the wavelength calibration. Flat-field and bias exposures completed the calibration files. Observations were reduced using standard procedures. A section of the final spectrum is shown in Figure 1. The heliocentric radial velocity measured form the final spectrum is 2115 km s-1 with no evidence of a variation greater than about 7 km s-1 over the observing runs. This velocity is consistent with the cluster’s velocity of +207.5 km s-1 given by Harris (1996). This agreement between the PAGB star’s velocity and that of the cluster confirms a result given by Siegel and bond (2009, in preparation).
3. Spectral Analysis
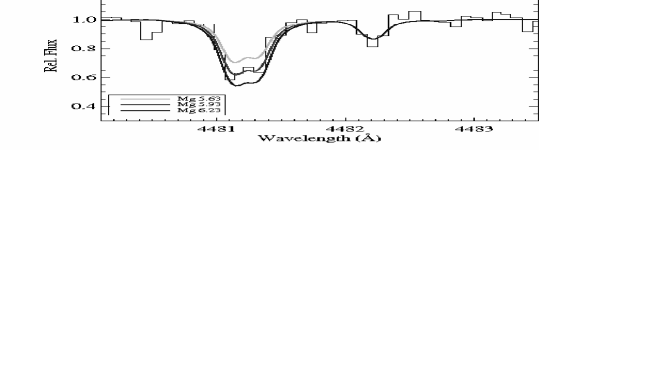
The abundance analysis was undertaken with models drawn from the ATLAS9 grid (Kurucz 1993) and the line analysis programme MOOG (Sneden 2002). The models are line-blanketed plane-parallel atmospheres in Local Thermodynamical Equilibrium (LTE) and hydrostatic equilibrium with flux conversation. A model is defined by the parameter set; effective temperature , surface gravity , chemical composition as represented by metallicity and all models are computed for a microturbulence km s-1. A model defined by the parameter set is fed to MOOG except that is determined from the spectrum and not set to the canonical 2 km s-1 assumed for the model atmosphere. In Şahin & Lambert (2009), we discuss several methods in an attempt to find consistent values for the and from photometry and spectroscopy. Application of photometric and spectroscopic indicators of the atmospheric parameters for the PAGB star led to the consensus choice of K and =0.8. A model with these parameters (and a micro-turbulence km s-1) fits not only the indicators but also the locus in the versus plane provided by the constraint on the star’s luminosity and mass. Errors on these quantities are 300 K, 0.2 (cgs), and 0.5 km s-1 respectively. Synthetic spectrum fitting results for the 4481 Å magnesium triplet and resonance strontium lines at 4077 Å and 4215 Å are presented in Figs. 2 and 3 as representative of - and -process elements.
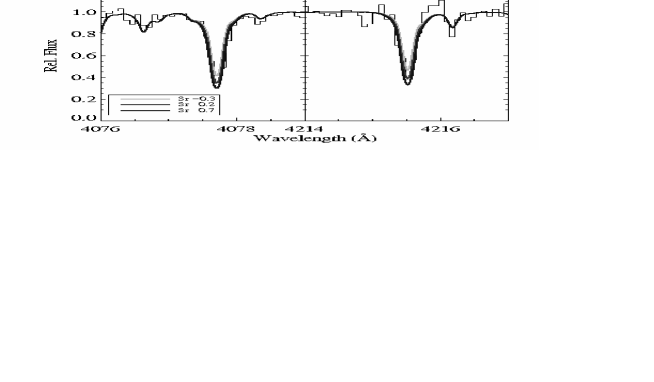
Table 1 summarizes the PAGB star’s composition not only for the consensus model but also for other three different model atmospheres and contrasts it with the mean composition of the RGB stars. The abundance relative to iron [X/Fe] is also presented. The standard notation is used here, i.e. . The PAGB star’s Fe abundance is dex lower than that of the RGB stars. For the majority of the investigated elements, the difference in abundance (X) in the sense (Ours Carretta) is within the range dex, i.e., the differences are equal to dex to within measurement uncertainties.The exceptions are O, Na, Si, and Sr. A search (see Şahin & Lambert 2009) for an explanation of the composition difference between the PAGB and RGB stars in terms of nucleosynthesis and dredge-up, dust-gas winnowing, and the first ionization potential (FIP) effect proved negative.
4. Results
Many determinations of the metallicity [Fe/H] of cluster red giants have given estimates near [Fe/H] (Standard notation is used for quantities [X] where [X]=(X)(X)⊙). For example, Zinn & West (1984) give [Fe/H] and Kraft & Ivans (2003) give [Fe/H]. Recently from high-resolution UVES FLAMES spectra Carretta and colleagues (2008, private communication) performed an abundance analysis for 20 elements obtaining [Fe/H] for a sample of ten RGB stars. The exploration through quantitative spectroscopy of the newly discovered PAGB star in the globular cluster M79 has led to an unexpected and, therefore, fascinating result: the standard LTE analysis of the star has resulted in a metallicity different from that of the RGB stars analyzed also by standard LTE techniques by Carretta. The consensus model of (6300,0.8) provides a [Fe/H] of but the RGB analysis gives a [Fe/H] of .
The star does not show -process enhancement. Oxygen and - process elements are enhanced. Abundances relative to iron appear to be the same for the post-AGB star and the red giants for the 15 common elements. It is suggested that the explanation for the lower abundances of the post-AGB star may be that its atmospheric structure differs from that of a classical atmosphere; the temperature gradient may be flatter than predicted by a classical atmosphere.
Acknowledgments.
This research has been supported in part by the grant F-634 from the Robert A. Welch Foundation of Houston, Texas.
References
- (1) Harris, W. E., 1996, AJ, 112, 1487
- (2) Kraft, R. P., Ivans, I. I., 2003, PASP, 115, 143
- (3) Sneden, C., 2002, MOOG An LTE Stellar Line Analysis Program
- (4) Şahin T., Lambert D. L. 2009, MNRAS, 398, 1730
- (5) Tull, R. G., MacQueen, P. J., Sneden, C., Lambert, D. L., 1995, PASP, 107, 251
- (6) Zinn, R., West, M. J., 1984, ApJS, 55, 45