The INTEGRAL view of Gamma-Ray Bursts
Abstract
After more than six and half years in orbit, the ESA space observatory INTEGRAL has provided new, exciting results in the soft gamma-ray energy range (from a few keV to a few MeV). With the discovery of about 700 hard X-Ray sources, it has changed our previous view of a sky composed of peculiar and “monster” sources. The new high energy sky is in fact full of a large variety of normal, very energetic emitters, characterized by new accretion and acceleration processes (see also IBIS cat4 (Bird et al., 2009)). If compared to previous IBIS/ISGRI surveys it is clear that there is a continual increase in the rate of discoveries of HMXB and AGN, including a variety of distant QSOs. This is basically due to increased exposure away from the Galactic Plane, while the percentage of sources without an identification has remained constant. At the same time, about one GRB/month is detected and imaged by the two main gamma-ray instruments on board: IBIS and SPI. INTEGRAL, after six and half years of observations, has completed the Core Programme phase and is now fully open to the scientific community for Open Time and Key Programme observations, with AO7 recently announced by ESA.
In this paper we review the major achievements of the INTEGRAL Observatory in the field of Gamma Ray Bursts.
Keywords:
-rays, GRB, surveys:
95.85.Pw -ray; 98.70.Rz -ray sources; -ray bursts; 95.80.+p sky surveys; 95.55.Ka X- and -ray telescopes and instrumentation; 95.30.Gv Radiation mechanisms; polarization1 The INTEGRAL Observatory
The ESA INTEGRAL (International Gamma-Ray Astrophysics Laboratory) observatory was selected in June 1993 as the next medium-size scientific mission within the ESA Horizon 2000 programme. INTEGRAL (Winkler et al., 2003), is dedicated to the fine spectroscopy (2.5 keV FWHM @ 1 MeV) and fine imaging (angular resolution: 12 arcmin FWHM) of celestial gamma-ray sources in the energy range 15 keV to 10 MeV. While the imaging is carried out by the imager IBIS (Ubertini et al., 2003), the fine spectroscopy is performed by the spectrometer SPI (Vedrenne et al., 2003) and coaxial monitoring capability in the X-ray (3-35 keV) and optical (V-band, 550 nm) energy ranges is provided by the JEM X and OMC instruments (Lund et al., 2003; Mass-Hesse et al., 2003). SPI, IBIS and Jem-X, the spectrometer, imager and X-ray monitor, are based on the use of the coded aperture mask technique, which is a key method used to provide images at energies above tens of keV, where photon focusing becomes impossible using standard grazing techniques. Moreover, coded masks optimise background subtraction capability because of the opportunity to observe the source and the off-source sky at the same time. This is achieved simultaneously for all the sources present in the telescope field of view. In fact, for any particular source direction, the detector pixels are divided into two sets: those capable of viewing the source and those for which the flux is blocked by opaque tungsten mask elements. This very well established technique is discussed in detail by (Skinner and Connell, 2003) and is extremely effective in controlling the systematic error in all telescope observations, working remarkably well for weak extragalactic field sources as well as for crowded galactic regions, such as our Galactic Center. The mission was conceived from the beginning as an observatory led by ESA with contributions from Russia (PROTON launcher) and NASA (Deep Space Network ground station). INTEGRAL was launched from Baikonur on October 17th, 2002 and inserted into an highly eccentric orbit (characterized by 9000 km perigee and 154000 km apogee). The high perigee was used in order to provide long uninterrupted observations with nearly constant background and away from the electron and proton radiation belts. Scientific observations can then be carried out while the satellite is above a nominal altitude of 60000 km while entering the radiation belts, and above 40000 km while leaving them. This strategic choice ensures that about 90% of the time is used for scientific observations with a data rate of realtime 108 kbps science telemetry being received from the ESA station at Redu and NASA station at Goldstone. The data are received by the INTEGRAL Mission Operation Centre (MOC) in Darmstadt (Germany) and relayed to the Science Data Center (ISDC, (Courvoisier et al., 2003)) which provides the final consolidated data products to the observers and later archives them for public use. The proprietary data become public one year after their distribution to single observation PIs.
To date INTEGRAL has already carried out more than 6 years of Core, Key and Guest Observer Programme observations in the energy range from 5 keV up to 10 MeV with high angular resolution (few arcmin PSLA of the IBIS imager) and excellent spectral capability (2.5 keV spectral resolution of the SPI germanium spectrometer).
2 Highlights from the Integral GRB sample
2.1 The 1st bursts in the sample
2.1.1 GRB 021125
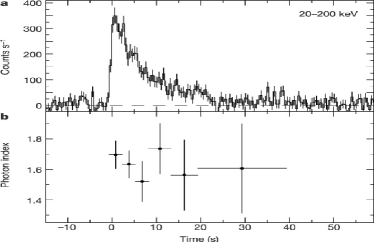
Just a few weeks after its launch, INTEGRAL started an in-orbit calibration observing Cyg X-1. On November 25th, 2002, the satellite was set up for a special observation with the PICsIT layer in the non-standard photon-by-photon mode (Di Cocco et al., 2003). Since PICsIT operates in an energy band where the background rate is very high, to perform the calibration it was necessary to limit the operative range below 500 keV and to strongly reduce the telemetry allocation to the other instruments (SPI, JEM-X, OMC were sending only housekeeping data to ground) and to the ISGRI layer of IBIS. During this test, at 17:58:30 UTC a GRB occurred in the partially coded field of view of IBIS (about off-axis) and lasted about 24 s (Bazzano and Paizis, 2002; Malaguti et al., 2003). The burst was soon confirmed by the Inter Planetary Network (IPN, (Hurley et al., 2002)). GRB 021125 was the first GRB detected by INTEGRAL in the field of view of the IBIS imager. The sky coordinates reconstructed with IBIS and SPI were in agreement with each other, and consistent with the IPN error box. The spectrum and light curve, obtained using independent methods, yielded consistent results. GRB 021125 thus proved the capabilities of the instruments on board the INTEGRAL satellite for GRB observations.
2.1.2 GRB 030131
Although not specifically designed as a GRB-oriented mission, INTEGRAL has contributed to the rapid localization of GRBs thanks to the INTEGRAL Burst Alert System (IBAS, (Mereghetti et al., 2001)). This software, running at the ISDC (Courvoisier et al., 2003), is able to detect and localize GRBs with a precision of a few arcminutes in a few seconds, and to distribute their coordinates in near real time over the Internet. In addition, the high sensitivity of the INTEGRAL instruments is particularly well-suited to study in detail the prompt -ray emission of the faintest bursts. On January 31 2003 at 07:38:49 UTC, GRB 030131 was detected in the field of view of IBIS and SPI. The IBIS/ISGRI time-resolved spectroscopy of the burst (Götz et al., 2003) was consistent with the overall hard-to-soft evolution observed by BATSE in brighter GRBs (Preece et al., 1998; Ford et al., 1995). However, the fluence of GRB 030131 was an order of magnitude smaller, indicating that such spectral behavior also applied to fainter GRBs. Clear evidence of such behavior was also reported for bursts studied with BeppoSAX in the 2-700 keV energy range (e.g. (Frontera et al., 2000)).
2.2 From extremely hard to soft bursts
2.2.1 GRB 030406
ISGRI and PICsIT can act as a Compton telescope, registering photons that are scattered in one and absorbed in the other detector. The coincidence time window is a parameter programmable on-board and the mode is sensitive between 200 keV and MeV. Thanks to the Compton mode data, INTEGRAL has been able to make successful, independent burst localizations, as in the case of GRB 030406 ((Marcinkowski et al., 2006) and references therein). GRB 030406 was detected by SPI-ACS on-board INTEGRAL as well as by Ulysses, Konus, and Mars Odyssey (Hurley et al., 2003). It was a long burst lasting s. Ulysses reported a fluence of erg cm-2 s-1 (25-100 keV). In the 50 keV - 3 MeV energy range, a fit to the spectrum of the burst peak (2.8 s around the maximum) with a broken power law, revealed that the peak was very hard. Below 400 keV, the spectrum increased with index , and above this energy the index was still positive and equal to (Marcinkowski et al., 2006). Compared to the distribution of the low and high energy spectral indices of the sample of 156 bright BATSE bursts presented by (Preece et al., 2000), both the low and the high energy spectral indices of GRB 030406 would lie in the upper tails of the corresponding distributions in this BATSE sample. Its spectrum was thus in clear contradiction with the synchrotron model of GRBs (Katz et al., 1994; Tavani et al., 1995), which predicts that there is a strict upper limit on the low energy spectral index of (Preece et al., 1998). The low energy spectral slope of the burst was instead consistent within the error bars with the jitter radiation model of GRBs (Medvedev et al., 2000). (Ghirlanda et al., 2003) also showed that the low energy spectral slopes of several GRBs are indeed much larger than expected in the synchrotron model (). Furthermore, GRB 030406 provided a hint for the existence of bursts with the peak of spectrum, , above the distribution shown by (Mallozzi et al., 1995) which truncates at MeV for the bright BATSE bursts. An MeV, as estimated for GRB 030406 ( lower limit), is also on the high end of the Amati (and Ghirlanda) relation (Amati et al., 2002; Ghirlanda et al., 2004). According to such a relation, the estimated isotropic radiated energy is larger than ergs, where the uncertainty stems from the inaccuracy of the Amati relation (Marcinkowski et al., 2006). GRB 030406 thus showed that hard bursts are very energetic. In summary, GRB 030406 confirmed that INTEGRAL in the Compton mode can detect hard GRBs, with a localization accuracy of a few degrees (Marcinkowski et al., 2006). The GRB spectra can be studied in the range from keV to MeV depending on the location of the burst in the instrument coordinates.
2.2.2 XRF 040812
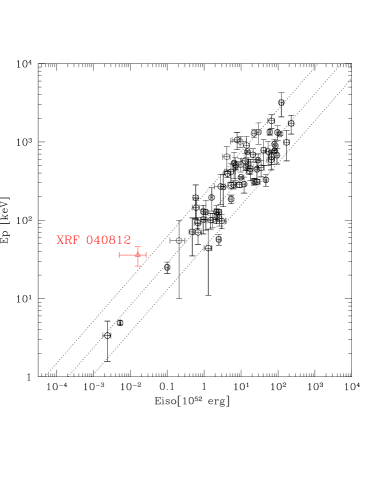
In addition to very hard bursts, INTEGRAL has also yielded interesting results on much softer GRBs, as for the case of the X-Ray Flash (XRF) 040812. XRF 040812 was discovered by INTEGRAL on 2004 August 12.251 UT, with the IBIS/ISGRI instrument in the 15-200 keV band ((Gotz et al., 2004) and Fig. 1). A spectral analysis of the burst revealed good agreement with a Band model (Band et al., 1993), with low energy photon index and high energy photon index . The spectrum peaked at an energy keV (see Fig. 2), and the 20-200 keV flux was measured to be ergs cm-2 s-1. Two epochs of Chandra observations (5 and 10 days after the burst) revealed the presence of a fading, uncatalogued source within the INTEGRAL error box (Campana and Moretti, 2004; Campana et al., 2004). Optical observations at the VLT started 0.7 days after the XRF and the monitoring continued until 220 days after (D’Avanzo et al., 2006), when the level of the host galaxy emission was reached. These observations constrained the redshift to lie in the range (D’Avanzo et al., 2006). Taking into account the cosmological redshift, and using INTEGRAL data, it was possible to establish that XRF 040812 was consistent with the relation, ranking among X-Ray Rich GRBs rather than an intrinsic XRFs (see Fig. 3 and Fig. 6 in (Stratta et al., 2007)).


2.3 Peculiar spectral features: Fe-line and inverse Compton emission
GRB 030227 was the first GRB for which the quick localization obtained with the IBAS has led to the discovery of X-ray and optical afterglows (see (Mereghetti et al., 2003) and references therein). The IBAS alert message with the preliminary position of the burst was delivered to the IBAS Team at 08:42:38 UT on 2003 February 27, only 35 s after the start of the burst (most of this delay was due to buffering of the telemetry on board the satellite and to data transmission between the ground station and the ISDC). Unfortunately, the Internet message with these coordinates could not be distributed in real time. In fact, the detection of GRB 030227 occurred during a calibration observation of the Crab Nebula. Since the instrument configuration during these observations caused some spurious IBAS triggers, the automatic delivery of the alerts to external clients had been temporarily disabled. Nevertheless, this information was distributed within less than 1 hr after the GRB (at 08:42:03 UT). GRB 030227 had a duration of about 20 s, thus belonging to the class of long GRBs. Its peak flux and fluence, converted to the BATSE 50-300 keV energy range, were photons cm-2 s-1 and ergs cm-2, respectively (Mereghetti et al., 2003). About three-quarters of the GRBs in the fourth BATSE catalog (Paciesas et al., 1999) had a higher peak flux, indicating that GRB 030227 was quite faint. The burst time-averaged spectrum was fit by a single power-law with photon index . The 20-200 keV flux of the burst was measured to be ergs cm-2 s-1. Based on the background-subtracted count rates in the ranges 40-100 keV and 20-40 keV, both SPI and IBIS showed evidence for a hard-to-soft evolution of the burst (Mereghetti et al., 2003).
XMM-Newton observed the position of GRB 030227 for hrs, starting on February 27 at 16:58 UT, about 8 hrs after the event (Mereghetti et al., 2003). An absorbed power-law fit to the afterglow spectrum gave an unacceptable fit. An acceptable one could be obtained by fixing to the Galactic value and adding a redshifted neutral absorption, which yielded an estimated redshift of (Mereghetti et al., 2003). The fit residuals suggested the presence of possible lines in the spectrum. Adding Gaussian lines at different energies and with fixed widths, smaller than the instrumental resolution, a possibly significant line was found at an observed energy of keV (Mereghetti et al., 2003). According to an F-test, such a line was significant at the level (to be considered with caution, see (Protassov et al., 2002)). If interpreted as being due to Fe, as suggested for similar features observed in other afterglows (see e.g. (Piro et al., 1999a, b; Antonelli et al., 2000; Amati et al., 2000; Piro et al., 2000; Protassov et al., 2000; Yoshida et al., 2001)), the implied redshift of (depending on the Fe ionization state) was consistent with the value derived from the absorption (but other interpretations in terms of lighter elements were also possible (Watson et al., 2003)).
ToO observations were triggered starting at 5.3 hrs with different optical telescopes (Castro-Tirado et al., 2003). The spectral flux distribution of the optical afterglow of GRB 030227 on 28.24 UT Feb 2003, determined by means of the broad-band photometric measurements obtained with the different telescopes, gave a NIR/optical spectral index of , consistent with the spectral index for the unabsorbed X-ray spectrum (, (Mereghetti et al., 2003)). However, the NIR/optical and X-ray spectra did not match each other’s extrapolations, similarly to other previously and more recently observed GRBs (Harrison et al., 1999; in’t Zand et al., 2001; Corsi et al., 2005). Considerable extinction in the host galaxy (considering different extinction laws) could not explain such an effect (Castro-Tirado et al., 2003). Thus, it was suggested that in contrast to the NIR/optical band, where synchrotron processes dominate, an important contribution of inverse Compton scattering was present in the X-ray spectrum, besides line emission (Mereghetti et al., 2003; Watson et al., 2003). This implied a lower limit on the density of the external medium of cm-3 (Castro-Tirado et al., 2003).
2.4 A low-luminosity, nearby GRB
GRB 031203 was detected by IBIS on December 3, 2003 at 22:01:28 UTC. The light curve in Fig. 4 a shows a single pulse with a duration of 40 s. The spectrum was also typical for a long-duration GRB and was well fit by a single power-law model that constrained keV (Sazonov et al., 2004). GRB 031203 is the fourth nearest GRB detected to date at a redshift of and is notable for its unambiguous spatial and temporal association with the supernova SN 2003lw. It is a confirmed low-luminosity GRB with an isotropic energy of erg (20–200 keV). GRB 980425, with an isotropic energy release of erg was the first such underluminous GRB to be detected and was associated with the nearby () SN 1998bw. Both GRB 980425 and GRB 031203 violate the Amati correlation between isotropic energy, and peak energy, , that would predict keV (Ghisellini et al., 2006). These GRBs are clearly sub-energetic in the -ray band, and their proximity (and hence implied abundance) makes it of great interest to understand their origin and relation to the more distant cosmological GRBs.
2.5 Polarisation studies
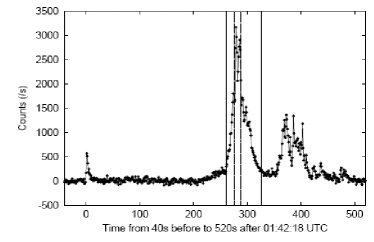
Linear polarisation in GRB prompt emission is an important diagnostic with the potential to significantly constrain GRB emission models (see e.g. (Toma et al., 2008) and references therein for a recent discussion of this topic). GRB 041219a is the most intense burst localised by INTEGRAL with a fluence of ergs cm-2 over the energy range 20 keV - 8 MeV (McGlynn et al., 2007), and is an ideal candidate for such a study. GRB 041219a was detected by IBAS and ISGRI at 01:42:18 UTC on December 19th 2004 (Goẗz et al., 2004). The burst was in the fully coded field of view of both ISGRI and SPI and was off the X-axis, and in azimuth from the Y-axis. It was also detected by the Burst Alert Telescope (BAT) on-board the Swift satellite (Barthelmy et al., 2004). A value of 186 s ( keV -8 MeV) was determined from the SPI light curve. The temporal structure of the burst was unusual, with an initial weak precursor pulse followed by a long quiescent time interval and the main emission beginning at s post trigger (MacBreen et al., 2006). Although the SPI light curve is quiescent from s, emission was detected in the BAT light curve, particularly in the lower energy channels 15-25 keV and 25- 50 keV (Fenimore et al., 2004). In addition, a spectrally soft pulse was detected in the All Sky Monitor (ASM) (Levine et al., 2004a), beginning at 80 s in the quiescent period of the SPI observation (Levine et al., 2004b).
Polarisation can be measured by INTEGRAL/SPI using multiple events scattered into adjacent detectors because the Compton scatter angle depends on the polarisation of the incoming photon. For the case of GRB 041219a, (Kalemici et al., 2007) found that the distribution of azimuthal scattering angles was better represented by a polarized source compared to a non-polarized source, but with low statistical significance. Using multiple-detector coincidence events in the 100-350 keV energy band, such analysis yielded a polarization fraction (Kalemici et al., 2007), which statistically did not allow the authors to claim a polarization detection from this source. Moreover, different event selection criteria lead to even less significant polarization fractions, e.g., lower polarization fractions were obtained when higher energies were included in the analysis (Kalemici et al., 2007), and the possibility that the measured modulation was dominated by instrumental systematics could not be ruled out (Kalemici et al., 2007).
(McGlynn et al., 2007) have also carried out polarisation studies on GRB 041219a, comparing the observed data to various combinations of simulated polarised and unpolarised data. The analysis was carried out dividing the scatter pairs into 6 different directions (0 - 300 degrees) and in the energy ranges 100 - 350 keV and 100 - 500 keV. The degree of linear polarisation in the GRB brightest pulse of duration 66 s (see Fig. 5) was found to be at an angle of degrees in the 100 - 350 keV energy range. The degree of polarisation was also constrained in the brightest 12 s of the GRB (see Fig. 5) and a polarisation fraction of at an angle of degrees was determined over the same energy range. However, despite extensive analysis and simulations, a systematic effect that could mimic the weak polarisation signal could not be definitively excluded. Over several energy ranges and time intervals, the results by (McGlynn et al., 2007) were consistent with a polarisation signal of about but at a low level of significance (). By fitting the azimuthal scatter angle distribution of the observed data over the 6 directions, (McGlynn et al., 2007) obtained results consistent with (Kalemici et al., 2007) in both magnitude and direction, within the limits given by the large error bars. Also, (McGlynn et al., 2007) agreed with the conclusions of (Kalemici et al., 2007) that the possibility of instrumental systematics dominating the measured effect cannot be excluded.
More recently, (Götz et al., 2009) reported on the polarization measurement of the prompt emission of GRB 041219a, performed using IBIS. Being composed of the two position sensitive detector layers ISGRI and PICsIT, IBIS can be used as a Compton polarimeter (Lei et al., 1997), thanks to the polarization dependency of the differential cross section for Compton scattering. (Götz et al., 2009) analyzed the different portions of the GRB 040219a prompt light curve, focusing on the brightest parts. More specifically, they analyzed the entire first and second peak, and then performed a time-resolved analysis composed of 36 intervals lasting 10 s, each one overlapping for 5 s with the previous one, over the whole duration of the GRB starting at 01:46:22 UT until 01:49:22 UT. No polarization signal could be found integrating over the whole first peak, with an upper limit of . On the other hand, a modulated signal was seen in the second peak, corresponding to a polarization fraction of . Integrating over smaller portions of the GRB, highly polarized signals were measured. Results by (Götz et al., 2009) were consistent with those by (McGlynn et al., 2007) for the 12 s interval on the brightest part of the GRB. However, (Götz et al., 2009) did not confirm the result by (McGlynn et al., 2007) on the broader 66 s time interval, where they did not detect any polarized signal.
(Götz et al., 2009) have discussed their results in the light of different emission models for GRB prompt emission: (i) Synchrotron emission from shock-accelerated electrons in a relativistic jet with an ordered magnetic field contained in the plane perpendicular to the jet velocity (Granot et al., 2003; Granot and Königl, 2003; Nakar et al., 2003); (ii) Synchrotron emission from a purely electromagnetic outflow (Lyutikov et al., 2003); (iii) Synchrotron emission from shock-accelerated electrons in a relativistic jet with a random field generated at the shock and contained in the plane perpendicular to the jet velocity (Ghisellini et al., 1999; Waxman et al., 2003); (iv) Inverse Compton emission from relativistic electrons in a jet propagating within a photon field (“Compton drag” model, (Lazzati et al., 2004)). Given that for the case of GRB 041219a the polarization level was varying on short timescales (reaching high values), that the polarization angle was varying as well, and that the time-averaged value over longer intervals showed reduced polarization, (Götz et al., 2009) concluded that, despite being consistent with more than one model, their results for this GRB favor synchrotron radiation from a relativistic outflow with a magnetic field, which is coherent on an angular size comparable with the angular size of the emitting region (, scenario (i)).
3 Global Properties of GRBs observed by INTEGRAL
3.1 Duration, spectral index and peak flux distributions
The distribution of INTEGRAL GRBs, measured in the 20–200 keV energy range, is shown in Fig. 6 and compared with the bimodal distribution obtained for BATSE GRBs (Kouveliotou et al., 1993). There is reasonable agreement between the two distributions, especially when the small number of INTEGRAL GRBs is taken into account.

The distribution of photon indices is shown in Fig. 7 for INTEGRAL and Swift GRBs for which a power-law model was fit to the spectral data in the 20–200 keV and 15–150 keV energy ranges, respectively. In comparison to Swift, INTEGRAL detects proportionally more soft GRBs with steeper power-law photon indices.

Fig. 8 compares the peak flux distribution of the GRBs observed by IBIS to that observed by the BAT instrument on Swift. IBIS detects proportionally more weak GRBs than Swift because of its better sensitivity within a field of view that is smaller by a factor of 12.

3.2 Spectral lags
There are a number of redshift indicators that can be used for GRBs without spectroscopic redshift measurements. One such indicator is the spectral lag which combines the spectral and temporal properties of the prompt GRB emission. The spectral lag is a measure of the time delay between GRB emission in a high-energy -ray band relative to the arrival of photons in a low-energy band. The typical lag values measured for long-duration GRBs detected by the Burst and Transient Source Experiment (BATSE) between the 25–50 keV and 100–300 keV channels concentrate at ms (Norris et al., 2000). An anti-correlation between spectral lag and isotropic peak luminosity was first observed by Norris et al. (2000), using 6 BATSE bursts with measured redshifts. However, there exist notable outliers, in particular the ultra-low luminosity bursts GRB 980425, GRB 031203 and GRB 060218, associated with the supernovae SN 1998bw, SN 2003lw and SN 2006aj, respectively.
In order to measure the lags of INTEGRAL GRBs, background-subtracted lightcurves were extracted in 25–50 keV and 50–300 keV energy bands. The lag, , between two energy channels was determined by computing the cross-correlation function (CCF) between the two lightcurves as a function of temporal lag as described by Band (1997) and Norris et al. (2000). Assuming the time profiles in both energy channels display sufficient similarity, the peak in the CCF then corresponds to the time lag of the GRB between the two energy channels in question.
The number distribution of spectral lags is given in Fig. 9 for the 30 long-duration GRBs with a measured lag between 25–50 keV and 50–300 keV. No statistically significant negative spectral lags are found. A long tail extending to s is observed in the lag distribution in Fig. 9 and a clear separation between short and long lag is drawn at s. Thus, long-lag bursts have s and those with s are referred to as short-lag GRBs. There are 12 long-lag GRBs in the INTEGRAL sample.

The logN-logP distribution is given in Fig. 10 for all IBIS GRBs and separately for the subset of 12 long-lag GRBs. The distribution is biased by the lower sensitivity of IBIS at large off-axis angles. However, the long-lag GRBs appear to form a separate population at low peak fluxes.

3.3 Spatial distribution in Supergalactic coordinates
The INTEGRAL exposure map and distribution of GRBs in supergalactic coordinates is shown in Fig. 11. All of the INTEGRAL GRBs are divided almost equally between the half of the sky above and below , in agreement with the exposure map which has % of the exposure time within of the supergalactic plane. However, 10 of the 12 long-lag GRBs are concentrated at supergalactic latitudes between . The quadrupole moment (Hartmann et al., 1996) has a value of for the long-lag GRBs and indicates an anisotropy in the distribution of these GRBs with respect to the supergalactic plane. This result leads us to conclude that long-lag GRBs may trace the features of the nearby large-scale structure of the Universe and is a further indication that most long-lag GRBs are nearby and have low luminosity.


A nearby population of long-lag, low-luminosity GRBs has previously been proposed based on the detections of GRB 980425 and XRF 060218 (e.g. Guetta et al., 2004). The distance to the long-lag GRBs can also be constrained by association and comparison with the two low luminosity bursts GRB 980425 () and XRF 060218 () which would have been detected in the fully-coded field of view of IBIS to 135 Mpc and 290 Mpc, respectively. The association of the long-lag GRBs with known low luminosity GRBs and with the supergalactic plane implies that they are at similar distances. It has also been pointed out that weak BATSE GRBs appear to be correlated with galaxies out to distances of 155 Mpc (Chapman et al., 2007).
GRBs have a long lag when a typical value of 0.1 s is redshifted by a large factor or alternatively it is an intrinsic property of a low-luminosity GRB such as GRB 980425 and XRF 060218. The rate of GRBs in IBIS has been modelled (e.g. Gorosabel et al., 2004) and is unlikely to be more than 1 or 2 GRBs in 5 years of observations. We evaluate the rate of such GRBs over the whole sky using the 8 long-lag INTEGRAL GRBs in the partially-coded field of view of IBIS at 50% coding (0.1 sr) over an exposure time of 4 years, adopting a distance of 250 Mpc and assuming that 2 of the 8 GRBs are at high redshift. We obtain , in which the major uncertainty is the distance. The rate of low-luminosity GRBs at the adopted distance of 250 Mpc exceeds the upper limit of of Type Ib/c SN producing GRBs, which was derived assuming that all low luminosity GRBs would produce a SN and be as radio bright as the SN GRBs (Soderberg et al., 2006). However, the low luminosity GRB 060605 has no associated SN to faint limits and is evidence for a quiet end for some massive stars (e.g. Fynbo et al., 2006).
The association of low luminosity GRBs with the supergalactic plane is not proof that they are associated with clusters of galaxies but indicates that clusters may play a role. It is interesting to note that the rate of Type Ia SNe is higher in elliptical galaxies in clusters than in field ellipticals by a factor of 3 (Mannucci et al., 2007). This effect is due to galaxy-galaxy interactions which can affect the evolution and properties of binary systems. In this case, there should also be an increase in the merger rate of white dwarfs or a white dwarf with a neutron star or black hole. A merger involving a white dwarf (e.g. King et al., 2007) should produce a long GRB that is likely to be fainter than the formation of a black hole in cosmological GRBs. There will be no supernova in the merger of a white dwarf with a neutron star or black hole, and probably a faint afterglow.
4 Conclusion
INTEGRAL is an Observatory type Gamma-ray mission with two main instruments optimized for high resolution -ray imaging and spectroscopy in the energy range from 15 keV up to 10 MeV.
The observatory, even if not fully optimized for GRB science (mainly due to on-board limited resources in term of TLM, buffering memory and computing power etc.) features a substantially large field of view of the main instruments ( squared degrees), real time photon by photon transmission to ground, and the IBAS system that distributes the position of the GRB very effectively, with an accuracy of the order of 1 to 3 arcmin a few seconds after the onset of the burst.
From its launch in October 2002 to date, INTEGRAL has detected and localised 65 GRBs. They have provided significant insight into the prompt ray emission in the hard-X/soft--ray energy range, i.e. where GRBs emit a large fraction of their energy. Furthermore, INTEGRAL provides unique sensitivity in the MeV range via the IBIS Compton mode, an energy region which was not sensitively covered by other operative satellites until the recent launches of AGILE and FERMI. Also, for the brightest bursts, both IBIS and SPI have independent, moderate, polarization capabilities.
Due to the limited FoV the overall rate of accurately positioned GRBs is limited to about 0.8 GRBs per month, with real time localisations enabling multi-wavelength observations to be carried out by other space-based missions and ground-based telescopes. On the other hand, when compared with SWIFT, a GRB oriented mission, INTEGRAL detects proportionally more faint GRBs due to its narrower FoV that limits the count rate due X-Ray Diffuse Background, which is the limiting factor to sensitivity in the lower operative energy range ( keV). The sensitivity of IBIS is such that it can detect very faint GRBs, allowing the investigation of the population of low-luminosity GRBs with long lags which appears to be a low-luminosity population distinct from the high-luminosity one and is inferred to be local. Finally, the all-sky rate of GRBs with a flux above 0.15 ph cm-2 s-1 is 1400 yr-1, based on the bursts detected in the IBIS fully coded field of view.
After almost 7 years of successful operation in orbit, the European Space Agency is in the process of extending INTEGRAL operations beyond 2012. INTEGRAL has all the redundant system still unused, all of the on board systems perfectly operative, including the two main instruments and monitors. The mission’s extension will enable us to collect several tens of new GRBs, in turn allowing us to confirm with higher statistical confidence the local nature of the long lag ones.
We believe it is mandatory to maintain INTEGRAL in operation as an important space observatory open to the community at large, operating in full synergy with XMM, CHANDRA, Suzaku, RXTE and SWIFT for the low energy part of the X-ray domain, and AGILE and FERMI for the -ray range.
The impressive space satellite fleet now available to the scientific community has resulted in the present golden age for high energy astrophysical science, while anticipating the the new generation of -ray flight missions such as EXIST, etc.
References
- Bird et al. (2009) A. Bird, et al., in preparation (2009).
- Winkler et al. (2003) C. Winkler, et al., A&A 411, L1 (2003).
- Ubertini et al. (2003) P. Ubertini, et al., A&A 411, L131 (2003).
- Vedrenne et al. (2003) G. Vedrenne, et al., A&A 411, L63 (2003).
- Lund et al. (2003) N. Lund, et al., A&A 411, L231 (2003).
- Mass-Hesse et al. (2003) M. Mass-Hesse, et al., A&A 411, L261 (2003).
- Skinner and Connell (2003) G. Skinner, and P. Connell, A&A 411, L123 (2003).
- Courvoisier et al. (2003) T. Courvoisier, et al., A&A 411, L49 (2003).
- Di Cocco et al. (2003) G. Di Cocco, et al., A&A 411, L189 (2003).
- Bazzano and Paizis (2002) A. Bazzano, and A. Paizis, GCN 1706 (2002).
- Malaguti et al. (2003) G. Malaguti, et al., A&A 411, L307 (2003).
- Hurley et al. (2002) K. Hurley, et al., GCN 1709 (2002).
- Mereghetti et al. (2001) S. Mereghetti, et al., Proc. of the 4th INTEGRAL Workshop ESA-SP 459, 513 (2001).
- Götz et al. (2003) D. Götz, et al., A&A 409, 831 (2003).
- Preece et al. (1998) R. D. Preece, et al., ApJ 506, L23 (1998).
- Ford et al. (1995) L. A. Ford, et al., ApJ 439, 307 (1995).
- Frontera et al. (2000) F. Frontera, et al., ApJS 127, 59 (2000).
- Marcinkowski et al. (2006) R. Marcinkowski, et al., A&A 452, 113 (2006).
- Hurley et al. (2003) K. Hurley, et al., GCN 2127, 1 (2003).
- Preece et al. (2000) R. D. Preece, et al., ApJS 126, 19 (2000).
- Katz et al. (1994) J. I. Katz, et al., ApJ 432, L107 (1994).
- Tavani et al. (1995) M. Tavani, et al., Ap&SS 231, 181 (1995).
- Medvedev et al. (2000) M. V. Medvedev, et al., ApJ 540, 704 (2000).
- Ghirlanda et al. (2003) G. Ghirlanda, et al., A&A 406, 879 (2003).
- Mallozzi et al. (1995) R. S. Mallozzi, et al., ApJ 454, 597 (1995).
- Amati et al. (2002) L. Amati, et al., A&A 390, 81 (2002).
- Ghirlanda et al. (2004) G. Ghirlanda, et al., ApJ 616, 331 (2004).
- Gotz et al. (2004) D. Gotz, et al., GCN 2640 (2004).
- Band et al. (1993) D. Band, et al., ApJ 413, 281 (1993).
- Campana and Moretti (2004) S. Campana, and A. Moretti, GCN 2649 (2004).
- Campana et al. (2004) S. Campana, et al., GCN 2656 (2004).
- D’Avanzo et al. (2006) P. D’Avanzo, et al., Nuovo Cimento B 121, 1467 (2006).
- Stratta et al. (2007) G. Stratta, et al., A&A 461, 485 (2007).
- Amati et al. (2008) L. Amati, et al., MNRAS 391, 577–584 (2008).
- Mereghetti et al. (2003) S. Mereghetti, et al., ApJ 590, L73 (2003).
- Paciesas et al. (1999) W. S. Paciesas, et al., ApJS 122, 465 (1999).
- Protassov et al. (2002) R. Protassov, et al., ApJ 571, 545 (2002).
- Piro et al. (1999a) L. Piro, et al., ApJ 514, 73 (1999a).
- Piro et al. (1999b) L. Piro, et al., A&AS 138, 431 (1999b).
- Antonelli et al. (2000) L. A. Antonelli, et al., ApJ 545, 39 (2000).
- Amati et al. (2000) L. Amati, et al., Science 290, 953 (2000).
- Piro et al. (2000) L. Piro, et al., Science 290, 955 (2000).
- Protassov et al. (2000) R. Protassov, et al., AAS 197, 1604 (2000).
- Yoshida et al. (2001) A. Yoshida, et al., ApJ 557, 27 (2001).
- Watson et al. (2003) R. Watson, et al., ApJ 595, 29 (2003).
- Castro-Tirado et al. (2003) A. J. Castro-Tirado, et al., A&A 411, L315 (2003).
- Harrison et al. (1999) F. Harrison, et al., ApJ 559, 123 (1999).
- in’t Zand et al. (2001) J. J. in’t Zand, et al., ApJ 559, 710 (2001).
- Corsi et al. (2005) A. Corsi, et al., A&A 438, 829 (2005).
- Sazonov et al. (2004) S. Y. Sazonov, A. A. Lutovinov, and R. A. Sunyaev, Nature 430, 646–648 (2004).
- Ghisellini et al. (2006) G. Ghisellini, G. Ghirlanda, S. Mereghetti, et al., MNRAS 372, 1699–1709 (2006).
- Toma et al. (2008) K. Toma, et al., ApJ, to appear in (arXiv:0812.2483) (2008).
- McGlynn et al. (2007) S. McGlynn, et al., A&A 466, 895 (2007).
- Goẗz et al. (2004) D. Goẗz, et al., GCN 2866 (2004).
- Barthelmy et al. (2004) S. Barthelmy, et al., GCN 2874 (2004).
- MacBreen et al. (2006) S. MacBreen, et al., A&A 455, 433 (2006).
- Fenimore et al. (2004) E. Fenimore, et al., GCN 2906 (2004).
- Levine et al. (2004a) A. M. Levine, et al., ApJL 469, L33 (2004a).
- Levine et al. (2004b) A. Levine, et al., GCN 2917, 1 (2004b).
- Kalemici et al. (2007) E. Kalemici, et al., ApJS 169, 75 (2007).
- Götz et al. (2009) D. Götz, et al., ApJ 695, 208 (2009).
- Lei et al. (1997) F. Lei, et al., Space Sci. Rev. 82, 309 (1997).
- Granot et al. (2003) J. Granot, et al., ApJ 596, L17 (2003).
- Granot and Königl (2003) J. Granot, and A. Königl, ApJ 594, L83 (2003).
- Nakar et al. (2003) E. Nakar, et al., J. Cosmol. Astropart. Phys. 10, 005 (2003).
- Lyutikov et al. (2003) M. Lyutikov, et al., ApJ 597, 998 (2003).
- Ghisellini et al. (1999) G. Ghisellini, et al., MNRAS 309, L7 (1999).
- Waxman et al. (2003) E. Waxman, et al., Nature 423, 388 (2003).
- Lazzati et al. (2004) D. Lazzati, et al., MNRAS 347, L1 (2004).
- Kouveliotou et al. (1993) C. Kouveliotou, C. A. Meegan, G. J. Fishman, et al., ApJL 413, L101–L104 (1993).
- Norris et al. (2000) J. P. Norris, G. F. Marani, and J. T. Bonnell, ApJ 534, 248–257 (2000).
- Band (1997) D. L. Band, ApJ 486, 928 (1997).
- Hartmann et al. (1996) D. H. Hartmann, M. S. Briggs, and K. Mannheim, “Searsch for Supergalactic Anisotropies in the 3B Catalog,” in American Institute of Physics Conference Series, 1996, vol. 384, p. 397.
- Guetta et al. (2004) D. Guetta, R. Perna, L. Stella, and M. Vietri, ApJL 615, L73–L76 (2004).
- Chapman et al. (2007) R. Chapman, N. R. Tanvir, R. S. Priddey, and A. J. Levan, MNRAS 382, L21–L25 (2007).
- Gorosabel et al. (2004) J. Gorosabel, N. Lund, S. Brandt, N. J. Westergaard, and J. M. Castro Cerón, A&A 427, 87–93 (2004).
- Soderberg et al. (2006) A. M. Soderberg, S. R. Kulkarni, E. Nakar, et al., Nature 442, 1014–1017 (2006).
- Fynbo et al. (2006) J. P. U. Fynbo, D. Watson, C. C. Thöne, et al., Nature 444, 1047–1049 (2006).
- Mannucci et al. (2007) F. Mannucci, D. Maoz, K. Sharon, et al., MNRAS p. 1132 (2007).
- King et al. (2007) A. King, E. Olsson, and M. B. Davies, MNRAS 374, L34–L36 (2007).