Plasticity-induced structural anisotropy of silica glass
Abstract
Amorphous silica density at ambient pressure is known to depend on thermal history (through the quenching rate) but also, at room temperature, on the maximum pressure applied in the past. Here we show that beyond density, a mechanical loading can endow the structure with an orientational order. Molecular dynamics simulations show evidence that amorphous silica develops a permanent anisotropic structure after extended shear plastic flow. This anisotropy which survives for an unstressed specimen is revealed markedly by the fabric tensor computed over the Si-O-Si orientations, albeit the SiO4 tetrahedra microstructure remains mostly unaltered.
pacs:
62.20.F, 81.05.KfPlasticity of amorphous media, which can be easily evidenced via indentation or scratch testsTaylor (1949), has a very different nature from its counterpart for crystalline media, since no elementary entities such as dislocations whose evolution controls plastic flow can be easily defined Spaepen (1977); Argon (1979). The current view is that spatially distributed local restructuring rather than extended defect motion (such as dislocation) are responsible for irreversible strains in amorphous materialsFalk and Langer (1998); Bulatov and Argon (1994). At a very local scale, under load, a small group of atoms (called a Transformation Zone or TZ) may undergo rearrangements, a change of conformation eventually affecting the topology of the atomic bonds which will contribute to an elementary increment in irreversible strain. Although a complete description of these TZ is extremely complex, and cannot be cast into simple categories, a statistical analysis capturing the key properties of these zones is an attractive route for relating the macroscopic mechanical behavior to the underlying microstructural counterpartFalk and Langer (1998).
In contrast with dislocations which naturally lead to isochoric plastic deformation, transformation zones may densify or dilate as they rearrange. Indeed at a macroscopic scale, plasticity of silicate glasses is known to exhibit permanent densification Cohen and Roy (1965); Ernsberger (1968) from a few percents for soda-lime glasses Ji et al. (2006) to values as large as 20% in the extreme case of amorphous silica Perriot et al. (2006); Vandembroucq et al. (2008). This densification naturally affects shear plasticity, and hence pressure and shear stress are to be coupled in the yield criterion of amorphous silica Kermouche et al. (2008).
Plasticity of structural glasses is furthermore characterized by a significant hardening behavior Perriot et al. (2006); Vandembroucq et al. (2008). The yield surface evolves with the mechanical loading. This means in particular that, when applying stress in a given direction (pure shear, pure hydrostatic pressure, etc) the value of the elastic limit depends on the history of the loading.
To account for this dependence on mechanical history a proper description of plasticity thus requires the use of additional internal variables. The first one is obviously density and indeed a recent study of densification with pressure allows one to characterize the density hardening of silica Vandembroucq et al. (2008). The necessity to include more internal variables than the mere density is a difficult question to address. Experimentally, plasticity of amorphous media calls for a high level of stress and confinement which can either be met in indentation-type test (with the complication of the very strong spatial heterogeneity of the stress state) or in anvil diamond cell where shear cannot be imposed. Thus it appears very difficult to follow a particular stress path which would allow one to answer this question. Hence, in the present study, we will resort to Molecular Dynamics simulations where homogeneous loadings with arbitrary stress path can be imposed.
As for granular media plasticity, shear reversal experiments show that a simple scalar internal variable is not sufficient to account for the mechanical behavior, and a tensor-valued internal variable, characterizing the geometry packing is needed Radjai and Roux (2004). For this purpose, a natural candidate is the so-called fabric tensor, , which captures the mean orientation of the contact normals, , through the spatial average of their dyadic product. This tensor characterizes an anisotropic texture of the medium. Experimental and numerical studies of granular mediaOda (1993); Rothenburg and Kruyt (2004), have shown that such was the case after shearing. Indeed, more contacts are oriented along the direction(s) of compression. Similarly, the same tools have recently been used to study the rheology of foamsGraner et al. (2008).
The fabric tensor can be characterized by its three eigenvalues, , for . The fact that is a unit vector implies that the trace of is equal to unity, or Thus, for an isotropic medium, the three eigenvalues are equal to 1/3. In case of anisotropy, degeneracy is lifted and different eigenvalues are measured. In order to give a quantitative scalar estimate of this anisotropy, the following scalar parameter, proportional to the norm of the deviatoric part of , is defined:
| (1) |
For an isotropic medium, , and the prefactor has been chosen such that in case of full anisotropy, we have . This quantitative parameter, which is built in the same spirit as an effective shear stress allows one to compare results obtained in different stress geometries. Pursuing our analogy, it is natural to consider a similar fabric tensor for amorphous silica. We will show that indeed, besides the usual (reversible) anisotropy induced by an elastic strain, plasticity induces a series of structural rearrangements which after unloading endow silica with a remnant anisotropic structure. The latter state can be regarded as a novel phase of amorphous silica.
In the case of silica, chemistry imposes that each silicon atom is encaged in a tetrahedron of four oxygen atoms forming a SiO4 elementary unit. These tetrahedra are bounded to each other through a common oxygen atom. They are extremely robust and remain virtually unaltered under mechanical loadings. However, pairs of tetrahedra have much more freedom in their relative orientations. Henceforth, it is natural to build the equivalent of a fabric tensor from the “contacts” between neighboring tetrahedra. Thus for all Si-O-Si triplets, we consider the unit vector which connects all next to nearest neighbors, NNN, (i.e. Si-Si atoms see Fig. 2a). The fabric tensor as defined above is built up by averaging over all NNN Si atoms. The fact that second neighbors are to be considered is a challenge to study this anisotropy experimentally using classical tools for structural analysis.
Amorphous silica was studied via Molecular Dynamics (MD) computer simulations. This technique allows us to impose an extended (simple) shear along one direction under constant volume, and reverse it. This particular stress path is able to reveal whether plasticity is accompanied by any structural change and in particular anisotropy. MD simulations are performed on amorphous silica (a-SiO2), using the empirical interatomic potential developed by Vashishta et al Vashishta et al. (1990, 1997); Kalia et al. (2003). This potential incorporates steric repulsion, charge transfer, and electronic polarizability of atoms through pair-wise interaction terms. Covalent effects in silica are included through bond-bending and bond-stretching three-body terms. The parameters of the potential have been adjusted by measurements of structural correlations, elastic moduli, and fracture toughnessVashishta et al. (1990); Rountree et al. (2002). The a-SiO2 samples were first prepared by melting (i.e. heating to 4000 K) 117,912 (cubic box of length 12.088 nm) atoms of ideal -cristobalite crystal. The sample was cooled to 2500 K at a rate of 1 K/t (where t is the time step) and allowed to relax for 60000 t (large specimen). The cooling process was repeated at 1500 K, 600 K, 300 K, and 5 K. Afterwards a conjugate gradient method is used to cool the sample to 0 K. The temperature is once again elevated to 300 K in order to conduct simulations at room temperature. Periodic boundary conditions have been invoked in all simulations.
Shear plasticity of this model silica glass has been studied on 12 independent samples. Each sample was sheared by applying an external shear in small increments such that the volume was conserved (NVT ensemble). Between each subsequent shear the sample was allowed to relax. Also during the simulations the temperature was held fixed at 300 K using a thermostat. Two different shear strain rates have been used, 10-4 ps-1 and 10-2 ps-1. It is to be stressed that these shear rates are considerably higher than the highest ones that may be considered experimentally. However lower shear rates cannot conceivably be imposed within the present framework of Molecular Dynamics. Therefore the effect of long time relaxation processes such as atom diffusion is out of reach of the present study.
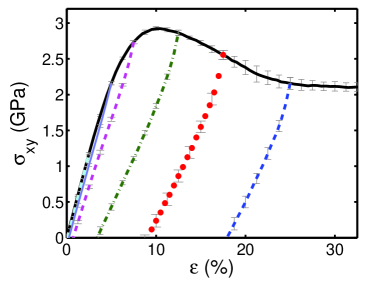
Figure 1 depicts a typical stress strain curve. The initial behavior corresponds to linear elasticity; for the faster strain rate here represented, a stress overshoot is visible before a plateau corresponding to the stationary plastic regime. As discussed in Rottler and Robbins (2003), the amplitude of this stress overshoot is dependent on the strain rate and almost disappears for the slower rate. In addition to this monotonic test, unloading to zero shear stress has been performed starting from different values of the maximum total strain: 2.5%, 5%, 7.5%, 12.5%, 17.5% and 25%. As can be seen on Fig. 1, beyond 5% strain (which corresponds to a shear stress of about 2.25 GPa), permanent plastic deformation sets in. During the simulations the pressure was monitored, and it was found to increase from during the elastic loading stage up to during plastic flow. Further details can be found in Rountree and et al (2009).
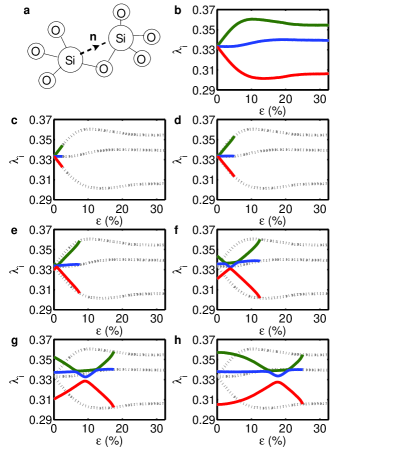
In Fig. 2 the evolution of the eigenvalues of the fabric tensor is shown along shear loading and unloading from various values of total strain. At rest, isotropy of the glass is almost perfectly obtained; the three eigenvalues are equal within a precision of . Shear loading then induces first an elastic strain which renders the medium anisotropic. The elastic shear strain naturally leads to the lifting of the degeneracy: the eigenvalues take different values with a growing shift. In the elastic regime, a change in fabric tensor can be shown to be proportional to the strain. Note that we recover here more or less the behavior of the shear stress: a linear regime related to elasticity followed by a bump and a stationary elasto-plastic regime. In this regime, the shear-induced anisotropy is marked and eigenvalues are clearly separated. In this plastic flow regime, where the elastic strain remains invariant, so does the fabric tensor. When unloading, the fabric tensor eigenvalues linearly return to their original value showing that the initial rise of anisotropy is perfectly reversible, and hence of elastic nature.
For and , isotropy is approximately obtained at zero deformation; the glass has recovered its original state. However, unloading from larger deformations , , and we observe that isotropy is never fully recovered. The beginning of the unloading stage shows a linear evolution somewhat comparable to the first elastic loading, consistent with the fact that the incremental strain during unloading is expected to be purely elastic.It is however noteworthy that a significant plastic strain occurs during this unloading phase showing a strong kinematic hardening, and a very severe shrinkage of the elastic domain. The permanent plastic shear deformation obtained at zero shear stress can be associated to the minimal gap between the eigenvalues of the fabric tensor but this gap is clearly growing well beyond the numerical uncertainty.
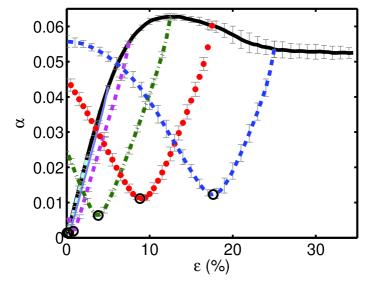
The same analysis can be performed in a more quantitative manner by following the evolution of the scalar anisotropy index under these shear loading and unloading tests and is presented in Fig. 3. The anisotropy index decreases under unloading, reaches a minimum value, , approximately when the shear stress is null. If the load is reversed to negative values, rises again to saturate at a similar level as for direct shear. For a maximum deformation , , we recover after unloading : no change is noticeable when compared with the original state. For larger deformations, however, a clear increase of is observed up to values close to , well above the numerical uncertainty.
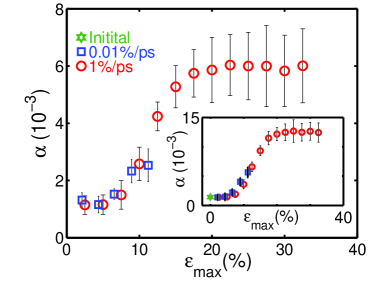
These results are summarized in Fig. 4 which shows the evolution of the minimum gap, , versus the maximum deformation, . The results obtained with a much slower strain rate , (one hundred times slower than the previous case) are also shown in the same figure. It is remarkable that both curves almost superimpose each other. Once silica has experienced shear plasticity, a significant anisotropy persists even after unloading. Note that an additional relaxation towards zero stress state (NPT ensemble) during 20 ps after unloading was performed. This ensures to eliminate normal stresses due to the shearing in plane deformation. As shown in the insert, the latter naturally induce an additional anisotropy of trivial elastic origin which has to be eliminated before attesting for the presence of the plasticity induced anisotropy discussed in the present study.
On the basis of molecular dynamics study of plasticity of amorphous silica under simple shear, a non-reversible anisotropy sets in and appears stable (at the time scale of MD). Detailed structure investigation could not reveal any significant deviation from the amorphous structure based on e.g. interatomic distances The eigenvectors of these Si-O-Si directions are aligned with the principal strain/stress directions. Because of the relatively short time scale naturally associated with MD simulations, an experimental validation of this observation is needed to validate our conclusions, in particular concerning the stability of this phase. Experimentally, anisotropy is expected to give rise to birefringence, a property which might be more easily accessible than structural analyses. Using standard photoelasticity parameters for silica and the maximum anisotropy obtained in the present work , a crude estimate of the birefringence gives an index contrast . Such a phenomenon may for instance be tested in the framework of rotational anvil cell experimentsMa et al. (2006a, b).
Acknowledgments We acknowledge D. Bonamy. R. Kalia, and L. Van Brutzel. CLR wishes to acknowledge the National Science Foundation Graduate Research Fellowship under grant no. 0401467 for financial support. DV, SR and MT acknowledge the financial support of ANR grant “Plastiglass” no. ANR-05-BLAN-0367-01.
References
- Taylor (1949) E. W. Taylor, Nature 163, 323 (1949).
- Spaepen (1977) F. Spaepen, Acta Metall. 25, 407 (1977).
- Argon (1979) A. S. Argon, Acta Metall. 27, 47 (1979).
- Falk and Langer (1998) M. L. Falk and J. S. Langer, Phys. Rev. E 57, 7192 (1998).
- Bulatov and Argon (1994) V. V. Bulatov and A. S. Argon, Modell. Simul. Mater. Sci. Eng. 2, 167 (1994).
- Cohen and Roy (1965) H. M. Cohen and R. Roy, Phys. Chem. Glasses. 6, 149 (1965).
- Ernsberger (1968) F. M. Ernsberger, J. Am. Ceram. Soc. 51, 545 (1968).
- Ji et al. (2006) H. Ji, V. Keryvin, T. Rouxel, and T. Hammouda, Scripta Mat. 55, 1159 (2006).
- Perriot et al. (2006) A. Perriot, V. Martinez, C. Martinet, B. Champagnon, D. Vandembroucq, and E. Barthel, J. Am. Ceram. Soc. 89, 596 (2006).
- Vandembroucq et al. (2008) D. Vandembroucq, T. Deschamps, C. Coussa, E. B. A. Perriot, B. Champagnon, and C. Martinet, J. Phys Cond. Mat. 20, 485221 (2008).
- Kermouche et al. (2008) G. Kermouche, E. Barthel, D. Vandembroucq, and P. Dubujet, Acta Mat. 56, 3222 (2008).
- Radjai and Roux (2004) F. Radjai and S. Roux, The Physics of Granular Media (Wiley, Berlin, 2004), chap. Contact dynamics study of 2D granular media: critical states and relevant internal variables, pp. 165–186.
- Oda (1993) M. Oda, Mech. Mater. 16, 35 (1993).
- Rothenburg and Kruyt (2004) L. Rothenburg and N. P. Kruyt, Int. J. Sol. Struct. 41, 5763 (2004).
- Graner et al. (2008) F. Graner, B. Dollet, C. Raufaste, and P. Marmottant, Eur. Phs. J. E 25, 349 (2008).
- Vashishta et al. (1990) P. Vashishta, R. K. Kalia, J. P. Rino, and I. Ebbsjo, Phys. Rev. B 41, 12197 (1990).
- Vashishta et al. (1997) P. Vashishta, R. K.Kalia, A. Nakano, W. Li, and I. Ebbsj , in Amorphous Insulators and Semiconductors (NATO Science Partnership Sub-Series: 3:), edited by M. Thorpe and M. Mitkova (Kluwer Academic, Netherlands, 1997), p. 151.
- Kalia et al. (2003) R. K. Kalia, A. Nakano, P. Vashishta, C. L. Rountree, L. V. Brutzel, and S. Ogata, Int. J. Fract. 121, 71 (2003).
- Rountree et al. (2002) C. L. Rountree, R. K. Kalia, E. Lidorikis, A. Nakano, L. V. Brutzel, and P. Vashishta, Ann. Rev. Mater. Res. 32, 377 (2002).
- Rottler and Robbins (2003) J. Rottler and M. O. Robbins, Phys. Rev. E 68, 011507 (2003).
- Rountree and et al (2009) C. L. Rountree and et al, unpublished (2009).
- Ma et al. (2006a) Y. Z. Ma, V. I. Levitas, and J. Hashemi, J. Phys. Chem. Sol. 67, 2083 (2006a).
- Ma et al. (2006b) Y. Z. Ma, V. I. Levitas, and J. Hashemi, J. Phys. Cond. Mat. 18, 1075 (2006b).