Present address: ]Nuclear Science Research Institute, Tokai Research and Development Center, Tokai-mura, Naka-gun, Ibaraki 319-1195, Japan Present address: ]Laboratory of Nuclear Science, Tohoku University, Sendai, Miyagi 982-0826, Japan. Present address: ]National Superconducting Cyclotron Laboratory, Michigan State University, East Lansing, Michigan 48824-1321, USA Present address: ] Cyclotron and Radioisotope Center, Tohoku University, Sendai, Miyagi 980-8578, Japan
Differential cross section and analyzing power of the reaction at a beam energy of 390 MeV
Abstract
The differential cross section and analyzing power of the reaction have been measured at RCNP in coplanar geometry at a beam energy of 390 MeV and the dependence on both the pion emission angle and the relative momentum of the final protons have been extracted. The angular variation of for the large values of the relative momentum studied here shows that this is primarily an effect of the interference of pion - and -waves and this interference can also explain the momentum dependence. Within the framework of a very simple model, these results would suggest that the pion-production operator has a significant long-range component.
pacs:
24.70.+s, 13.75.Cs, 13.60.LeI Introduction
Pion production is the first and probably the simplest of the inelastic processes in nucleon-nucleon collisions and its understanding may provide us with valuable information about low and medium energy strong interaction physics. Motivated by this, over the last decade there has been a series of detailed studies of the reaction from near the production threshold up to a proton beam energy of 425 MeV. These have been carried out at several laboratories, viz. IUCF pi0_iucf ; pi0_iucf_new , TSL pi0_tsl ; pi0_tsl_ang ; Pia , and COSY-TOF TOF1 ; TOF2 .
Initial theoretical calculations Miller for -production estimated a total cross section that was five times smaller than experiment pi0_iucf . This indicated clearly that some essential mechanism was missing from the theory of -wave pion production leading to the -state of the final protons. Lee and Riska Lee suggested that this might be connected with short-range effects between nucleons, and quantitative support for this was found in a model with the exchange of a heavy meson coupled to the antinucleon-nucleon pair Horowitz . On the other hand it has been claimed that -wave pion rescattering is not small Oset ; Juelich and that one can reproduce the cross section data without invoking short-range effects Oset . Studies based on Chiral Perturbation Theory (PT) Park ; Cohen ; Kolck ; Sato show that the contribution of pion rescattering is indeed sizable, but that the sign of this term is opposite to that of Ref. Oset ; Juelich , and this leads to an even more severe discrepancy between theory and experiment. The convergence of the chiral expansion can be seriously questioned for -wave pion production because of the large momentum transfer between nucleons, whereas the expansion seems to show convergence in the case of -wave pion HanhartCHIPT . An ordering scheme has since been discussed HanhartKaiser . Thus the origin of -wave pion production is still not clear even as to whether the production mechanism is or is not dominated by short-range effects.
Differential cross sections and polarization observables have been measured at several bombarding energies pi0_iucf_new ; pi0_tsl_ang ; TOF2 ; Pia and theoretical estimates of these observable have been made by groups at Jülich Juelich2 and Osaka tamura . Both approaches include higher partial-waves and provide good fits to the total cross section close to threshold. However the differential and polarization observables are not well reproduced by either group. In order to try to identify the origin of the problem more clearly it may be useful to attempt a partial-wave decomposition. In Ref. pi0_iucf_new , the angular dependences of the different polarization observables were developed using a general formalism consisting of a complete set of functions, with coefficients extracted by fitting data, and this has been extended in later work Deepak . However, due to the limited accuracy of polarization data existing at the time, the analysis was done by assuming that only a small number of partial-wave contributed and that the momentum dependence of these amplitude stemmed purely from the centrifugal barrier. This latter assumption is very doubtful since, for the -state of final protons, it does not lead to a good description of the differential cross section pi0_tsl_ang . More precise data on the angular and momentum dependence of the polarization observables, as well as of the differential cross section, are highly desirable. The accumulation of such data may allow one to perform a fuller partial-wave analysis of the reaction, which would provide greater insight for the theoretical models.
We report here a measurement of the reaction at a beam energy of 390 MeV, where the beam polarization is perpendicular to the plane containing the detectors. The differential cross section and analyzing power, , are obtained as functions of the pion emission angle, , in the center-of-mass system and the relative momentum, , of the final protons. The use of a high intensity polarized beam in conjunction with a liquid hydrogen target makes it possible to extract the angular dependence of for different ranges in . Such data, which have not been available previously, might offer serious constraints on theoretical models.
If only a few partial-waves are important, the angular dependence of the spin-averaged cross section is composed of terms proportional to and . The strength of the term is governed by the interference of amplitudes corresponding to the production of and final states. Here, using the standard notation, the final states are labeled by , where and are the angular momenta of the proton pair and the pion, respectively. On the other hand, the strength is determined by - and higher states.
The variation with the momentum , obtained after integration over angles, is sensitive to the and production amplitudes. This is studied in a model where it is assumed that the momentum dependence of the proton-proton wave functions in the final state is the main influence for the -state amplitudes. Furthermore, in a very simplistic approach, the wave functions are evaluated at a fixed proton-proton separation distance.
The experimental facility, and in particular the detectors, polarized beam, and target, are described in Sec. II. Section III is devoted to the steps needed to identify and measure the reaction. The extraction of the observables from data taken under our specific kinematic conditions, where the detection system is essentially coplanar, is the subject of Sec. IV, with the experimental results being shown in Sec. V. The general features of the angular and momentum dependence of the cross section and analyzing powers are given in Sec. VI. It is shown there that, when comparing our results with published data which have large acceptance, it is crucial to take account of our particular coplanar geometry. Section VII presents the simple phenomenological description of pion production. Our conclusions are given in Sec. VIII.
II Experiment
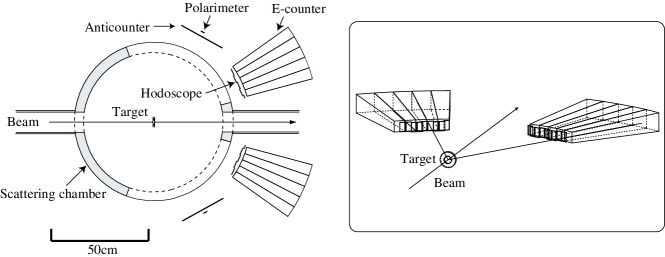
The experiment was carried out using a 390 MeV polarized proton beam extracted from the cyclotron complex at the Research Center for Nuclear Physics (RCNP), Osaka. The polarized beam was produced by an atomic-beam-type polarized ion source with an Electron Cyclotron Resonance (ECR) ionizer ECR , where the polarization state (‘up’ or ‘down’) of the primary beam was reversed with a frequency of 1 Hz. The protons were first accelerated in the injector AVF cyclotron before being further accelerated up to 390 MeV in the main cyclotron ring. After extraction, the vertically polarized beam was transported to the scattering chamber in the experimental hall. Figure 1 shows the top view of the scattering chamber as well as of our detection system. The scattering chamber containing a liquid hydrogen target consisted of an evacuated vertical cylinder. The window made of a aramid foil had a horizontal opening angle from 15∘ to 110∘ on either side of the the beam direction. After the target the primary beam was transported to the beam dump where a Faraday cup monitored the beam intensity for the two polarization states. The beam current was limited to around 1 nA in order to minimize the dead-time of the data acquisition system. Under these conditions the system, the details of which are described in Ref. DAQ , had an efficiency of between 75% and 87%.
II.1 Detector
The detector system was symmetric with respect to the plane containing the beam axis and the direction of the beam polarization. The two outgoing protons from the reaction were detected simultaneously in an array of plastic scintillators. The measurement of two pairs of polar and azimuthal angles and two kinetic energies is sufficient to identify the reaction and determine the five independent kinematic variables. The system covered laboratory polar angles . The maximum angle of protons from the reaction at 390 MeV () is well inside the angular acceptance. The minimum angle was limited for both protons such that only proton pairs with relative momenta from 150 MeV/ up to the kinematic limit of 220 MeV/ could be registered with this system. The detector was therefore well suited for the investigation of the high relative momentum region, where the pion-production amplitudes leading to -state proton pairs should have their maximum strength. However, it is important to note that the c.m. polar angle of the relative momentum vector for final protons was confined to with respect to the beam axis.
The energy of a scattered proton was deduced from the amplitude signal in one of the -counters. Such a counter consists of a set of five plastic scintillators in which each element has a trapezoidal shape, with front and back faces of area and respectively. The 350 mm length is sufficient to stop protons with energies up to 250 MeV so that all protons from the reaction at 390 MeV were stopped. The front face of each counter was positioned at 500 mm from the target. The scintillator hodoscopes in front of the counters were used to determine the directions of outgoing particles; a single 3 mm thick element of area covered 17 mrad horizontally and 30 mrad vertically. Two elements were placed in front of each of four -counters with a 1 mm overlap, though only one element was used for the counter at the largest angle. There was thus a total of nine elements on each side of the beam. The angle of the detected particle was defined by the center of each element.
The anticoincidence counter ( marked ‘Anticounter’ in Fig. 1) was used to eliminate accidental events coming from elastic proton-proton scattering. This covered the angular range , where recoil protons from the elastic scattering hit the counter in combination with the scintillator hodoscopes. The information from the counter was used in the offline analysis and about 90% of the accidentals could be suppressed in this way.
One hodoscope element and a scintillation counter placed at 601∘ (denoted as the ‘Polarimeter’ in Fig. 1) were used to monitor the beam polarization. The fast and recoil protons from elastic proton-proton scattering were detected in coincidence. According to the SAID database said , the analyzing power at this energy and angle is , where the error bar has been obtained by looking at typical data in this region. The average values of the beam polarizations deduced on this basis were and , where the arrows indicate the spin states of proton beam and the errors are statistical. The polarizations were quite stable during the experiment and all values lay within about of the averages.
II.2 Target
The liquid hydrogen (LH2) target was 8.5 mm thick, with windows made of 25m thick aramid foil target . Its temperature was controlled in the range of 14 K to 20 K and kept stable at K during experimental runs. The empty target runs, which were carried out with hydrogen gas at temperatures between 22 K and 27 K, were used to estimate the background from other construction materials as well as from the residual gas frozen on the windows.
II.3 Data taking
A signal was registered when a charged particle hit both of the scintillator hodoscopes and the corresponding -counter. For the measurement of the reaction, the trigger conditions were set so that both right- and left-side counters were required to give signals in coincidence. In addition, measurements without the coincidence requirement were also performed in order to detect single protons from elastic proton-proton scattering. Such measurements were also performed using an unpolarized proton beam in order to check the determination of the luminosity as well as of the beam polarization. These are the subject of the following section.
III Data analysis
III.1 Particle identification
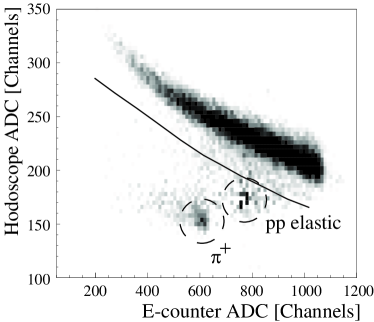
Particle identification was achieved by the - method. The amplitude signal, related to the energy loss in the scintillator hodoscope, is plotted in Fig. 2 against the amplitude signal from the -counter. The heavily populated band arises from protons, associated mostly with production, that stopped inside the counter. The events of interest are well separated from the two lower islands. These are produced by elastically scattered protons, which have energies above 265 MeV and thus do not stop inside the counter, and positive pions generated through the reaction.
III.2 Energy calibration of the -counter
At a beam energy of 390 MeV, the energies of the detected protons from the reaction varied between 40 MeV and 226 MeV. The energy dependence of the amplitude signal from the -counter could be calibrated above 100 MeV using elastic proton-proton scattering events. The hodoscope and -counter were set to cover the angular range and, for an angle fixed by the hodoscope, the monoenergetic recoil proton was measured by an -counter element. The energy resolution was found to be better than 2% (FWHM) for a proton energy of 200 MeV.
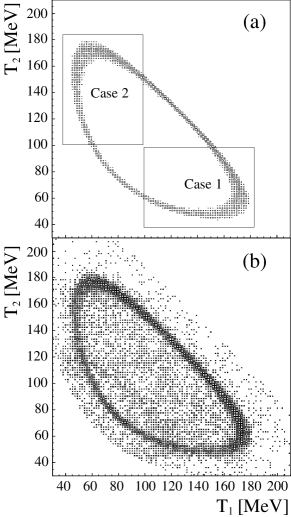
Below 100 MeV, information from the reaction itself was used. Figures 3a and 3b show, respectively, the simulated and measured energy correlation between protons that hit a pair of hodoscope elements to the right and left of the beam. The locus of event can be clearly seen and this was used to extract a data sample where the energy in the left (right) counter was higher than 100 MeV, while that in the right (left) was lower, as indicated by Case 1(2) in Fig. 3a. In addition a pedestal value from the ADC module was also used at an energy of 17 MeV, corresponding to the minimum energy of protons detected in the -counter. In this way, the amplitude signals for all combinations of right and left-side counters were calibrated using third-order polynomials with an accuracy of better than 4%, as judged from the position and width of the resulting missing-mass peak.
III.3 Identification of the reaction
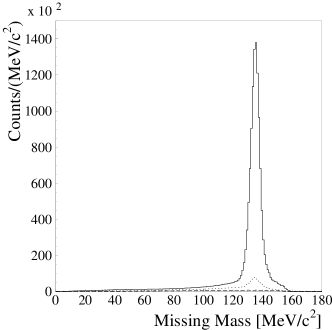
Having measured the energies and angles of the two protons, good events were selected on the basis of the missing-mass spectrum. A clear peak, with a width of 7.4 MeV/ (FWHM), is seen in Fig. 4, which shows the totality of events obtained with the LH2 target. The background from the target foil was subtracted by utilizing the empty target runs normalized to the integrated beam intensity. The contribution from the random coincidences was estimated by considering outgoing protons from different beam bunches. The correspondence of the peak position with the mass of the is consistent with the energy calibration of the counters.
For all candidates, the pion emission angle and the relative momentum and its angle in the overall center-of-mass system, were reconstructed on an event-by-event basis. The data were then grouped in nine intervals in and three in , with a finer binning in being used to study the momentum dependence of the analyzing power.
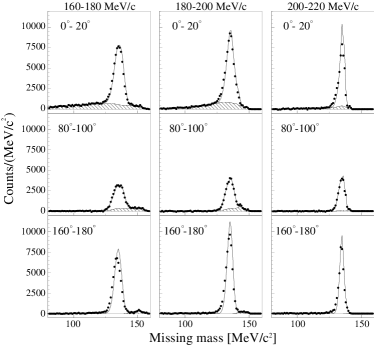
Missing-mass spectra were constructed for each combination of bins and spin states and used to extract the yield of events. The backgrounds from random coincidences and target foils were subtracted before showing the data in Fig. 5 for typical conditions. There is some residual background for , whose shape varies with the kinematic conditions. This arises from ‘non-full’ events where, in contrast to ‘full’ events, recoil protons from production do not deposit their full energy in the -counter due to a nuclear reaction in the scintillator material.
The shapes of the distributions for non-full and full events were simulated in a Monte Carlo program based on GEANT3 GEANT , which took into account the energy resolution of the scintillator material, as well as hadronic and electromagnetic interactions. The simulated events were passed through the same analysis chain as the measured data and fitted to the results shown in Fig. 5. The normalization of the non-full events was determined from the tails of the distributions. In order to check the systematic uncertainty in the treatment of the non-full background, the -yield was also determined by selecting all events around the pion peak without any subtraction and the corresponding uncertainty is discussed in Sec. V.
III.4 Detection efficiency of -counters for ‘full’ events
The detection efficiency for full events, where protons deposit their full energy inside an -counter, was estimated using the data obtained for the energy calibration of the -counters discussed in Sec. III.2. The efficiency varies between 0.85 and 0.65 over the measured energy range of 100 MeV to 200 MeV. The efficiency obtained by the Monte-Carlo simulation was checked by comparing it with that obtained from the measurement. Both results are in agreement to within 15% and this is included in the overall uncertainty quoted for the cross section.
III.5 Luminosity
The absolute value of the luminosity was determined from measurements of the beam intensity and the density of the LH2 target and this gave an integrated luminosity of . The value was verified by measuring elastic proton-proton scattering by identifying single protons through the - method. The unpolarized differential cross sections obtained in this way are shown separately in Fig. 6 for the same angular interval to the left and right of the beam direction. The results agree on average to within with the predictions of the SAID program said . However, there are fluctuations of up to around the predicted curves and these deviations were included in the determination of the acceptance as corrections associated with the geometrical uncertainties of individual hodoscope elements.
III.6 Beam polarization
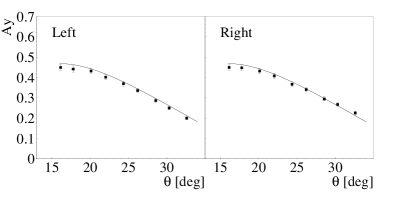
The beam polarizations were also checked by measuring elastic proton-proton scattering where the selection criteria for a single proton is the same as that discussed previously. The analyzing powers obtained in the offline analysis on the basis of the already determined beam polarizations are shown in Fig. 7 for the same laboratory angular range to the left and right of the beam direction. The results are consistent with those given by the SAID program said and the systematic uncertainty in the determination of the beam polarizations, including that coming from the SAID database, was found to be below 6%.

IV Observables
IV.1 Definition
Five independent variables are required to describe the three-body final state and these we take from the relative momentum of the two final protons and that of the pion in the overall c.m. system. Since the magnitudes of these momenta are linked by energy conservation, the resulting set of variables consists of the magnitude of plus two polar angles with respect to the beam axis and two azimuthal angles , i.e. {}. The corresponding differential cross section will be denoted
| (1) |
In terms of the Cartesian observables, the dependence of the cross section on the vertical polarization is given by
| (2) |
where is the spin-averaged cross section.
Our goal is to obtain the spin-averaged cross section and analyzing power at the polar angle of in coplanar geometry, i.e. . These observables are obtained from the experimental data through
| (3) | |||||
| (4) |
where is the spin-dependent yield, the beam polarization, and the luminosity. The detection efficiency includes that of the data acquisition system and the acceptance of the detector system, as determined by the Monte-Carlo simulation using the phase-space model. The average value of the cosine of the pion angle, , is also determined through the Monte-Carlo simulation, as discussed in Sec. V.
IV.2 Angular dependence
For the later discussion it is convenient here to describe the angular dependence expected for the unpolarized cross section and analyzing power of the reaction. These, as well as other observables, have been discussed in terms of partial-wave amplitudes in Ref. pi0_iucf_new , where total orbital angular momentum excitations up to were considered. Taking and , the relevant formulae reduce to
where each of the coefficients is a function of the relative momentum . The coefficients , , and represent the absolute-squares of amplitudes leading to , , and states, respectively, whereas those with , , and reflect the interferences of type , , and respectively pi0_iucf_new .
V Results
| (deg) | (MeV/) | (nb sr-2 (MeV/)-1) | ||||
|---|---|---|---|---|---|---|
The measured values of the spin-averaged cross section and the analyzing power are shown in Table 1 as functions of the pion polar angle for three ranges in the relative momentum . The mean values and uncertainties in the determination of have been estimated from the Monte Carlo simulations, where possible fluctuations in the beam energy and geometrical uncertainties in the detector system were taken into account.
The combinations of up-down beam polarizations and left-right detectors provide two measurements of as well as of the spin-averaged cross section and these should be consistent. However, due to the uncertainty of the energy calibration of the -counters on the two sides, the data show systematic differences between these combinations. The deviations from the mean value were included in the systematic error for an individual angular bin. Compared with this, the uncertainty due to the treatment of the non-full events as discussed in Sec. III.3 is negligible for , though it is the dominant systematic error for the spin-averaged cross section.
The size of the angular bin is quite large () and so the analysis was repeated using the smaller angular interval () in order to estimate the resulting uncertainty. The results for the spin-averaged cross section agree to within 5%, whereas the analyzing power results are in agreement to within the statistical errors. The overall systematic uncertainty for the spin-averaged cross section was estimated to be less than 16% when the uncertainties from the efficiency of full events and the angular bin were taken into account. As mentioned in Sec. III.6, the overall systematic uncertainty in coming from the determination of the beam polarization is believed to be less than 6%.
It is important to note that, due to the finite size of our counters, the data were not taken strictly at azimuthal angles and the effects of this angular spread increase when approaches and gets close to its maximum allowed value. In Table 1 we show estimates of the average values of and evaluated using our simulation. It is seen from Eq. (LABEL:eq:ay_rcnp) that the product is proportional to but is independent of and so the estimates of have been used in Eq. (4) to deduce . There is an explicit in Eq. (LABEL:eq:sigma_rcnp), which means that the value of that we have measured is different from that at . As a consequence, when dividing by to derive the analyzing power , some dependence still remains.
To quantify the changes caused by the variation, we define a correction factor using Eq. (LABEL:eq:sigma_rcnp),
| (7) |
The given in our Table 1 were obtained for our kinematic conditions by interpolating the coefficients quoted in Table IV of the IUCF work pi0_iucf_new . It must be noted that the value of appearing in Eq. (LABEL:eq:sigma_rcnp) could not be determined in the IUCF work and the value is assumed to be zero in the analysis. The calculations show that the cross section increases as moves away from and hence that the analyzing power decreases.
The spin-averaged cross sections and analyzing powers found by integrating over the polar angles are shown as functions of the relative momentum in Table 2. The mean values and uncertainties in the determination of have been estimated in the same way as for the pion polar angle in Table 1. The spin-averaged cross sections and analyzing powers have been obtained at average values of which depend upon and they must be subjected to a correction factor , similar to that given in Table 1, in order to extrapolate the results to .
| (MeV/) | (nb (rad sr MeV/)-1) | ||
|---|---|---|---|
VI Discussion
VI.1 Angular dependence
The variation of the spin-averaged cross section with pion angle is shown in Fig. 8 for the three momentum ranges. Since, for this purpose, the two initial protons are identical, the data are presented as functions of . The variation seems to be linear, as expected on the basis of Eq. (LABEL:eq:sigma_rcnp) and the data were therefore fit with the form
| (8) |
The resulting parameters with and without the factor are given in Table 3. In all cases the /d.o.f. were close to unity. The results, with and without the modification, are both consistent with being constant.

The angular distribution of the pion has been investigated by several experimental groups in the 400 MeV region, though with somewhat conflicting conclusions regarding the slope parameter . Thus was found at IUCF pi0_iucf_new , at TSL (PROMICE-WASA) pi0_tsl_ang , at TSL (WASA) Pia , and at COSY-TOF TOF2 . In the last of these experiments, a dependence of the parameter upon the relative momentum could be established, with changing from negative to positive as increases. However, even the TOF result of obtained for MeV/ is significantly smaller than ours for a similar momentum range. This difference can be explained in terms of the different geometries of the two experiments.
| (MeV/) | (nb/(sr2 MeV/)) | (nb/(sr2 MeV/)) | ||
|---|---|---|---|---|
| ( | () | |||
| ( | () | |||
| ( | () |
Whereas at COSY-TOF the full phase space was explored, our data were taken in essentially coplanar conditions, i.e. , and with the proton polar angle of . Using Eq. (LABEL:eq:sigma_rcnp) with the coefficients taken from Table IV of the IUCF work pi0_iucf_new , one can derive a relation between the slope parameter () for full acceptance and the value () to be found with our limited coverage. Since is negative pi0_iucf_new , is always larger than and for MeV/ one expects that . Using this relation with the COSY-TOF value of , a value of is predicted and this is consistent with our results.
The sign of the slope parameter is positive for high , reflecting the importance there of the contribution. On the other hand, both the TSL pi0_tsl_ang and COSY-TOF TOF2 data show that is negative for MeV/, probably due to a interference that falls very fast with increasing .
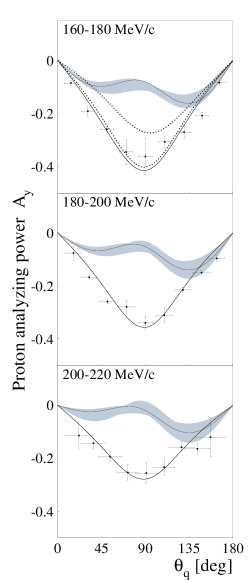
Figure 9 presents the dependence of on the pion polar angle for the three relative-momentum regions. The solid line shows the fits resulting from using the general angular dependence of Eq. (LABEL:eq:ay_rcnp), viz.
| (9) |
where the values of the free parameters and are listed in Table 3. In the fitting, the uncertainty in the angular determination has been included in the minimization.
It is seen from Table 3 that is consistent with zero for all three momentum bins. Since the parameters and correspond, respectively, to the and (, ) contributions in Eq. (LABEL:eq:ay_rcnp), this shows clearly that, for the large values of investigated in our experiment, the interference terms dominate.
If the values of all the coefficients given in Table IV of Ref. pi0_iucf_new are inserted into Eqs. (LABEL:eq:sigma_rcnp) and (LABEL:eq:ay_rcnp), these predict the angular dependence shown in Fig. 9a. The upper and lower dotted lines are obtained by using the numbers corresponding to 375 and 400 MeV, respectively. It must be noted that the IUCF parameters were obtained from averages of over the full range of allowed proton-proton relative momenta pi0_iucf_new . The close agreement found in the 160-180 MeV/ bin when using the 400 MeV coefficients is due, in part, to the cross section being maximal in this region.
In contrast, the model calculations of the Osaka group tamura , shown in Fig. 9, demonstrate a much more asymmetrical behavior than the experimental data and greatly underestimate the magnitude of the analyzing power. The predictions for the or transitions are therefore much smaller than those found experimentally. More theoretical studies are needed in order to elucidate the origin of this disagreement.
VI.2 Momentum dependence

Figures 10a and 10b show, respectively, the spin-averaged cross section and analyzing power integrated over as functions of the relative momentum of the final protons. The error bars include both systematic and statistical uncertainties. On kinematic grounds, must tend to zero as approaches the highest allowed values because the pion momentum vanishes in this limit. As previously remarked, the cross section seems to be maximal at our lowest values of , as does the magnitude of the analyzing power.
VII Phenomenological analysis
It was already stressed that the combination is not sensitive to the term in Eq. (LABEL:eq:sigma_rcnp) and so does not suffer from the resultant ambiguity. Since the integral of the term in Eq. (9) over the pion angle vanishes, the dependence of the integrated can be expressed in terms of the interference between the two types of -state amplitudes multiplied by the three-body phase-space factor ;
| (10) |
The corresponds to a linear combination of the coefficients in Eq. (LABEL:eq:ay_rcnp). According to Ref. pi0_iucf_new , , which does not contain any dependence, contributes about 95% of the total magnitude of so that to a good approximation the may be neglected. In this case, results from - interferences with the same -states of the final protons. It can therefore be expressed as
| (11) |
where are parameters and and represent the pion - and -wave amplitudes, respectively.
A partial-wave amplitude for pion production may be approximated in terms of the overlap integral involving the pion-production operators and the radial wave function of initial , and final protons and the pion plane wave ,
| (12) |
where is the proton-proton separation distance, and and is the pion angular momentum and momentum, respectively. Analytic forms for the -wave pion-production amplitude may be found in Ref. Horowitz .
If the pion-production operator is taken to be momentum-independent, any strong momentum dependence of the partial-wave amplitude must be ascribed to the variation of the radial wave function of the final protons and pion with and . To investigate this further, we approximate Eq. (12) by evaluating the product of the wave functions at a fixed distance , in which case
| (13) |

The radial wave functions have been derived from the Paris potential with the Coulomb interaction Paris . Since the experimental data cannot distinguish between the contributions from the and states, the calculations have been carried out taking them into account one at a time. However, there is very little difference between the two sets of results and only those for the states are shown in Fig. 11. The overall normalization factor has been fixed on the basis of Eq. (LABEL:eq:ay_rcnp) to satisfy , where the value b has been obtained by interpolation of the IUCF data pi0_iucf_new .
The data are only sensitive to a value of the distance . As demonstrated in Fig. 11, the curves obtained from Eq. (13) using radii , , and fm show significantly different dependences on the relative momentum. The fm line fails to reproduce the data but, as is increased, the minimum in the curve moves towards lower momenta and the data are better described. Within the framework of this simplistic analysis, the data seem to require a pion-production operator with a fairly long range component. It was noted for the TSL measurements of the differential cross section pi0_tsl_ang that the momentum dependence could be described by taking the exchanged particle in Eq. (12) to have the mass of the pion but that such a description was no longer possible when the -meson mass was used.
VIII Summary
We have measured the angular and momentum dependence of the cross section and analyzing power of the reaction at an incident energy of 390 MeV. Recoil protons stopped in a scintillation counter have been identified by the - technique. Though the counters in the horizontal plane covered angles between to to the left and right of the beam, the vertical acceptance was quite small and this feature is crucial in any theoretical description of the data. Only high relative momentum MeV/ were registered and, under these conditions, final -state proton pairs play an important role.
Although the dependence of the cross section on the pion angle shows a larger anisotropy than in the case of data obtained with almost full acceptance pi0_iucf_new ; pi0_tsl_ang ; TOF2 , this is in large part the result of our coplanar geometry. After taking this into account by using the IUCF parameters pi0_iucf_new , our results do not contradict those recently published by COSY-TOF TOF2 .
The shape of follows quite closely a form, which is consistent with this observable being dominated by interference. The contribution from the term is negligible at the high relative momentum studied in this experiment. However, the behavior of at small could be a useful probe to investigate the role of the contribution ANKEPRO .
The momentum dependence of the analyzing power at large is also consistent with the interference interpretation. The variation can be explained within a very simple model by taking the pion-production operator to have a rather long range.
Our results, taken in conjunction with the IUCF double-polarized data pi0_iucf_new and other published results on the unpolarized cross sections, may provide the extra information necessary for the understanding of the production mechanisms for -state protons. However, to succeed in this, a much more sophisticated theoretical model is required to replace the rather qualitative approach used here to describe the data.
Acknowledgements
The authors are grateful to the cyclotron staff for their support throughout this experiment. We acknowledge the help of K. Sagara with the liquid hydrogen target system. Comments from Professor A. Johansson have been particularly valuable. This work was performed at RCNP under the program E140.
References
- (1) H. O. Meyer et al., Phys. Rev. Lett. 65, 2846 (1990); Nucl. Phys. A 539, 633 (1992).
- (2) H. O. Meyer et al., Phys. Rev. C 63, 064002 (2001).
- (3) A. Bondar et al., Phys. Lett. B356, 8 (1995).
- (4) R. Bilger et al., Nucl. Phys. A 693, 633 (2001).
- (5) P. Thörngren Engblom et al., Phys. Rev. C 76, 011602(R) (2007).
- (6) S. Abd El-Samad et al., Eur. Phys. J. A 17, 595 (2003).
- (7) S. Abd El-Samad et al., Eur. Phys. J. A 30, 443 (2006).
- (8) G. A. Miller and P. U. Sauer, Phys. Rev. C 44, R1725 (1991).
- (9) T.-S. H. Lee and D. O. Riska, Phys. Rev. Lett. 70, 2237 (1993).
- (10) C. J. Horowitz, H. O. Meyer, and D. K. Griegel, Phys. Rev. C 49, 1337 (1994).
- (11) E. Hernandez and E. Oset, Phys. Lett. B 350, 158 (1995).
- (12) C. Hanhart, J. Haidenbauer, O. Krehl, and J. Speth, Phys. Lett. B444, 25 (1998).
- (13) B.-Y. Park, F. Myhrer, J. R. Morones, T. Meissner, and K. Kubodera, Phys. Rev. C 53, 1519 (1996).
- (14) T. D. Cohen, J. L. Friar, G. A. Miller, and U. vanKolck, Phys. Rev. C 53, 2661 (1996).
- (15) U. vanKolck, G. A. Miller, and D. O. Riska, Phys. Lett. B 388, 679 (1996).
- (16) T. Sato, T.-S. H. Lee, F. Myhrer, and K. Kubodera, Phys. Rev. C 56, 1246 (1997).
- (17) C. Hanhart, U. vanKolck, and G. A. Miller, Phys. Rev. Lett. 85, 2905 (2000).
- (18) C. Hanhart and N. Kaiser, Phys. Rev. C 66, 054005 (2002).
- (19) C. Hanhart, J. Haidenbauer, O. Krehl and J. Speth, Phys. Lett. B444, 25 (1998); Phys. Rev. C 61, 064008 (2000).
- (20) K. Tamura, Y. Maeda, and N. Matsuoka, Nucl. Phys. A 663-664, 457c (2000); Y. Maeda, N. Matsuoka, and K. Tamura, Nucl. Phys. A 684, 392c (2001).
- (21) P. N. Deepak, J. Haidenbauer, and C. Hanhart, Phys. Rev. C 72, 024004 (2005).
- (22) K. Hatanaka et al., Nucl. Instrum. Meth. Phys. Res. A 384, 575 (1997).
- (23) Y. Sugaya and M. Nomachi, Nucl. Instrum. Meth. Phys. Res. A 437, 68 (1999).
- (24) R. A. Arndt, I. I. Strakovsky, and R. L. Workman, Phys. Rev. C 50, 2731 (1994).
- (25) K. Sagara et al., RCNP Annual Report (1995) p. 158.
- (26) F. G. de Bilio, GEANT3 manual, CERN Program Library Long Writeup W5013 (October 1994).
- (27) M. Lacombe, et al., Phys. Rev. C 21, 861 (1980).
- (28) A. Kulikov et al. COSY Proposal 158, 2006, http://www.fz-juelich.de/ikp/anke/en/proposals.shtml.