Comment on “Vortex Glass and Lattice Melting Transitions in a YNi2B2C Single Crystal”
In a recent Letter [1], Mun et al. claim to observe vortex glass and lattice melting transitions in superconducting YNi2B2C. A key observation, which they associate with vortex lattice melting, is the presence of a sharp transition in the dc resistivity in finite dc magnetic field. Mun et al. arrive at an phase diagram with a single phase boundary which separates the vortex liquid from the vortex solid/glass and a single Superconductor-Normal (SN) boundary. In this Comment, we show that precision rf penetration depth measurements indicate a much more complex picture than that presented in Ref. [1].
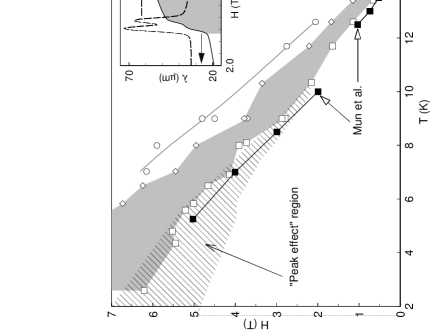
Our experiments are carried out on samples obtained from the same source as in Ref. [1], using an rf (3 MHz) tunnel diode technique. Details of the measurement technique and particularly results on single crystal YNi2B2C are described elsewhere [2]. Typical data observed for are shown in the inset of Fig.1. The data clearly show the presence of multiple transitions at characteristic fields and these are accentuated in the also shown in the plot. We have studied these features over a wide range of temperatures and fields in the superconducting state.
The phase diagram based on our results is shown in the main panel of Fig. 1 with and from Ref. [1] also included for comparison (filled squares/solid line). It is obvious that the phase diagram is quite complex [2], consisting of , possibly , transition lines. The vortex-glass transition identified by Ref. [1] lies in a region of the phase diagram where we have observed a signature of the “peak effect” indicative of a softening of the vortex lattice (hatched region)[2]. However, the melting line reported in Ref. [1] appears to coincide with the onset of a region (shown shaded) where we observe multiple structure in the transition [Fig. 1(inset)], which persists even above the glass-liquid transition reported in Ref. [1]. It is likely that these features have been missed by Ref. [1] owing to the experimental limitations of dc measurements. It is clear that a simple interpretation in terms of a single melting transition below a single boundary is inadequate.
We note other important features of our data:
-
1.
The multiple transitions appear to extend to the line which raises the possibility that these transitions, including the so-called melting line of Ref. [1], may be associated with the condensate rather than with vortices.
-
2.
Unlike dc measurements which are shorted out by the first superconducting percolative path, our rf measurements probe well () into the bulk of the sample. Thus, the multiple features we report may best be observed in ac measurements.
-
3.
Similar structure is observed in ErNi2B2C and HoNi2B2C also. Thus these features are common to other members of the borocarbide family, and apparently independent of the magnetic nature of the rare earth element.
-
4.
Polishing the crystal surface tends to suppress the uppermost field scale (marked by open cicles and a solid line in Fig. 1) indicative of a certain sensitivity to the microstructure. However, the multiple features in the shaded region remain unaffected. The uppermost field scale may be associated with surface superconductivity.
In conclusion, we have presented results that indicate that YNi2B2 C, as well as other members of the borocarbide superconductor family, possess unusual structure indicative of multiple transitions near the SN phase boundary. The melting line of Ref. [1] appears to be only one of these transitions. The origin of these transitions is not known at present. These results appear to preclude a simple description in terms of melting of the vortex lattice as arrived at in Ref. [1].
This work was supported by NSF-DMR-9623720. We thank Paul Canfield for providing the samples and useful discussions.
S. Sridhar, S. Oxx, Balam A. Willemsen, H. Srikanth and D. P. Choudhury
Physics Department, Northeastern University,
360 Huntington Ave., Boston, MA 02115
PACS: 74.60.Ec, 74.25.Fy, 74.60.Ge, 74.70.Ad
REFERENCES
- [1] M. Mun et al., Phys. Rev. Lett. 76, 2790 (1996).
- [2] S. Oxx et al., Physica C (to appear).