Microwave Properties of
Borocarbide Superconductors LnNi2B2C
(Ln = Y, Er, Tm, Ho)
Abstract
We report measurements of the microwave surface impedance of the borocarbide family of superconductors LnNi2B2C (LnY, Er, Tm, Ho). The experiments enable direct measurements of the superfluid density, and are particularly sensitive to the influence of magnetic pairbreaking. In HoNi2B2C the antiferromagnetic transition is clearly observed at zero field, and leads to a drastic reduction of the superfluid density, which recovers at lower temperatures. In ErNi2B2C the antiferromagnetic transition is not seen in zero field data. Magnetic effects are responsible for anomalies in the low temperature surface impedance below approximately 4K in HoNi2B2C and TmNi2B2C. The temperature dependence of the microwave impedance disagrees with simple BCS calculations.
Recently superconductivity was discovered in quaternary multiphase Y-Ni-B-C [1], in multiphase Y-Pd-B-C system [2] and in single phase LnNi2B2C (Ln=Y,Ho,Er,Tm,Lu) [3]. These materials are a class of intermetallic superconductors. While some members of the family, e.g. YNi2B2C, appear to show conventional superconducting behavior [4, 5], other members, with LnTm, Er, Ho, undergo an antiferromagnetic (AFM) transition at , below the superconducting transition at . Thus in addition to the important question of the nature of superconductivity issues concerning the interplay of magnetism and superconductivity arise in these materials.
Microwave measurements of superconductors yield unique information regarding the superfluid density, the quasiparticles and the nature of the pairing [6]. Despite the fact that magnetic superconductors such as ErRhB4 have been known for about two decades, there have been few microwave studies of such superconductors. In this paper we report the first measurements of the microwave response of several members of the family, LnNi2B2Cwith .
Single crystals of LnNi2B2C were grown out of Ni2B flux. Details are provided in Ref. [5]. The crystals have a plate-like morphology and X-ray diffraction indicates that they have their crystallographic c-axis perpendicular to the surface of the plate. Powder X-ray diffraction on ground single crystals indicate that there is a small amount of Ni2B flux contaminating the crystal, probably on the surface. This contamination is estimated to be below the 5% level. These crystals have been extensively characterized by a variety of techniques [5, 7, 8, 9] besides the microwave studies discussed here. Polycrystalline samples of YNi2B2C were also prepared and measured.
Microwave measurements were carried out in a Nb cavity using a high precision “hot finger” method [10], in which the cavity is maintained at 2 K while the sample temperature is varied from 2 K to as high as 200 K. The surface resistance of the sample is obtained from measurements of the resonator Q using , where and are respectively the resonator Q’s with and without the sample. Similarly changes in the reactance are obtained from , where and represent the resonant frequency with and without the sample. To get the absolute value of the reactance, an indeterminate constant needs to be added. In materials which obey the skin depth limit in the normal state, one can use the criterion that above to determine and so the absolute value of . The geometric constant was calculated, and confirmed using measurements on known samples of Cu. The method has been extensively validated via measurements on a variety of samples, from conventional low temperature superconductors, to high temperature superconducting crystals and films [11].
Because we are able to measure both the real and imaginary parts of the impedance , it is possible to obtain the complex conductivity from the present measurements, using the relation , where and are the normal state surface resistance and conductivity respectively. Of particular importance is the imaginary part . This quantity is a measure of the superfluid density which is proportional to . It is also related to the penetration depth via .
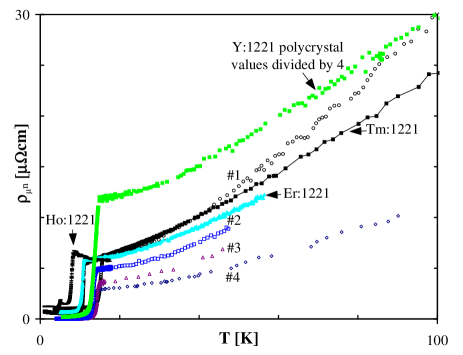
The microwave resistivity in the normal state, see Fig. 1, was obtained from the surface resistance using where is the permeability of free space. The data is in good agreement with dc measurements [12], confirming that the classical skin-depth regime applies in the normal state.
YNi2B2C
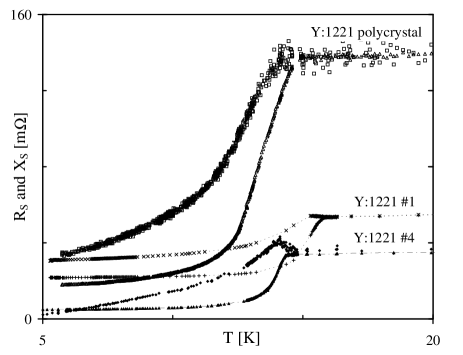
The superconducting surface resistance of several samples of YNi2B2C are shown in Fig. 2. The polycrystal shows higher and also a slightly broader transition than single crystals. It is evident that does not go to zero as . Thus there is a residual surface resistance which is of the order of and is, possibly, extrinsic in origin. This residual resistance does depend on sample characteristics such as crystallinity and surface preparation, being lowest for the polished single crystal . This is probably due to slight flux contamination which leads to a temperature-independent microwave loss.
Fig. 2 also shows the surface reactance . The absolute value was obtained by normalizing to above . A striking feature of the reactance data is the peak near . This can be understood from simple models of the superconducting state such as two- fluid or BCS (see below). This is in fact occasionally observed in other superconductors, and is due to buildup of superfluid, which leads to a situation where , the superconducting penetration depth is bigger than the normal state skin depth. This results in a peak in which we have observed in Y1Ba2Cu3O1-δ [13] also. If we substract the residual resistance from the low temperature reactance we can estimate a zero-temperature penetration depth for sample . Although this method is not very sensitive to the absolute magnitudes the agreement with other estimates of [5] is good.
TmNi2B2C
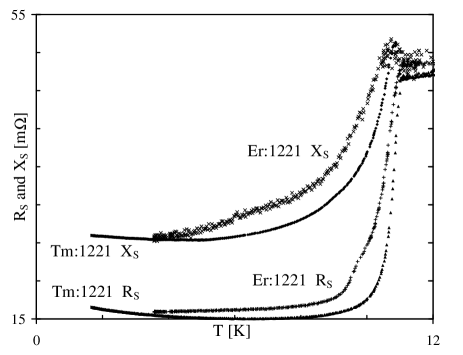
While the overall behavior of TmNi2B2C near and slightly below is similar to the compound (see Fig. 3), a noteworthy feature is the increase of at low temperatures. This is due to increasing magnetic coherence which results in a AFM transition at [14], which is however just below the lower limit of our apparatus. This is also consistent with a decrease of observed in the same temperature region [15]. The data demonstrate that the microwave measurements can provide a measure of the magnetic scattering through the influence on the surface impedance of the superconducting state.
ErNi2B2C
The response of this compound appears similar to that of the Y compound as shown in Fig. 3. Interestingly the AFM transition which should occur at [16, 15] as observed in specific heat, dc-resistivity and magnetic susceptibility measurements, does not appear in the microwave data. Thus in this compound, the AFM transition is not accompanied by pairbreaking in zero field. There is however a weak shoulder in the data at around K which is not associated with a feature in any other measurement.
HoNi2B2C
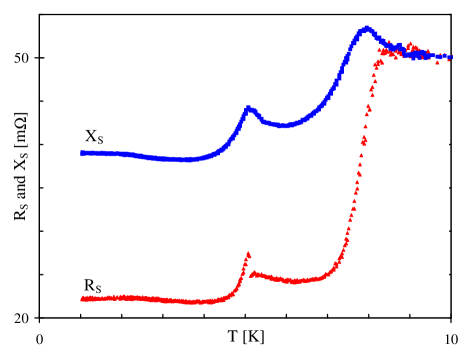
A detailed plot of vs. T in the region from 2K to 10K is shown in Fig. 4. The drop in at the superconducting transition temperature of 8K is clearly seen. In all conventional superconductors, and in YNi2B2C as shown above, decreases monotonically from the normal state value . Remarkably, in HoNi2B2C starts to increase again at around 6K. This is due to pair-breaking which accompanies the development of the antiferromagnetic state. At the AFM transition, shows a Peaks in are never seen in conventional superconductors, although non-monotonic dependence has been observed in Y1Ba2Cu3O1-δ [17].
It is very interesting to study the reactance as a function of temperature, also shown in Fig. 4. Below the superconducting transition at , increases due to the buildup of superfluid, as for the other superconductors, and then starts to decrease. However the AFM transition intervenes and appears as a peak, due to pairbreaking.
At low temperatures, both and are seen to increase with decreasing T. Although this is similar to that observed in TmNi2B2C, there is no AFM transition at a comparable temperature. Thus our data indicates a possibly new source of magnetic scattering below about .
Complex Conductivity and Superfluid density
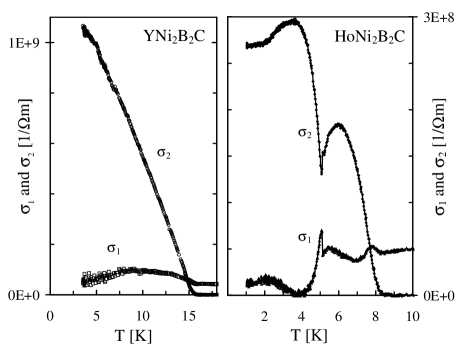
The real and imaginary parts of the conductivity and of YNi2B2C are shown in Fig. 5. Note that a residual was subtracted while computing the complex conductivity. has a “conventional” temperature dependence in that it rises smoothly at to a large value at low temperatures. However the detailed temperature dependence does not fit any conventional form such as of the 2-fluid model or a BCS form. Instead appears to be well described by a temperature dependence, except for a very slight curvature. rises from its normal state value and has a peak at around . This is not the behavior expected from BCS coherence factors since there the peak is around . Instead this is similar to the behavior of of YBa2Cu3O7-δ where there is a peak at around [17].
In HoNi2B2C, and hence are found to initially increase (see Fig. 5). However the AFM transition arrests this increase, and reduces the superfluid density, although superconductivity is not completely destroyed since does not become zero. Below the AFM transition, recovers. It is interesting that the behavior of very closely mirrors that of [9]. The AFM transition is also reflected in the temperature dependence of .
Discussion and Comparison with Theory
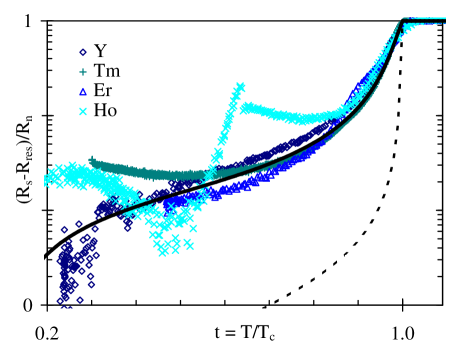
In order to address the issue of the nature of the superconducting order parameter, we plot the normalized surface resistance vs. for all the superconductors that were measured. The resulting plot shown in Fig. 6 is noteworthy in that the scaled plot appears to indicate a common, underlying temperature dependence, independent of sample, except of course for the expected deviations near in HoNi2B2C and the low temperature rise for HoNi2B2C and TmNi2B2C. Also shown in Fig. 6 is a comparison with numerical calculations based on the BCS theory using a Mattis-Bardeen complex conductivity in the local limit [18]. The gap parameter was used as an input parameter. The data do not agree with the numerical calculations if the mean-field value is used. Instead a much lower value fits the data better. This appears to be in conflict with measurements which suggest a BCS s-wave state for the borocarbides. Indeed gap ratios of to for YNi2B2C have been reported [14, 19, 20].
The data differ from the simple BCS analysis in three ways: (1) the broader temperature dependence which can be modeled as a smaller gap ratio, (2) the peaks at the AFM transition, and (3) the low temperature rise in HoNi2B2C and TmNi2B2C. The latter two features can be attributed to pair-breaking by the magnetic constituents Ho and Tm. While the first feature could arise from sample inhomogeneities at the surface, an interesting question is whether the broadened transition could be due to an unidentified source of pairbreaking which should then be present in all the compounds. Equally noteworthy is the absence of any signature of the AFM transition in the superconductor. Neutron scattering studies of HoNi2B2C [7] have shown the existence of a modulated magnetic structure from K to about K. Similar features are not observed in ErNi2B2C [21, 22]. Pairbreaking is significant only when there exists magnetic fields over length scales comparable to the coherence length, and this appears to occur in HoNi2B2C, but not in ErNi2B2C.
In conclusion, the microwave properties of several borocarbide superconductors reveal novel features of the superconducting state. The superfluid density which is obtained from the data displays striking features due to the influence of magnetic pairbreaking. The data reveal interesting results on the interplay of magnetism and superconductivity which deserve further experimental and theoretical studies.
Work at Northeastern was supported by NSF-DMR-9223850. Ames Laboratory is operated for the U. S. Department of Energy by Iowa State University under Contract No. W-7405-Eng-82. Work at Ames was supported by the Director for Energy Research, Office of Basic Energy Sciences.
REFERENCES
- [1] R. Nagarajan et al., Phys. Rev. Lett. 72, 274 (1994).
- [2] R. J. Cava et al., Nature 367, 146 (1994).
- [3] R. J. Cava et al., Nature 367, 252 (1994).
- [4] S. A. Carter et al., Phys. Rev. B 50, 4216 (1994).
- [5] M. Xu et al., Physica C 227, 321 (1994).
- [6] S. Sridhar, D.-H. Wu, and W. L. Kennedy, Phys. Rev. Lett. 63, 1873 (1989).
- [7] A. I. Goldman et al., Phys. Rev. B 50, 9668 (1994).
- [8] L. P. Le et al., international Conference on Strongly Correlated Electron Systems, Amsterdam, The Netherlands, August 15-18, 1994 (unpublished).
- [9] P. C. Canfield et al., Physica C 230, 397 (1994).
- [10] S. Sridhar and W. L. Kennedy, Rev. Sci. Instrum. 59, 531 (1988).
- [11] S. Oxx et al., Physica C 235-240, 889 (1994).
- [12] D. Naugle, private comm. (unpublished).
- [13] H. J. Chen, J. Owliaei, and S. Sridhar, Rev. Sci. Instrum. 65, 2635 (1994).
- [14] R. Movshovich et al., Physica C 227, 381 (1994).
- [15] H. Eisaki et al., Phys. Rev. B 50, 647 (1994).
- [16] B. K. Cho, P. C. Canfield, L. L. Miller, and D. C. Johnston (unpublished).
- [17] D. A. Bonn, P. Dosanjh, R. Liang, and W. N. Hardy, Phys. Rev. Lett. 68, 2390 (1992).
- [18] D. C. Mattis and J. Bardeen, Phys. Rev. 111, 412 (1958).
- [19] T. Ekino et al., Physica C 235-240, 2529 (1994).
- [20] T. Hasegawa et al., Physica C 235-240, 1859 (1994).
- [21] S. K. Sinha et al., Phys. Rev. B 51, 681 (1995).
- [22] J. Zarestky et al., Phys. Rev. B 51, 678 (1994).