Steep anomalous dispersion in coherently prepared Rb vapor
Abstract
Steep dispersion of opposite signs in driven degenerate two-level atomic transitions have been predicted and observed on the D2 line of 87Rb in an optically thin vapor cell. The intensity dependence of the anomalous dispersion has been studied. The maximum observed value of anomalous dispersion ( ) corresponds to a negative group velocity .
pacs:
42.50.Gy, 32.80.Qk, 42.62.Fi, 42.50.-pInvestigations of coherent effects in resonant media, namely coherent population trapping (CPT) and electromagnetically induced transparency (EIT) [1, 2], which can dramatically modify the absorptive and dispersive properties of an atomic vapor, have caused a rebirth of interest in the problem of light propagation through a dispersive medium. In the last decade, the study of the dispersive properties of coherently prepared media was always under attention due to fundamental and practical interest.
An ultra-large index of refraction in coherently prepared resonant gas was predicted[3] and a refractive index variation as large as was demonstrated in a dense Rb vapor[4]. It was also shown that a coherently driven medium exhibits large dispersion[5]. A high normal dispersion (up to ) was measured on the Cs line in a vapor cell[6] and in an atomic beam[7]. Recently, extremely slow light group velocity () associated with normal dispersion was demonstrated in an ultracold atomic sample[8]. However, the same order of magnitude of group velocity () was observed in a hot dense vapor cell[9].
All these investigations were carried on alkaline atoms where the absorption is strongly suppressed and dispersion is steep and normal () due to CPT between the two ground state hyperfine levels ( scheme). However, atomic coherence among Zeeman sublevels belonging to the same ground-state hyperfine level can led not only to usual EIT, but also to an absorption enhancement named as electromagnetically induced absorption (EIA)[10, 11]. Since EIT/EIA effects in degenerate two-level systems can produce a significant variation in the absorption with subnatural width, one can predict a large absolute value of dispersion in this case. Notice that at resonance dispersion would be normal () for EIT and anomalous () for EIA. In both cases the absolute value of the dispersion can be several orders of magnitude greater than for a linear medium. In this letter we present the first observation of steep anomalous and normal dispersion in coherently prepared degenerate two-level atomic system.
Refractive index and dispersion were analyzed with the model recently used to study subnatural EIA resonances[12]. In this model, two monochromatic optical fields, a drive field and a weak probe field with amplitudes , and frequencies , respectively are incident on motionless two-level atoms with resonance frequency and electric dipole moment . The atomic levels are degenerate. The configuration is closed. The spontaneous decay rate is . Finite interaction time is described by a relaxation rate (). The drive wave Rabi frequency is and its saturation parameter .
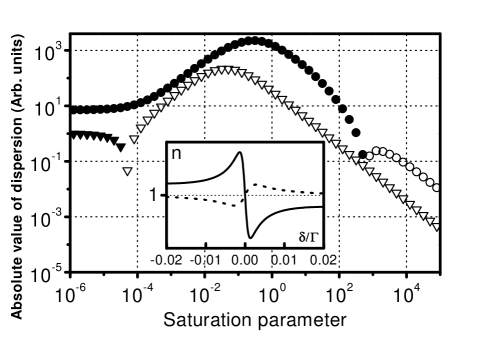
The calculated refractive index, tested by the probe wave in the presence of the drive field, as function of the frequency offset is presented in the inset of Fig.1. The shown spectra correspond to the closed transitions in the line of . The peak to peak refractive index variation is higher for the anomalous dispersion because the transition is stronger than the transition. The corresponding absolute value of the anomalous dispersion is also larger.
The values of and depend on light intensity, atomic density , level degeneracy, polarizations, among others parameters. Here we restrict our attention to the dependence with the drive-field intensity .
Since a general expression for in driven degenerate two-level systems is not available at present, we consider as a guide the analytical expression corresponding to the ideal scheme[7]:
| (1) |
where is the wavelength of the optical transition. At low intensity () and around are growing linearly with . For high intensity (), and are inversely proportional to . It can be shown that the maximum for and are reached for when the saturation parameter .
Such behavior may be explained in the following way: At low intensity, when power broadening is not significant (the width of the resonance is determined by the ground-state relaxation), the amplitude is growing linearly with intensity, while the width remains almost constant. In this case, grows linearly with . The dispersion saturates when the resonance width is determined by power broadening. At high intensity, the refractive index and the absorption saturate [12] while the resonance width still grows. So, in this region decreases with intensity.
The calculated intensity dependences of the dispersion at resonance () shown in Fig.1 are in qualitative agreement with the simple analytical expression (Eq.1) for low and high drive intensity. At very low drive intensity (linear absorption) the dispersion for the two transitions considered in Fig.1 is anomalous. For higher drive intensity there is absorption enhancement (EIA) for one transition and absorption reduction (EIT) for the other. The first case results in anomalous dispersion while the second one corresponds to normal dispersion. The two curves have a maximum at moderate intensity (). At large drive intensities () the dispersion on both transitions is normal and exhibits the same linear asymptotic behavior.
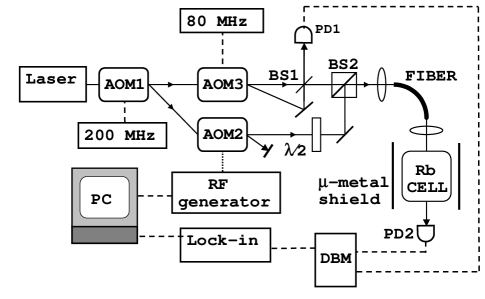
The experiment was realized on the D2 line of 87Rb in a vapor cell. We used a phase heterodyne method to measure the refractive index. The idea of this approach is based on the well-known method of FM spectroscopy and the two-mode technique[13]. Our method is similar to that used for dispersion measurements [7] and for Doppler-free spectroscopy [14]. To obtain information about , the phase of a RF-signal produced by mixing the resonant probe wave with a non-resonant auxiliary wave (having the same optical path) is compared to an RF reference produced by the mixing of undisturbed fractions of the probe and the auxiliary waves. The variation of the phase difference between the two RF-signals, due to the atomic medium dispersion, is , where is the vapor cell length. With these technique, the influence of acoustic noise is dramatically reduced compared to the homodyne method based on a Mach-Zehnder interferometer[4, 6].
The scheme of the experimental setup is shown in Fig.2. A single-mode extended cavity diode laser frequency lockable to a Rb saturated absorption resonance was used. Two mutually coherent waves with tunable optical frequency offset were obtained by using two acousto optic modulators (AOM’s 1,2) [10]. The diffracted output from AOM2, driven by a tunable RF generator, was used as the drive wave. The two outputs of AOM3 (with fixed frequency offset) were combined on the beamsplitter BS1. One of this beamsplitter outputs was used as the signal wave. It contains two frequency components, the resonant probe wave and the non resonant auxiliary wave. The second output was used to produce the RF-reference on the photodiode (PD1). Signal and drive waves with orthogonal linear polarizations were superimposed on the polarization beamsplitter BS2. After spatial filtering in a 50-cm long single-mode optical fiber, the pump and signal waves were sent through a 5-cm long Rb cell at room temperature. The external magnetic field at the cell was reduced to level using a -metal shield. Maximum powers of the drive and the signal waves at the cell were and respectively. A double balanced mixer (DBM) was used as a phase detector. The voltage-to-phase response of the DBM was calibrated introducing known delays between the two inputs. A lock-in amplifier was used for signal processing.
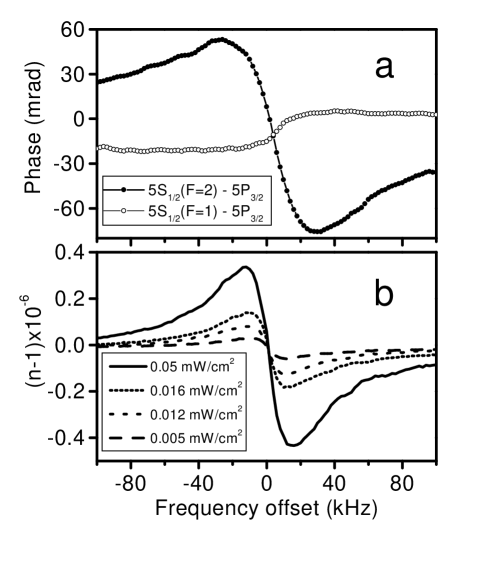
Experimental spectra of the probe wave phase variation on transitions from the two ground state hyperfine levels (at the same conditions) are shown in Fig.3a. Around the phase variations have opposite slope signs corresponding to opposite signs of the dispersion. The line shapes are in reasonable agreement with the spectra calculated for motionless atoms and single closed transitions (Fig.1). This agreement may seem rather surprising since in the experiment, due to the velocity distribution, three different atomic transitions, one closed and two open contribute to the signal in each case. On all open transitions as well as on the closed transition EIT occurs and consequently the dispersion is normal. Only on the transition EIA takes place and the dispersion is anomalous[12]. However, due to optical pumping the signal is essentially determined by the closed transitions resulting in the qualitative agreement with the theoretical prediction. To compare quantitatively the experimental spectra with theory, velocity distribution, excited state hyperfine splitting and optical depopulation of open transitions should be taken into account.
The value of can be obtained taking into account the cell length (). The error in the measured absolute value of the refractive index and the dispersion was around 15%. However, the reproducibility of relative measurements was within 2%.
In the following, we investigate the intensity dependence of the steep anomalous dispersion. Experimental spectra of the refractive index for different values of the drive intensity are shown in Fig.3 b. was varied from to by using filters while the light diameter in the cell was . At such low intensities and are growing linearly with intensity. In this case, the refractive index can be characterized by a nonlinear Kerr coefficient : []. Notice that the value of is a rapidly varying function of . At we have . The maximum observed dispersion at low drive intensity was .
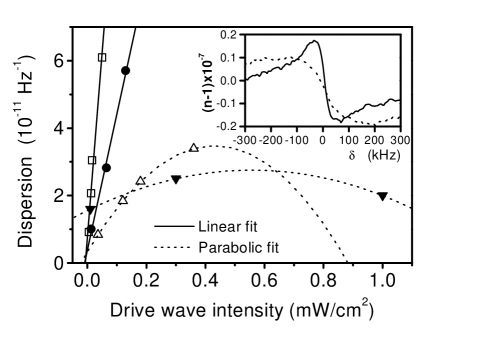
Based on the previous considerations, the attempt was made to maximize the dispersion by increasing the drive intensity. Because of laser power limitation, the increase of was obtained through light cross-section reduction using a telescope. For three different diameters (, and ), the drive wave attenuation resulted in dispersion reduction (Fig.4) indicating that we were in the region below the maximum of the dependence . The absolute values of and were reduced ( and for and drive beam diameter, respectively) in spite of the fact that the intensity was higher. However, we should notice that the light cross-section reduction results in a shortening of the interaction time. The observed reduction of the dispersion for smaller beam diameters indicates that the role of the interaction time is essential. Only at light wave diameter close to we were able to reach a maximum in the dependence. At relatively high intensity ( ) the dispersion decreases with drive intensity and the refractive index profile becomes significantly different from a dispersion function (see inset of Fig.4). We noticed that within some range of intensity, (around ) is almost independent on , while the spectral distance between extrema of is growing with . This distortion reflects the influence of different time constants. The precise comparison with theory requires a detailed consideration of the transient behavior of the coherent medium.
It is possible to characterize a dispersive medium by a light group velocity . Steep dispersion () is intimately associated with large group velocity near the resonance. The maximum obtained value of steep anomalous dispersion corresponds to a rather slow negative group velocity . It is interesting to mention that the value of can be infinitely large with opposite sings at relatively low anomalous dispersion ( ). According to the linear fits on Fig.4 this can be easily obtained with a very weak drive intensity . Also in our case a wide range group-velocity variation can be achieved by switching between normal and anomalous dispersion (selecting the atomic transition) and/or varying the drive intensity.
Large dispersion is interesting for different applications. Several ways, in addition to optimizing , can be considered to increase the dispersion (both normal and anomalous) in degenerate two-level systems. Since and are proportional to the atomic density while the resonant medium is thin, it is possible to obtain higher dispersion at higher . In an optically thick medium, thanks to EIT, further increase of normal dispersion is possible[15]. Another possibility is to use a medium with very slow ground state relaxation, for instance in a cell with buffer gas [16] or a cell with an anti-relaxation coating [17]. According to Eq. 1 one can expect that in this case less intensity is needed to reach the maximum of the dependence ().
Coherently prepared media with optically controlled dispersion can be of interest for the design of new devices for pulse delaying/compressing in communication systems and optical computing. Also, the use of steep magnetically dependent dispersion for high precision magnetometry was discussed in detail [18]. We should notice, however, that the requirements on the coherent medium are somehow different for these applications. For pulse processing elements the bandwidth should be rather wide to permit operation with short pulses. On another hand higher sensitivity for low frequency variations of magnetic field require narrow resonances. Steep dispersion on driven degenerate two-levels systems appear suitable for the two types of applications.
In conclusion, we have demonstrated for the first time, in agreement with the theoretical prediction, steep normal and anomalous dispersion in a driven degenerate two-level atomic system. This result clearly stresses the importance of degenerate two-level systems for the investigation of quantum coherence and applications.
This work was supported by CONICYT (Project 92048), CSIC and PEDECIBA (Uruguayan agencies).
REFERENCES
- [1] S. E. Harris, Physics Today, 50(7) 36 (1997).
- [2] E. Arimondo, Coherent population trapping, Progress in Optics XXXV, 257 (1996) and references therein.
- [3] M.O. Scully, Phys. Rev. Lett. 67, 1855 (1991).
- [4] A.S. Zibrov et al, Phys. Rev. Lett. 76, 3935 (1996).
- [5] S.E. Harris, J.E. Feld, and A. Kasapi, Phys. Rev. A 46, R29 (1992).
- [6] O. Schmidt, R. Wynands, Z. Hussein, and D. Meschede, Phys. Rev. A 53, R27 (1996).
- [7] G. Muller, A. Wicht, R. Rinkleff, and K. Danzmann, Optics Commun. 127, 37 (1996).
- [8] L.V. Hau, S.E. Harris, Z. Dutton, and C.H. Behroozi, Nature 397, 594 (1999).
- [9] M.M. Kash, V.A.Sautenkov, A.S. Zibrov, L. Hollberg, G.H. Welch, M.D. Lukin, Yu. Rostovtsev, E.S. Fry, and M. Scully, submitted to Phys. Rev. Lett. (1999).
- [10] A.M. Akulshin, S. Barreiro and A. Lezama, Phys. Rev. A 57, 2996 (1998). A.M. Akulshin, S. Barreiro and A. Lezama, SPIE vol.3485, 194 (1998).
- [11] A.V. Taichenachev, A.M.Tumaikin, and V.I. Yudin, JETP Lett. 69, (1999) [Pis’ma ZhETF 69, 776 (1999)].
- [12] A. Lezama, S. Barreiro, and A.M. Akulshin, Phys. Rev. A 59, 4732 (1999).
- [13] M.A. Gubin, D.A. Tyurikov, A.S. Shelkovnikov et al, IEEE J.Quantum Electron., 31, 2177 (1995).
- [14] D. Tyurikov, G. Kramer, and B. Lipphardt, IEEE Trans.on Instrum.& Measur., 46, 174 (1997).
- [15] M.D.Lukin et al, Phys. Rev. Lett. 79, 2959 (1997).
- [16] S. Brandt, A. Nagel, R. Wynands, and D. Meschede, Phys. Rev. A 56, R1063 (1997).
- [17] D. Budker, V. Yashchuk, and M. Zolotarev, Phys. Rev. Lett. 81, 5788 (1998).
- [18] M.O. Scully and M. Fleischhauer, Phys. Rev. Lett. 69, 1360 (1992). H. Lee, M. Fleischhauer and M. Scully, Phys. Rev. A 58, 2587 (1998) and references therein.