Coherent optical detection of highly excited Rydberg states using electromagnetically induced transparency
Abstract
We observe electromagnetically induced transparency (EIT) on the transition in a room temperature rubidium vapour cell by coupling the state to a Rydberg state ( or with to ). We demonstrate that the narrow line–width of the EIT resonance (2 MHz) allows precise measurement of the state fine structure splitting, and together with the sensitivity of the Rydberg state to electric fields, we are able to detect transient electric fields produced by the dynamics of charges within the cell. Coherent coupling of Rydberg states via EIT could also be used for cross–phase modulation and photon entanglement.
pacs:
03.67.Lx, 32.80.Rm, 42.50.GyIn comparison to low energy atomic states, highly excited Rydberg states (with principal quantum ) display rich many–body behavior due to their enhanced two–body interactions gallagher ; mour98 . For example, a gas of ultra–cold Rydberg atoms is found to evolve spontaneously into a plasma robi00 and back kili01 . There is considerable interest in the potential to exploit the strong dipole – dipole interaction between Rydberg atoms pillet06 to realise fast quantum gates jaksch00 ; lukin01 . The dipole – dipole interactions also leads to ionization if the ions are not separately confined li05 . In addition, electromagnetically induced transparency (EIT) involving a Rydberg transition could be used to devise a photonic phase gate for optical quantum computing fried05 .
Experimentally, Rydberg atoms are detected indirectly via the ions or electrons produced by an ionization pulse gallagher . This detection technique provides high efficiency but is destructive and the atom cannot be re–used. For quantum information applications a non–destructive detection of the Rydberg state is preferable. One possibility is electromagnetically induced transparency (EIT) which is manifest as an absence of absorption or an associated rapid variation in the dispersion allowing dissipation free sensing of the desired atomic resonance. EIT has been widely studied in atomic vapors eit_review , frequently using a – scheme where a coherence is induced between two ground states. Alternatively, in the ladder scheme the coherence is induced between a ground state and an excited state via an intermediate state gea95 . Previously, excited states with principal quantum number up to have been observed via optical probing of a ladder system clark01 .
In our work, we present experimental results on an EIT ladder system involving highly excited Rydberg states with . We show that the non–destructive probing of a Rydberg level opens up an wide range of possible experiments. In particular we focus on two applications: Firstly we exploit the narrow line–width of the EIT spectra to extend measurement of the series fine structure splitting up to . Secondly, we illustrate the potential of Rydberg EIT for detecting the dynamics of ions or electrons in the vicinity of the Rydberg excitation region. As ions can be produced by either interactions li05 or the laser fields used to excite and trap Rydberg atoms potv06 , knowledge of the role of ions is essential to the success of quantum gate schemes. As we show Rydberg EIT provides an useful diagnostic of the presence of charges.
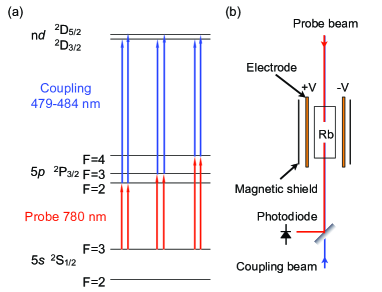
The energy levels of 85Rb relevant to this work and the experimental set-up are shown in Fig. 1. The EIT ladder system consists of a weak probe beam resonant with transition and an intense coupling beam resonant with the or as indicated in Fig. 1(a). The state hyperfine splitting is negligible. The probe beam with wavelength nm, power 1 W and beam size 0.4 mm ( radius) propagates through a room temperature rubidium vapor cell of length 75 mm, Fig. 1(b). The transmission through the cell as the probe beam is scanned is monitored on a photodiode. The probe laser polarization is varied between linear (vertical or horizontal) and circular using appropriate waveplates. The coupling beam with wavelength nm is produced by a commercial doubled diode laser system (Toptica TA-SHG). The coupling beam counter–propagates through the cell with a power up to 200 mW, a spot size of 0.8 mm ( radius), and linear polarization in the vertical direction. The vapor cell is placed inside a -metal shield to reduce the effect of stray magnetic fields.
A typical spectrum corresponding to the 85Rb ladder system is shown in Fig. 2. In (a) we show the probe absorption with the coupling laser tuned close to and far way from the resonance. The frequency axis is calibrated using the known splittings between the hyperfine states rapo03 . Note that due to the Doppler mismatch between the probe and coupling lasers, the hyperfine splitting of the state is scaled by a factor of , and the fine structure splitting of the state by .
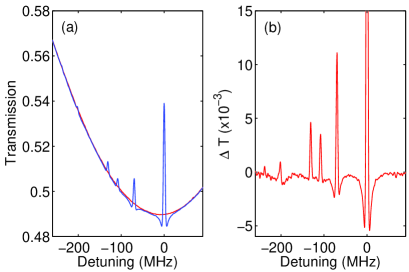
In Fig. 2(b) we show the difference between the resonant and far–detuned traces. The spectrum contains six lines corresponding to transitions between the , 3, and 4 hyperfine states in the state and both the fine structure components and of the state as indicated in Fig. 1(a). The position of the EIT peak within the Doppler broadened absorption profile is determined by the coupling laser detuning. For a coupling power of 180 mW, the largest peak corresponding to the resonance, produces a change in the probe transmission of 5. This peak height is reduced and the width is increased by about a factor of two if we remove the magnetic shield. The observed spectra are not strongly dependent on the probe laser polarization.
The line–width of the EIT resonance is between and MHz depending on the laser power and the transition. The EIT line–width is considerably narrower than the natural width of the intermediate states (6 MHz) but much larger than the natural width of the Rydberg states. At low probe laser power, the line–width is limited by the line–width of the probe and coupling lasers and incomplete cancellation of the Doppler shifts due to the wavelength mismatch. The line–width can be broadened to of order 10 MHz by increasing the probe intensity above saturation providing a convenient signal for frequency stabilization of the 480 nm laser.
Also apparent in Fig. 2(b) is that the lineshape of the EIT feature displays enhanced absorption just below and above the two–photon resonance. This effect arises due to the wavelength mismatch between the coupling and probe lasers. Although the effect is known kris05 , it has not been observed in previous experiments. One can obtain a theoretical prediction for the EIT lineshape using an approximate expression for the susceptibility derived in the limit of a weak probe gea95
| (1) | |||||
where , , and are the probe or coupling laser Rabi frequencies, detunings and wavevectors, respectively, and is the number density of 85Rb atoms with velocity . The decay rates are the natural widths of the intermediate and upper state in the ladder system. Additional line broadening mechanisms such as laser line–width can be included in . By summing the contributions from the different hyperfine lines in the state (with appropriate weightings) and integrating the imaginary part of (1) over the velocity distribution for a room temperature vapor one obtains the absolute absorption coefficient, and hence the transmission through the vapor cell as a function of the probe detuning. Multiple levels in the upper state of the ladder system can be included by adding extra coupling terms in Eq. (1) badg01 . Fig. 3 shows the prediction of Eq. (1) in comparison to the experimental data for (a) and (b) . The only fit parameters are the Rabi frequency and detuning of the coupling laser, the rate , and the fine structure splitting of the state. The enhanced absorption observed at higher , Fig. 3(a), is accurately predicted by Eq. (1).
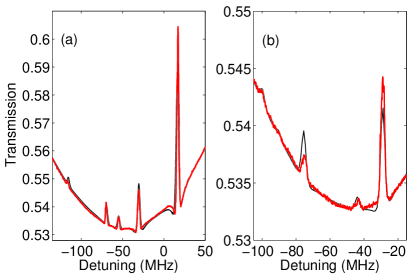
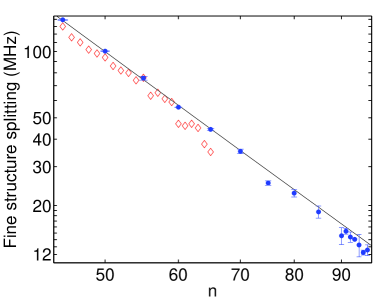
For the state, Fig. 3(b), the change in the probe transmission is reduced to about 1. This is consistent with the expected scaling of the coupling beam Rabi frequency. We can still observe the EIT resonance up to the state and using lock-in detection up to the state. The EIT spectra give a direct measure of the state fine structure splittings. Previous measurements using two–photon absorption and a thermionic diode to detect the ionised Rydberg states have reported values up to harv77 . We are able to resolve the splitting up to . In Fig. 4 we plot the fine structure splitting as a function of together with data from harv77 . The line shows a fit assuming a form with GHz and , where is the quantum defect. The spectrum displays an asymmetric lineshape which leads to a systematic error. Our measured splittings are typically larger than those observed in harv77 by up to 10 MHz.
Finally, we investigated the effect of an external electric field on the Rydberg energy levels by applying a voltage between the copper bar electrodes shown in Fig. 1(b). We observe no effect on the EIT spectra for dc electric fields up to 100 Vcm-1 regardless of the probe and coupling laser polarizations suggesting that the Rydberg atoms are being screened. The main source of charge within the cell appears to be ions and electrons produced by photo – desorption induced by the coupling laser at the surface of the cell xu96 . For example, by retro–reflecting the 480 nm laser with a glancing angle at the cell wall we can generate an asymmetric charge distribution which creates a field of order 50 mV/cm in the EIT interaction region. We can detect this small field as a 2.5 MHz splitting of the line.
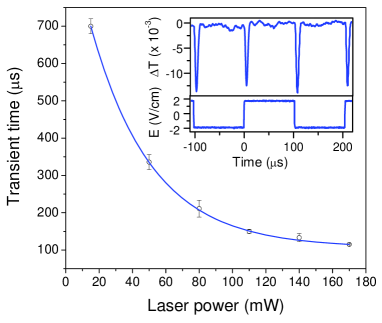
To further investigate the screening effect and charge dynamics within the cell, we studied the effect switching the electric field direction in a time of order 1 s. For a dc field, the charges drift with a distribution which exactly compensates the applied field. However, if the field is switched in a time less than the relaxation time of the charge distribution there is incomplete cancellation of the applied field leading to a perturbation of the EIT signal. To monitor the response of the EIT peak to a time varying field we lock the probe laser to the transition using polarization spectroscopy pear02 , and tune the coupling laser to resonance with the transition. The change in transmission () as the field is switched is shown in Fig. 5(inset). Each time the field direction changes the EIT peak is suppressed due to the transient penetration of the applied field. The duration of this transient depends linearly on the amplitude of the field, and decreases exponentially with the coupling laser power, see Fig. 5. The dependence on the coupling laser power arises because at higher power the charge density is increased and the distribution can relax faster towards the steady–state fully–screened distribution. There is a small asymmetry between the response to increasing and decreasing field that depends on the alignment of the EIT probe relative to the center axis of the cell.
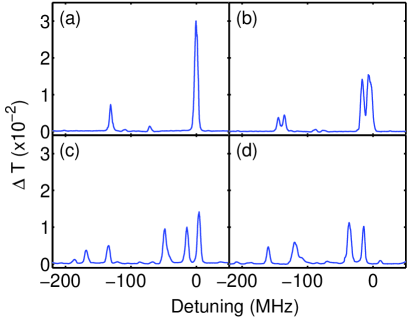
If we apply an rf frequency to the electrodes then the time variation of the field is too fast for either the ions or electrons to screen the field. In this case, the and resonances are split into 3 and 2 lines corresponding to their respective components, as shown in Fig. 6. Similar spectra have recently been observed by ionizing ultra–cold Rydberg atoms grab06 . In a time varying field, one may not expect to observe narrow lines, however, due to the quadratic dependence on the electric field, the time dependence of the resonance lines has a rectified –dependence which is almost like a dc field. The distortion of the lineshape due to the time–dependence of the field is most apparent in the line (at MHz in Fig. 6(d)) as it has the highest field sensitivity. These results indicate that Rydberg EIT could provide a useful optical probe of photo–ionization processes and plasma dynamics.
In summary, we have demonstrated the coherent optical detection of highly excited Rydberg states (up to ) using EIT, providing a direct non–destructive probe of Rydberg energy levels. The observed spectra, display enhanced absorption below and above the Rydberg resonance, and can be accurately predicted by the optical Bloch equations. The narrow line–width of the EIT resonance allows us to extend measurements of the fine structure splitting of the series up to . We also show that the EIT spectra are sensitive to charge dynamics within the cell. In our experiment the density of atoms participating in the EIT resonance is more than two orders of magnitude lower than the density used in the observation of dipole blockade pillet06 . In future work we will apply the technique to higher density vapors to investigate dipole blockade effects and their potential application in photon entanglement fried05 .
We are grateful to S. L. Cornish, I. G. Hughes, M. P. A. Jones and R. M. Potvliege for stimulating discussions and A. P. Monkman for the loan of equipment. We also thank the EPSRC for financial support.
References
- (1) T. F. Gallagher, Rydberg atoms (Cambridge University Press, Cambridge 1994).
- (2) I. Mourachko, D. Comparat, F. de Tomasi, A. Fioretti, P. Nosbaum, V. M. Akulin, and P. Pillet, Phys. Rev. Lett. 97, 083003 (2006).
- (3) M. P. Robinson, B. Laburthe Tolra, M. W. Noel, T. F. Gallagher, and P. Pillet, Phys. Rev. Lett. 85, 4466 (2000).
- (4) T. C. Killian, M. J. Lim, S. Kulin, R. Dumke, S. D. Bergeson and S. L. Rolston, Phys. Rev. Lett. 86, 3759 (2001).
- (5) T. Vogt, M. Viteau, J. Zhao, A. Chotia, D. Comparat, and P. Pillet, Phys. Rev. Lett. 97, 083003 (2006).
- (6) D. Jaksch, J. I. Cirac, P. Zoller, S. L. Rolston, R. Côté and M. D. Lukin, Phys. Rev. Lett. 85, 2208 (2000).
- (7) M. D. Lukin, M. Fleischhauer, R. Côté, L. M. Duan, D. Jaksch, J. I. Cirac and P. Zoller, Phys. Rev. Lett. 87, 037901 (2001).
- (8) W. Li, P. J. Tanner and T. F. Gallagher, Phys. Rev. Lett. 94, 173001 (2005).
- (9) I. Friedler, D. Petrosyan, M. Fleischhauer, and G. Kurizki, Phys. Rev. A 72, 043803 (2005).
- (10) M. Fleischhauer, A. Imamoglu and J. P. Marangos, Rev. Mod. Phys. 77, 633 (2005).
- (11) M. Xiao, Y. Q. Li, S. Z. Jin and J. Gea–Banacloche, Phys. Rev. Lett. 74, 666 (1995).
- (12) J. Clarke, H. Chen and W. A. van Wijngaarden, Appl. Opt. 40, 2047 (2001).
- (13) R. M. Potvliege and C. S. Adams New J. Phys. 8, 163 (2006).
- (14) U. D. Rapol, A. Krishna and V. Natarajan, Eur. Phys. J. D 23, 185 (2003).
- (15) A. Krishna, K. Pandey, A. Wasan and V. Natarajan, Europhys. Lett. 72, 211 (2005).
- (16) S. D. Badger, I. G. Hughes and C. S. Adams, J. Phys. B 34, L749 (2001).
- (17) K. C. Harvey and B. P. Stoicheff, Phys. Rev. Lett. 38, 537 (1977).
- (18) J. H. Xu, A. Gozzini, F. Mango, G. Alzetta and R. A. Bernheim, Phys. Rev. A 54, 3146 (1996).
- (19) C. P. Pearman, C. S. Adams, S. G. Cox, P. F. Griffin, D. A. Smith, and I. G. Hughes J. Phys. B 35, 5141 (2002).
- (20) A. Grabowski, R. Heidemann, R. Löw, J. Stuhler and T. Pfau, Fortschr. Phys. 54, 765 (2006).