First measurements of the index of refraction of gases for lithium atomic waves
Abstract
We report the first measurements of the index of refraction of gases for lithium waves. Using an atom interferometer, we have measured the real and imaginary parts of the index of refraction for argon, krypton and xenon, as a function of the gas density for several velocities of the lithium beam. The linear dependence of with the gas density is well verified. The total collision cross-section deduced from the imaginary part of is in very good agreement with traditional measurements of this quantity. Finally, the real and imaginary parts of and their ratio exhibit glory oscillations, in good agreement with calculations.
The concept of the index of refraction for waves transmitted through matter was extended from light waves to neutron waves around 1940, as reviewed by M. Lax lax51 . The extension to atom waves has been done by D. Pritchard and co-workers, with the first measurements of the index of refraction of gases for sodium waves schmiedmayer95 in 1995 and the subsequent observation of glory oscillations on the index variations with sodium velocity schmiedmayer97 ; hammond97 ; roberts02 ; roberts02a . We report here the first measurements of the index of refraction of gases for lithium waves.
Several papers forrey96 ; forrey97 ; leo00 ; kharchenko01 ; forrey02 ; blanchard03 ; vigue95 ; audouard95 ; champenois97 ; champenois99 have dealt with the theory of the index of refraction . The index of refraction is proportional to the forward scattering amplitude, which can be calculated if the interaction potential between an atom of the wave and an atom of the target gas is known. The imaginary part of the forward scattering amplitude is related to the total cross section but its real part can be measured only by atom interferometry. This amplitude exhibits resonances, for a collision energy comparable to the potential well depth, and glory oscillations, for larger energy. These glory oscillations are due to the existence of a undeflected classical trajectory resulting from the compensation of attractive and repulsive forces pauly79 .
A measurement of the index of refraction thus provides a new access to atom-atom interaction potentials. Many other experiments are sensitive to the atom-atom interaction potentials: in the particular case of alkali-rare gas pairs, measurements of total and differential cross sections, line broadening experiments and spectroscopy of van der Waals molecules have been much used. Each technique is more sensitive to a different part of the potential curve and one would expect that very accurate potentials are available, but, as shown by the calculations done by D. Pritchard and co-workers and by our research group roberts02 ; champenois97 ; champenois99 , the index of refraction deduced from various potentials differ substantially, thus proving the need for more accurate potentials.
Our experiment is similar to the experiment of D. Pritchard and co-workers schmiedmayer95 ; schmiedmayer97 ; roberts02 . We have measured separately the real and imaginary parts of with a good accuracy and tested their linear dependence with the gas density. The total collision cross-section deduced from our measurement of the imaginary part is in very good agreement with previous measurements by L. Wharton and co-workers ury72 ; dehmer72 . Our measurements of the real and imaginary parts of and of their ratio are in good agreement with the calculations done by C. Champenois champenois99 , using potential curves fitted by L. Wharton and co-workers ury72 ; dehmer72 .
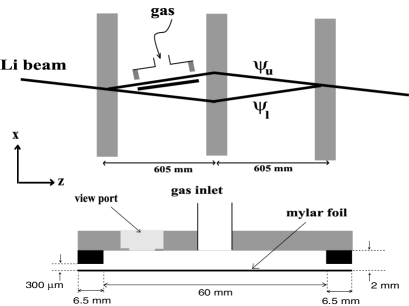
The principle of the experiment is to introduce some gas on one of the atomic beams inside an atom interferometer, as represented in Fig. 1. Noting the waves propagating on the upper/lower paths inside the interferometer, the interference signal is given by:
| (1) |
The phase , which depends on the grating positions ( is the grating wavevector), is used to observe interference fringes. We can rewrite equation (1):
| (2) |
is the mean intensity, the fringe visibility and we have added the detector background . When the atomic wave propagates in a gas of density , its wave vector becomes , where is the index of refraction. For a gas cell of length in the upper path, the wave is replaced by the transmitted wave given by:
| (3) |
with and . The signal given by equation (2) is modified, with a phase shift . The mean intensity and the fringe visibility are both changed and is related to these quantities by:
| (4) |
Our Mach-Zehnder atom interferometer uses laser diffraction in the Bragg regime miffre05 , with a laser wavelength close to the lithium first resonance line at nm. To optimize the signal for the 7Li isotope with first order diffraction, we have used a frequency detuning equal to GHz, a total laser power equal to mW and a beam waist radius mm. The lithium beam mean velocity is varied by seeding lithium in a rare gas mixture and the velocity distribution thus achieved has a full width at half maximum close to %.
For a mean atom velocity m/s, the maximum distance between the atomic beam centers, close to m, is sufficient to insert a septum between these beams. The septum, a m thick mylar foil, separates the gas cell from the interferometer vacuum chamber. This cell is connected to the interferometer chamber by m wide slits as shown in Fig. 1, in order to reduce the gas flow. The cell is connected by a mm diameter ultra-high vacuum gas line to a leak valve used to introduce the gas. An other valve connects the gas line to the interferometer vacuum chamber so that the cell pressure can be reduced to its base value in about s. We use high purity gases from Air Liquide (total impurity content below ppm) and a cell pressure in the millibar range. The pressure is measured by a membrane gauge (Leybold CERAVAC CTR91), with an accuracy near %. When the cell is evacuated, the measured pressure, millibar, is negligible. Because of the gas flow through the connection pipe, the cell pressure is slightly less than the measured value as the gauge is at about cm from the cell. Molecular flow theory predicts that the pressure in the cell is homogeneous within % and that . The conductances of the pipe, , and of the slits, , have been calculated and we get . We then use the ideal gas law at K to deduce the gas density in the cell.
We record interference fringes by displacing the third standing wave mirror with a linear voltage ramp applied on a piezo-electric stage. In order to correct the interferometer phase drift, each experiment is made of three sweeps, the first and third ones ( and ) with an empty cell and the second one () with a pressure . The counting time is s per data point, with points per sweep. After the third sweep, we flag the lithium beam to measure the detector background . We assume that the phase can be written , where the quadratic term describes the non-linearity of the piezo stage ( being the channel number). The best fit of each recording, using equation (2), provides the initial phase , the mean intensity and the fringe visibility . We thus get the effect of the gas, namely the phase shift , and the attenuation given by equation (4) (the value is taken as the mean of the and values).
| gas | Ar | Kr | Xe |
|---|---|---|---|
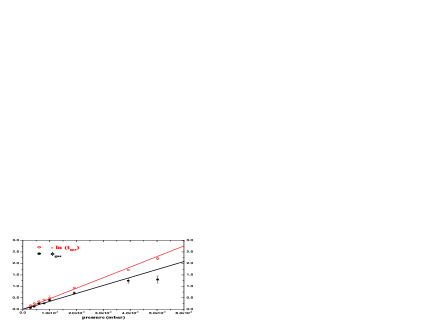
For a given lithium mean velocity , we measure the phase shift and the amplitude attenuation for various gas pressures and we plot and as a function of pressure (see Fig. 2). These two quantities are expected to vary linearly with the gas density schmiedmayer95 ; schmiedmayer97 ; hammond97 and the high signal to noise ratio of our experiments allows us to confirm these theoretical expectations. To deduce from this plot, we need the value. is calculated from the lithium beam mean velocity measured by Bragg diffraction. The effective cell length is calculated by weighting each element by the local gas density. In the molecular regime, the density in the slits varies linearly with and vanishes near the slit exit beijerinck75 . The effective length is then the sum of the inner part length and of the mean of the slit lengths, mm. Our final results are the real and imaginary parts of divided by the gas density and the dimensionless ratio . These results are collected in table 1 for a lithium beam mean velocity m/s and we have similar data for several other velocities.
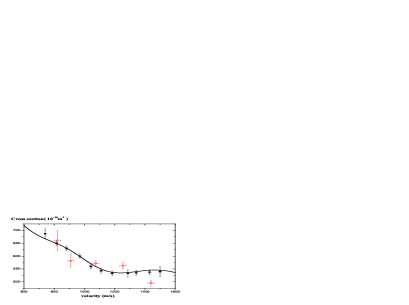
The imaginary part of the index of refraction, which measures the attenuation of the atomic beam by the gas, is related to the total collision cross section by where designates the average over the target gas thermal velocity. Fig. 3 compares the cross section deduced from our index measurements with the values obtained by L. Wharton and co-workers by scattering techniques ury72 ; dehmer72 : the agreement is very good, although the velocity distribution of our lithium beam, with a full width at half maximum close to %, is broader than the % FWHM distribution used by L. Wharton and co-workers.
From theory champenois97 ; champenois99 , we know that decrease with the lithium velocity , like , with glory oscillations superimposed on this variation. We suppress this rapid variation by plotting the real and imaginary parts of : Fig. 4 presents such a plot in the case of xenon, with our measurements and calculated values obtained by C. Champenois in her thesis champenois97 using the Buckingham-Corner potential fitted by Dehmer and Wharton dehmer72 .
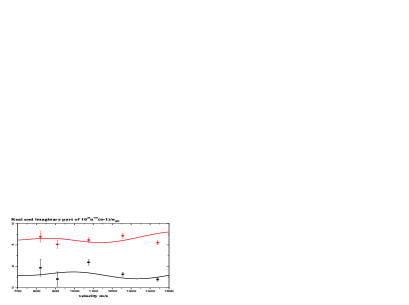
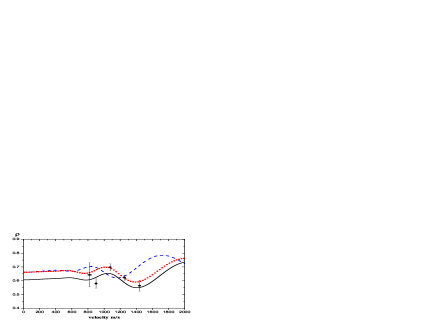
Figure 5 compares our measurements of the ratio with calculations. We have chosen the case of xenon for which we have more data points. The mean value is lower than the value predicted by the group of D. Pritchard schmiedmayer95 ; schmiedmayer97 for a purely attractive potential. A lower mean value is expected when the terms of the expansion of the long range potential are also attractive and not negligible champenois97 . Moreover, a glory oscillation is clearly visible on our measurements as well as on the calculations done by C. Champenois champenois99 with three different potential curves: two ab initio potentials cvetko94 ; patil91 and the Buckingham-Corner potential of Dehmer and Wharton dehmer72 . The three calculated curves reproduce well the observed amplitude of the glory oscillation. The observed phase is close to the calculated phase for the potentials of references cvetko94 ; dehmer72 and not for the one of reference patil91 . This is not surprising as this phase is very sensitive to the potential well depth champenois97 .
In this letter, we have described the first measurements of the index of refraction of gases for lithium waves, with an experiment similar to those performed by D. Pritchard and co-workers with sodium waves schmiedmayer95 ; schmiedmayer97 ; roberts02 . A gas cell, introduced on one of the atomic beams inside an atom interferometer, modifies the wave propagation and this modification is detected on the interference signals. We have measured the real and imaginary parts of the index of refraction for three gases and several lithium velocities and we have verified the linear dependance of with the gas density . Our measurements of the imaginary part of are in very good agreement with previous measurements of the total cross-section and the real part, which can be measured only by atom interferometry, is also in good agreement with calculations of this quantity. Moreover, the comparison between experimental and theoretical values of the ratio is already able to favor certain interaction potentials.
We hope to improve our experiment, in particular the septum which limits our ability to use higher velocities of the lithium beam. The measurement of the index of refraction in a larger velocity range and with an improved accuracy should then provide a stringent test of interaction potentials. However, it seems clear that index of refraction measurements cannot be inverted to provide a very accurate interaction potentials, as long as the target gas is at room temperature, because thermal averaging washes out the low-energy resonances and most of the glory oscillations. An experiment with a target gas at a very low temperature should provide a lot more information forrey97 ; blanchard03 ; audouard95 . Finally, if the target gas and the atomic beam were both ultra-cold, one could study the index of refraction in the quantum threshold regime and measure the atom-atom scattering length as well as low energy resonances kharchenko01 ; vigue95 . The collision experiment involving two ultra-cold atom clouds, which was made by J. Walraven and co-workers buggle04 , proves the feasibility of dense enough gas targets for collision studies. The development of a cold atom interferometer coupled to such a gas target remains to be done.
Finally, the interaction of a matter wave with a gas induces decoherence. This effect was studied by Hornberger et al. with C70 in a Talbot Lau interferometer hornberger03 and by Uys et al. with sodium in a Mach-Zehnder interferometer uys05 : in both cases, a low pressure of gas is introduced everywhere inside the interferometer. This decoherence process depends on the momentum transferred to a particle of the wave by a collision with an atom of the scattering gas and on the interferometer geometry (separation between the two arms, size of the detector). This decoherence effect is thus quite different from the index of refraction for which all scattering events contribute.
Acknowledgements.
We have received the support of CNRS MIPPU, of ANR and of Région Midi Pyrénées. The technical staff, G. Bailly, D. Castex, M. Gianesin, P. Paquier, L. Polizzi, T. Ravel and W. Volondat, has made these experiments possible. We thank former members of the group A. Miffre, C. Champenois and N. Félix, for their help and A. Cronin, for fruitful advice.References
- (1) M. Lax, Rev. Mod. Phys. 23, 287 (1951)
- (2) J. Schmiedmayer et al., Phys. Rev. Lett. 74, 1043 (1995)
- (3) J. Schmiedmayer et al. in Atom interferometry edited by P. R. Berman (Academic Press, San Diego 1997), p 1
- (4) T. D. Hammond et al., Braz. J. Phys. 27, 193 (1997)
- (5) T. D. Roberts et al., Phys. Rev. Lett. 89, 200406 (2002)
- (6) T. D. Roberts, Ph. D. thesis (unpublished), MIT
- (7) R. C. Forrey et al., Phys. Rev. A 54, 2180 (1996)
- (8) R. C. Forrey et al., Phys. Rev. A 55, R3311 (1997)
- (9) P. J. Leo, G. Peach and I. B. Whittingham, J. Phys. B: At. Mol. Opt. Phys. 33, 4779 (2000)
- (10) V. Kharchenko and A. Dalgarno, Phys. Rev. A 63, 023615 (2001)
- (11) R. C. Forrey, V. Kharchenko and A. Dalgarno, J. Phys. B: At. Mol. Opt. Phys. 35, L261 (2002)
- (12) S. Blanchard, D. Civello and R. C. Forrey, Phys. Rev. A 637, 013604 (2003)
- (13) J. Vigué, Phys. Rev. A 52, 3973 (1995)
- (14) E. Audouard, P. Duplaà and J. Vigué, Europhys. Lett. 32, 397 (1995) and erratum 37, 311 (1997)
- (15) C. Champenois et al., J. Phys. II France 7, 523 (1997)
- (16) C. Champenois, thesis Université P. Sabatier 1999, available on http://tel.archives-ouvertes.fr/tel-00003602
- (17) H. Pauly in Atom-Molecule Collision Theory edited by R. B. Bernstein (Plenum Press, New York and London 1979), p. 111-199
- (18) G. B. Ury and L. Wharton, J. Chem. Phys. 56, 5832 (1972)
- (19) P. Dehmer and L. Wharton, J. Chem. Phys. 57, 4821 (1972)
- (20) A. Miffre et al., Eur. Phys. J. D 33, 99 (2005)
- (21) H. C. W. Beijerinck and N. F. Verster, J. Appl. Phys. 46, 2083 (1975)
- (22) D. Cvetko et al., J. Chem. Phys. 100, 2052 (1994)
- (23) S. Patil, J. Chem. Phys. 94, 8089 (1991)
- (24) Ch. Buggle et al., Phys. Rev. Lett. 93, 173202 (2004)
- (25) K. Hornberger et al., Phys. Rev. Lett. 90, 160401 (2003)
- (26) H. Uys, J. D. Perreault and A. Cronin, Phys. Rev. Lett. 95, 150403 (2005)