Optical storage of high density information beyond the diffraction limit : a quantum study
Abstract
We propose an optical read-out scheme allowing a demonstration of principle of information extraction below the diffraction limit. This technique, which could lead to improvement in data read-out density onto optical discs, is independent from the wavelength and numerical aperture of the reading apparatus, and involves a multi-pixel array detector. Furthermore, we show how to use non classical light in order to perform bit discrimination beyond the quantum noise limit.
pacs:
42.50.Dv; 42.30.Va; 42.30.WbIntroduction
The reconstruction of an object from its image beyond the diffraction limit, typically of the order of the wavelength, is a hot field of research, though a very old one, as Bethe already dealt with the theory of diffraction by sub-wavelength holes in 1944 Bethe . More recently, theory has been developed to be applied to the optical storage problem, in order to study the influence of very small variations of pit width or depth relative to the wavelength Bethe ; Marx1 ; Marx2 ; Wang ; Liu ; Brok . To date, only a few super-resolution techniques Kolobov include a quantum treatment of the noise in the measurement, but to our knowledge, none has been applied to the optical data storage problem.
Optical discs are now reaching their third generation, and have improved their data capacity from 0.65 GB for compact discs (using a wavelength of 780 nm), to 4.7 GB for DVDs ( = 650 nm), and eventually to 25 GB for the Blu-Ray discs (using a wavelength of 405 nm). In addition to new coding techniques, this has been achieved by reducing the spot size of the diffraction-limited focused laser beam onto the disc, involving higher numerical apertures and shorter wavelengths.
Several further developments are now in progress, such as the use of volume holography, 266 nm reading lasers, immersion lenses, near field systems, multi-depths pits Hsu , or information encoding on angle positions of asymmetrical pits TorokCD . These new techniques rely on bit discrimination using small variations of the measured signals. Therefore, the noise is an important issue, and ultimately, quantum noise will be the limiting factor.
In this paper, we investigate an alternative and complementary way to increase the capacity of optical storage, involving the retrieval of information encoded on a scale smaller than the wavelength of the optical reading device. We investigate a way to optimize the detection of sub-wavelength structures using multi-pixel array. An attempt to a full treatment of the optical disc problem being far too complex, we have chosen to illustrate our proposal on a very simple example, leaving aside most technical constraints and complications, but still involving all the essence of the overall problem.
We first explain how the use of an array detector can lead to an improvement of the detection and distinction of sub-wavelength structures present in the focal spot of a laser beam. We then focus on information extraction from an optical disc with a simple but illustrative example, considering that only a few bits are burnt on the dimensions of the focal spot of the reading laser, and show how the information is encoded from the disc to the light beam, propagated to the detector, and finally detected. We explain the gain configuration of the array detector that has to be chosen in order to improve the signal-to-noise ratio (SNR) of the detection. Moreover, as quantum noise is experimentally accessible, and will be a limiting factor for further improvements, we perform a quantum calculation of the noise in the detection process. Indeed, we present how this detection can be optimized to perform simultaneous measurements below the quantum noise limit, using non classical light.
I Proposed scheme for bit sequence recognition in optical discs
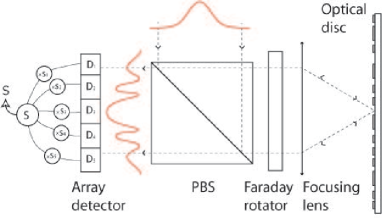
We propose a novel optical read-out scheme shown on figure (1) allowing information extraction from optical discs beyond the diffraction limit, based on multi-pixel detection. Bits, coded as pits and holes on the optical disc, induce phase flips in the electric field transverse profile of the incident beam at reflection. The reflected beam is imaged in the far field of the disc plane, where the detector stands. In the far field, the phase profile induced by the disc is converted into an intensity profile, that the multi-pixel detectors can, at least partly, reconstruct.
Taking into account that a lot of a priori information is available - i.e. only a finite number of intensity profiles is possible - we propose to use a detector with a limited number of pixels whose gains can independently be varied depending on which bit sequence one wants to detect. The signal is then given by
| (1) |
where is the mean photon number detected on pixel , and is the electronic gain of the same pixel. Ideally, to each bit sequence present on the disc corresponds a set of gains chosen so that the value of the measurement is zero, thus cancelling noise from the mean field. Measuring the signal for a given time interval around the centered position of a bit sequence in the focal spot, and testing, in parallel, all the pre-define sets of gain in the remaining time, allows to deduce which bit sequence is present on the disc.
We will first show that this improvement in density of information encoded on an optical disc is already possible using classical resources. Moreover, as the measurement is made around a zero mean value, the classical noise is mostly cancelled. Hence, we reach regimes where the quantum noise can be the limiting factor. We will demonstrate how to perform measurements beyond the quantum noise limit, using previous results on quantum noise analysis in multi-pixel detection developed in reference Treps .
II Encoding information from a disc onto a light beam
We have explained the general principle of reading-out sub-wavelength bit sequences encoded on an optical disc, and now focus on the information transfer from the optical disc to the laser beam, through an illustrative example.
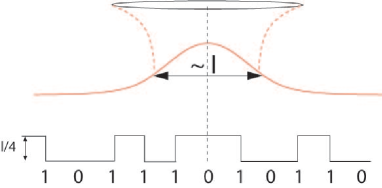
Let us recall that bits are encoded by pits and holes on the disc surface: a step change from hole to pit (or either from pit to hole) encodes bit , whereas no depth change on the surface encodes bit , as represented on figure (2). A hole depth of insures a phase shift between the fields reflected by a pit and a hole. In this section, we compute the incident field distribution on the optical disc affected by the presence of a bit sequence in the focal spot, and finally analyze the intensity back reflected in the far field, in the detection plane, as sketched on figure (1).
II.1 Beam focalization
Current optical disc read-out devices involve a linearly polarized beam strongly focused on the disc surface to point out details whose size is of the order of the laser wavelength. The numerical aperture () of the focusing lens can be large ( for CDs, for DVDs, and for BLU RAY discs), and the exact calculation of the field cannot be done in the paraxial and scalar approximation. Thus, the vectorial theory of diffraction has to be taken into account.
The structure of the electromagnetic field in the focal plane of a strongly focused beam has been investigated for decades now VanNie , as its applications include areas such as microscopy, laser micro-fabrication, micromanipulation, and optical storage Landesman ; Rodriguez ; Ulanowski ; Lax ; Seshadri ; Ciattoni ; Cao ; Nieminen .
In our case of interest, we can restrict the field calculation to the focal plane, which is the disc plane. Thus Richards and Wolf integrals Richards , which are not suitable for a general propagation of the field, but which can provide the field profile in the focal plane for any type of polarization of the incoming beam as long as the focusing length is much larger than the wavelength, can be used to achieve this calculation. These integrals have already been used in many publications dealing with tight focusing processes Quabis1 ; Novotny ; Dorn ; Quabis2 ; Sheppard ; Torok ; Youngworth ; Zhan . As highlighted in these references, the importance of the vectorial aspect of the field can easily be understood when a linearly polarized beam is strongly focused, as the polarization of the wave after the lens is not perpendicular to the propagation axis anymore and has thus components along this axis. In order to estimate the limit of validity of the paraxial approximation, we computed focused spot sizes of linearly polarized beam in the focal plane for different numerical apertures, first in the paraxial approximation, and then calculated with Richards and Wolf integrals. The results are compared on figure (3) for an incident plane wave in air medium with , where the spot size is defined as the diameter which contains of the focused energy, as in reference Siegman .
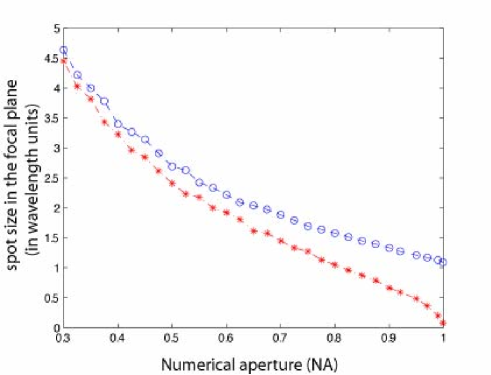
We see that when the numerical aperture exceeds , a good prediction requires a non-paraxial treatment. Moreover, whereas there is no theoretical limit to focalization in the paraxial case, we see that non paraxial effects prevent us to reach a waist smaller than the order of the wavelength. Note that this limit is not fundamental and can be overcome by modifying the polarization of the incoming beam. Quabis et al. have indeed managed to reduce the spot area to about using an incident radially polarized doughnut beam Quabis1 ; Quabis2 .
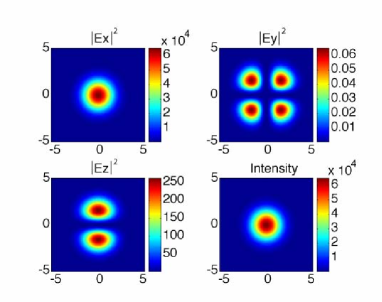
As our aim is to present a demonstration of principle and not a full treatment of the optical disc problem, the following calculations will be done using the physical parameters of the actual Compact Discs ( and , corresponding to a focalization angle of degrees in air medium). In this case, the paraxial and scalar approximations are still valid. Indeed, figure (4), giving the transverse profile of the three field components and the resultant intensity in the focal plane using the former parameters, shows that although the field is not strictly linearly polarized as foreseen before, , and we can thus consider that only is different from zero with a good approximation. Note that the exact expression would not intrinsically change the problem, as our scheme can be adapted to any field profile discrimination.
II.2 Reflection onto the disc
In order to compute the reflected field, we simply assume that bumps and holes are generated in such a way that they induce a phase shift between them at reflection on the field profile. Note that the holes depth is usually , but precise calculations would be required to give the exact shape of the pits, as they are supposed to be burnt below the wavelength size, and as the field penetration in those holes is not trivial Wang ; Brok ; Liu . As we have shown that only one vectorial component of the field was relevant in the focal plane, we can directly apply this phase shift to the amplitude profile of this component.
We first envision a scheme with only three bits in the focal spot, which means that different bit sequences, i.e. a byte, have to be distinguished from each other, using the information extracted from the reflected field. Note that we neglect the influence of other bits in the neighborhood. A more complete calculation involving this effect with more bits will be considered in a further approach.
The amplitude profiles obtained when the incident beam is centered on a bit of the CD are presented on figure (5), for a particular bit sequence. Note that we have chosen the space between two bits on the disc equal to the waist size of the reading beam. The first three curves respectively show the field amplitude profile incident on the disc, an example of a bit sequence, and the corresponding profile just after reflection onto the disc. We see that binary information is encoded from bumps and holes on the CD to phase flips in the reflected field.
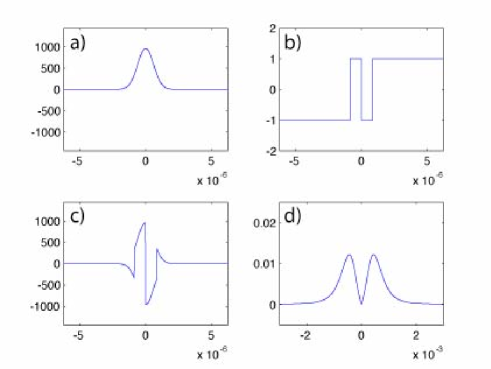
II.3 Back propagation to the detector plane
In order to extract the information encoded in the transverse amplitude profile of the beam, the field has to be back propagated to the detector plane. A circulator, composed of a polarizing beam splitter and a Faraday rotator, ensures that the linearly polarized reflected beam reaches the array detector, as shown on figure (1). Assuming that the detector is positioned just behind the lens plane, the expression of the detected field is given by the far field of the disc plane, apertured by the diameter of the focusing lens. As the focal length and the diameter of the lens are large compared to the wavelength, we use Rayleigh Sommerfeld integral to compute the field in the lens plane Born . As an example, the calculated far field profile when the bit sequence is present in the focal spot is shown on the fourth graph of figure (5).
The presence of the lens provides a limited aperture for the beam and cuts the high spatial frequencies of the field, which can be a source of information loss, as the difference between each bit sequence can rely on those high frequencies. However, we will see that enough information remains in the low frequency part of the spatial spectrum, so that the bits can be distinguished. This is due to the fact that we have in this problem a lot of a priori information on the possible configurations to distinguish.
We see on figure (6) that, with the physical parameters used in compact disc read out devices, 6 over 8 profiles in the detector plane are still different enough to be distinguished.
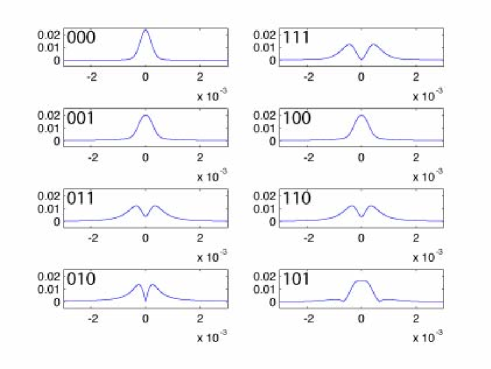
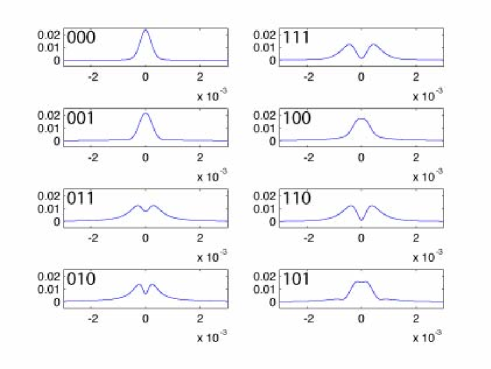
At this stage, we are nevertheless unable to discriminate between symmetric configurations, because they give rise to the same far field profile. Therefore, 100 and 001, and 110 and 011, cannot be distinguished. Note that this problem can be solved thanks to the rotation of the disc. Indeed, an asymmetry is created when the position of the disc relative to the laser beam is shifted, thus modifying differently the two previously indistinguishable profiles. As shown on figure (7), where the far field profiles are represented after a shift of in the position of the disc, the degeneracy has been removed. Moreover, it is important to notice that the other profiles experience a small shape modification. This redundant information is very useful in order to remove ambiguities while the disc is rotating.
III Information extraction for bit sequence recognition
In this section, we describe the detection,present some illustrative results, and the way they can be used to increase the read-out precision of information encoded on optical discs. We show here that a pixellised detector with a very small number of pixels is enough to distinguish between the bit sequences. Note that for technical and computing time reasons, it is not realistic to use a CCD camera to record the reflected images, as such cameras cannot yet combine good quantum efficiency and high speed.
III.1 Detected profiles
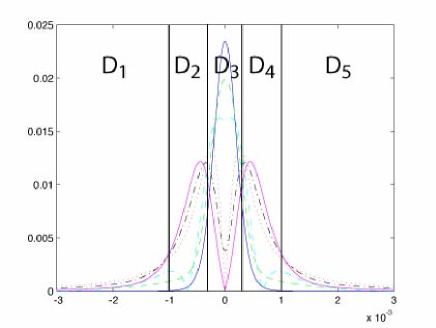
For simplicity reason, we limit our calculation to a pixels array detector , each of whom has an electronic gain , as shown on figure (8). The size of each detector has been chosen without a systematic optimization, which will be done in a further approach. Gain values are adapted to detect a mean signal equal to zero for each bit configuration present in the focal spot, in order to cancel the common mode classical noise present in the mean field Treps . It means that for each bit sequence , gains are chosen to satisfy the following relation
| (2) |
where is the mean photon number detected on pixel when bit is present in the focal spot on the disc
| (3) |
where is the number of photon incident on the array detector, at position , when bit sequence is present in the focal spot.
As all profiles are symmetrical when the incident beam is centered on a bit, we have set and . In addition, we have chosen . Using these relations and equation (2), we compute gain values adapted to the recognition of each bit sequence.
Note that the calculation of each gain configuration requires a priori information on the far field profiles, or at least an experimental calibration using a well-known sample.
Now that these gain configurations are set, we can investigate for a bit sequence on the optical disc.
III.2 Classical results
The expression of the detected signal is given by
| (4) |
where refers to the bit sequence effectively present in the focal spot, and to the gain set adapted to the detection of the bit sequence . It merely corresponds to the intensity weighted by the electronic gains. Note that for - and only in this case if the detector is well chosen - the mean value of the signal is equal to zero, according to equation (2). All possible values of are presented for a total number of incident photons , in table (1) where is read vertically, and corresponds to the bit sequence on the disc, whereas is read horizontally and refers to the gain set adapted to the detection of bit . In order not to have redundant information, we have gathered results corresponding to identical far field profiles. A zero value is obtained for only one gain configuration, allowing an identification of the bit sequence present in the focal spot.
| 000 | 001/100 | 010 | 011/110 | 101 | 111 | |
|---|---|---|---|---|---|---|
| 000 | 0 | -34 | -204 | -254 | -77 | -303 |
| 001/100 | 15 | 0 | -76 | -99 | -19 | -121 |
| 010 | 23 | 20 | 0 | -6 | 16 | -13 |
| 011/110 | 24 | 22 | 5 | 0 | 19 | -5 |
| 101 | 19 | 11 | -36 | -50 | 0 | -63 |
| 111 | 24 | 23 | 9 | 5 | 20 | 0 |
The reading process to determine which bit sequence is lit on the disc follows these few steps :
-
•
the time dependent intensity is first measured on each of the five detectors with all electronic gains set to one.
-
•
these intensities are integrated for a time .
-
•
the signal is then calculated, using the different gain configurations
-
•
the bit sequence effectively present in the focal spot is determined by the only signal yielding a zero value.
Note that the second step just corresponds to the measurements. The integration time is chosen as the time interval during which the signal leads to the determination of a unique bit sequence. The third step corresponds to the simple calculation of a line in table 1. This can be done in parallel thanks to the speed of data processing on dedicated processors, and the reading rate will thus not be affected compared to current devices. Finally, note that the last step requires a good choice of the parameters in order to be able to distinguish all bit sequences. It means that the noise level has to be smaller than the difference between the two closest values from , in order to get a zero mean value for only one bit sequence. Indeed, there must be no overlap between the expectation values when we take into account the noise and thus the uncertainty relative to each measurement. Note that using the zero value as the discriminating factor could be combined with the use of all the calculated values, as each line of table (1) is distinct. We just need to know how to weight each data point according to the noise related to its obtention.
IV Noise calculation
IV.1 The shot noise limit
To include the noise in our calculation, we separate classical and quantum noise contributions. The classical noise comprises residual noise of the laser diode, mechanical and thermal vibrations. The major part of this noise is directly proportional to the signal, i.e. to the number of detected photons. For a detection of the total number of photons in the whole beam during the integration time of the detector, the classical noise contribution would thus be written as
| (5) |
where is a constant factor. And the individual noise variable arising from detection on pixel is given by
| (6) |
Using equations 4, 5 and 6, a simple calculation yields the variance of the signal arising from the classical noise
| (7) |
where the constant is the classical noise factor, and is chosen so that, when and when all the intensity is detected by one detector, the classical noise term is equal to the shot noise term. Note that classical noise does not deteriorate measurements having a zero mean value. For this reason, we have chosen to discriminate bit sequences by choosing gains such as , as mentioned earlier.
The calculation of the quantum contribution requires the use of quantum field operators, describing the quantum fluctuations in all transverse modes of the field. By changing the gain configuration of the array detector, not only the signal is modified, but also the related quantum noise denoted , as different gain configurations are sensitive to noise in different modes of the field. We have shown in reference Treps that for a multi-pixel detection of an optical image, the measurement noise arises from only one mode component of the field, referred to as the detection mode, or noise-mode Del . The expression of the quantum noise is then :
| (8) |
where is the quantum noise contribution of the noise-mode which is defined for one set of gain , when the bit sequence is present in the focal spot, as
| (9) |
and where is a normalization factor, which expression is
| (10) |
The noise-mode corresponds in fact to the incident field profile weighted by the gains. The shot noise level corresponds to .
The variance of the signal can eventually be written as:
| (11) |

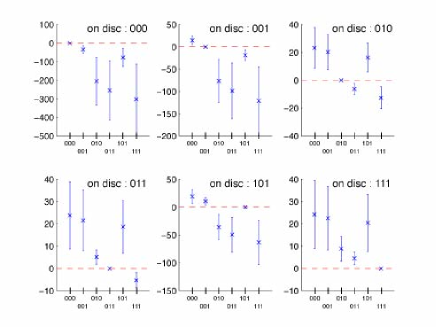
We have first represented the classical noise with an excess noise of , as error bars for each result , on figures (9). We have chosen a representation with a number of detected photons of only . Each of the insets refers to the measurement obtained for a particular bit sequence in the focal spot. The data points and associated error bars refer to the results obtained when the gain configurations are tested. One inset thus corresponds to one line in table (1). We can see that with this choice of parameters, the bit sequence effectively present in the focal spot can be determined without ambiguity by the only zero value. The sequence corresponds to the one for which the gains were optimized. We see that bit sequence discrimination can be achieved even with a very low number of photons. The relative immunity to classical noise of our scheme arises from the fact that measurements are performed around a zero mean value. Thus, given this limit in the minimum necessary photon number and the flux of photons one can calculate the maximum data rate, which is found to be (this estimation takes into account an integration time corresponding to of the delay between the read-out process of two adjacent bits with a laser). This very high value shows that classical noise should not be a limit for data rate in such a scheme.
The effect of quantum noise is very small, but becomes a limiting factor for such a small number of detected photons, or for a large number of bits encoded on the disc in the wavelength size. In order to see independently the effect of each contribution to the noise, we have thus represented on figure (10) the shot noise also for detected photons, appearing as the threshold under which it is impossible to distinguish bit sequences because of the quantum noise. Note that for the represented case, the shot noise is the most important contribution, and that it prevents a bit sequence discrimination, as a zero value for the signal can be obtained for several gain configurations in the same inset.
IV.2 Beyond the shot noise limit
When the shot noise is the limiting factor, non classical light can be used to perform measurements beyond the quantum noise limit. We have shown in reference Treps that squeezing the noise-mode of the incident field was a necessary and sufficient condition to a perfect measurement. What we are interested in is improving the measurements that yield a zero value, which are obtained when the gain configuration matches the bit sequence in the focal spot, as . Using equation (11), we see that has to be squeezed. As no information on the bit present in the focal spot is available before the measurement, in order to improve simultaneously all the bit sequences detections, the noise-modes have to be squeezed at the same time in the incident field. These transverse modes are not necessarily orthogonal, but one can show that squeezing the subspace that can generate all of them is enough to induce the same amount of squeezing.
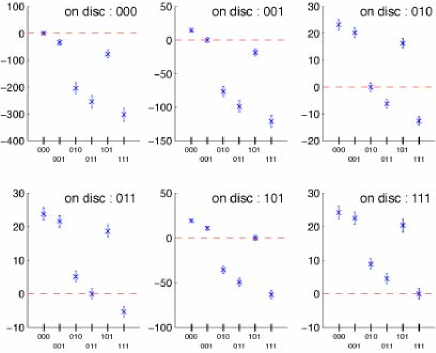
The quantum noise with of squeezing on the sub space generated by the is represented as error bars on figure (11). The noise of each noise-mode is computed using its overlap integrals with the generator modes of the squeezed sub space, assuming that all modes orthogonal to the squeezed subspace are filled with coherent noise. In this case, the effect of squeezing, reducing the quantum noise on the measurements, and especially on the measurement for which the gains have been optimized, is enough to discriminate bit sequences that were masked by quantum noise.
V Conclusion
We have proposed a novel way of information extraction from optical discs, based on multi-pixel detection. We have first demonstrated, using only classical resources, that this detection could allow large data storage capacity, by burning several bits in the spot size of the reading laser. We have presented a demonstration of principle through a simple example which will be refined in further studies. We have also shown that in shot noise limited measurements, using squeezed light in appropriate modes of the incident laser beam can lead to improvement in bit sequence discrimination.
The next steps are to study in details how to extract the redundant information when the disc is spinning, and to systematically optimize the number of bits in the focal spot, the number and size of pixels in the array detector. Such a regime involving a large number of bits in the focal spot will ultimately be limited by the shot noise, and will require the quantum noise calculations presented in this paper.
VI Acknowledgment
We thank Magnus Hsu, Ping Koy Lam and Hans Bachor for fruitful discussions.
Laboratoire Kastler Brossel, of the Ecole Normale Superieure and University Pierre et Marie Curie, is associated to CNRS. This work has been supported by the European Union in the frame of the QUANTIM network (contract IST 2000-26019).
References
- (1) H. A. Bethe, Phys. Rev. 66 7 and 8, 163 (1944)
- (2) D. S. Marx, and P. Psaltis, J. Opt. Soc. Am. A 14 6, 1268 (1997)
- (3) D. S. Marx, and P. Psaltis, Appl. Opt. 36 25, 6434 (1997)
- (4) X. Wang, J. Mason, M. Latta, T. C. Strand, D. S. Marx, and P. Psaltis, J. Opt. Soc. Am. A 18 3 565 (2001)
- (5) W.-C. Liu, and M. W. Kowarz, Appl. Opt. 38 17, 3787 (1999)
- (6) J. M. Brok, and H. P. Urbach, J. Opt. Soc. Am. A 20 2, 256 (2003)
- (7) M. Kolobov et al, Opt. Let. 85, 3789 (2000)
- (8) M.T.L. Hsu, W.P.Bowen, C.Fabre, H.-A. Bachor and P.K. Lam, ”Two-Pixel Phase Coding of Optical Beams Using Squeezed Light” (to be submitted)
- (9) P. Török, Proceeding AOI conference (2005).
- (10) N. Treps, V. Delaubert, A. Maître, J.M. Courty and C. Fabre, Phys. Rev. A 71, 013820 (2005)
- (11) A. G. van Nie, Rigorous calculation of the electromagnetic field of a wave beam, Philips Res. Rep. 19, 378?394 (1964).
- (12) M. Lax, W. H. Louisell, and W. B. McKnight, Phys. Rev. A 11, 1365 (1975).
- (13) S. R. Seshadri, J. Opt. Soc. Am. 19, 2134 (2002) and references therein.
- (14) A. Ciattoni, B. Crosignani, and P. Di Porto, Opt. Commun. 177, 9 (2000).
- (15) Q. Cao and X. Deng, J. Opt. Soc. Am. A 15, 1144 (1998).
- (16) B. T. Landesman and H.H. Barrett, J. Opt. Soc. Am. A 5, 1610 (1988).
- (17) G. Rodriguez-Morales and S. Chavez-Cerda, Opt. Let. 5, 430 (2004).
- (18) Z.Ulanowski and I. K. Ludlow, Opt. Let. 25 1792 (2000).
- (19) T. A. Nieminen, H. Rubinsztein-Dunlop, and N. R. Heckenberg, submitted to Elsevier.
- (20) B. Richards, E.Wolf, Electromagnetic diffraction in optical systems, Proc. R. Soc. A 253, 359 (1959).
- (21) S. Quabis, R. Dorn, M. Eberler, O. Glöckl, and G. Leuchs, Appl. Phys. B 72, 109 (2001).
- (22) L. Novotny, R. D. Grober, and K. Karrai, Ot. Let. 26, 789 (2001).
- (23) R. Dorn, S. Quabis, and G. Leuchs, preprint : arxiv/physics/0310007.
- (24) S. Quabis, R. Dorn, M. Eberler, O. Glöckl, and G. Leuchs, Opt. Com. 179, 1 (2000).
- (25) C. J. R. Sheppard, J. Opt. Soc. Am. A 18, 1579 (2001).
- (26) P. Török, P. Varga, Z. Laczik, and G. R. Booker, J. Opt. Soc. Am. A 12, 325 (1995).
- (27) K. S. Youngworth, and T. G. Brown, Opt. Expr. 7, 77 (2000).
- (28) Q. Zhan, and J. R. Leger, Opt. Expr. 10, 324 (2002).
- (29) A. E. Siegman, Lasers, Mill Valley, CA: University Science (1986)
- (30) M. Born, E. Wolf, Principle of optics, Cambridge University Press (1959)
- (31) V. Delaubert, N. Treps, C. C. Harb, P. K. Lam and H-A. Bachor, Surpassing the quantum noise limit on displacement and tilt measurement of a gaussian beam , submitted in 2005
- (32) N. Treps, N. Grosse, W. P. Bowen, M. T. L. Hsu, A. Maître, C. Fabre, H.-A. Bachor, P. K. Lam , J. Opt. B 6, S664 (2004).