Quantum spatial correlations in high-gain parametric down-conversion measured by means of a CCD camera
Abstract
We consider travelling-wave parametric down-conversion in the high-gain regime and present the experimental demonstration of the quantum character of the spatial fluctuations in the system. In addition to showing the presence of sub-shot noise fluctuations in the intensity difference, we demonstrate that the peak value of the normalized spatial correlations between signal and idler lies well above the line marking the boundary between the classical and the quantum domain. This effect is equivalent to the apparent violation of the Cauchy-Schwartz inequality, predicted by some of us years ago, which represents a spatial analogue of photon antibunching in time. Finally, we analyse numerically the transition from the quantum to the classical regime when the gain is increased and we emphasize the role of the inaccuracy in the determination of the symmetry center of the signal/idler pattern in the far-field plane.
I Introduction
Quantum noise reduction has been the subject of extensive research in the past. Although most of the experimental effort has been concentrated on the generation and applications of quadrature-squeezed light, amplitude-squeezed light and intensity correlated twin beams have also been produced. The possibility of quantum correlations between light beams has played a major role in the recent development of quantum optics. In particular the spatial aspects of correlations of quantum optical fluctuations have been the object of several studies (see for example Kolobov99 ; Lugiato99 ; Pittman96 ; Burkalov97 ; Saleh00 ; Gatti95 ) and have several new and promising applications such as quantum holography abouraddy01 , the quantum teleportation of optical images Sokolov01 , and the measurements of small displacements beyond the Rayleigh limit Treps02 . An overview of this relatively new branch of quantum optics, defined as quantum imaging, can be found in Lugiato02 .
The process of parametric down-conversion (PDC) is particularly suitable for the study of spatial effects, because of its large emission bandwidth in the spatial frequency domain Devaux00 . There is now a large literature on spatial effects in the low-gain regime, where photon pairs are detected via coincidence counting Lugiato02 . Nevertheless, to date spatial correlation measurements in this regime have not evidenced any relevant quantum effect Jost98 ; Oemrawsingh02 . On the other side, measurements performed in the medium-gain regime (pump power MW) evidenced the twin beam character of the PDC emission Aytur90 , i.e. a sub-shot-noise correlation between the photon numbers of the whole signal and idler beams. Recent theoretical investigations done for an arbitrary gain Brambilla04 ; Gatti99 have predicted multi-mode spatial correlations below shot-noise between several portions of the signal and idler emission cones that correspond to phase conjugate modes. There is a minimum size of the modes that have to be detected in order to observe a quantum correlation, which we shall refer to as the coherence area. This is determined by the conditional uncertainty in the directions of propagation of the twin photons, and is roughly given by the inverse of the near-field gain area Brambilla04 .
In this paper we present a description of the far field detection of the PDC radiation emitted by a -barium borate (BBO) non-linear crystal pumped by a low-repetition rate (2 Hz) pulsed high-power laser (1GW-1ps). The detection is performed by means of a high quantum efficiency () scientific CCD camera. In a recent letter Jedrkiewicz04 we presented measurements showing the existence of quantum spatial correlation between the signal and idler beams. The aim of this paper is, on the one side, to describe in details several features of the experiment (such as the asymmetry of the PDC beam distribution, the CCD diagnostic) which were not presented in Jedrkiewicz04 . On the other side, we shall provide a careful numerical analysis and interpretation of the experimental data, which (i) will enlighten a different aspect of the quantum noise correlation -namely an apparent violation of the Cauchy-Schwarz inequality-, and (ii) will discuss the role of the finite size of the detection pixel and of the inaccuracy in the determination of the symmetry center in the transition from the quantum to the classical regime of correlation.
The use of the pulsed high-power laser enables us to tune the PDC
to the high-gain regime while keeping a large pump beam size (of
the order of 1 mm). Thanks to the huge number of radiation
transverse modes, we can concentrate on a portion of the
parametric fluorescence close to the collinear direction and
within a narrow frequency bandwidth around degeneracy. This
portion still contains a large (1000) number of pairs of
signal/idler correlated phase-conjugate modes, propagating at
symmetrical directions with respect to the pump in order to
fulfill the phase-matching constraints. In the far field, where
the measurement is performed, the couples of modes correspond to
pairs of symmetrical spots, which can be considered as independent
and equivalent spatial replica of the same quantum system. Thanks
to the very large number of these, the statistical ensemble
averaging necessary for the quantum measurement can be solely done
over the spatial replicas for each, single,
pump-laser pulse. Thus, differently from the experiment in
Aytur90 , where the statistics was performed over different
temporal replica of the system, here no temporal averages over
successive laser shots are considered. In our experiment the
single-shot measurements reveal sub-shot-noise spatial
correlations for a PDC gain corresponding to the detection of up
to 100 photoelectrons per mode Jedrkiewicz04 . In
connection with the work of Marable02 , where the
correlation between signal/idler phase-conjugate spatial modes was
measured using a band-pass optical parametric amplifier, a
transition from the quantum to the classical regime with
increasing gain was observed. Here we observe a similar
transition, which is attributed to two main effects, one being the
narrowing of the near-field gain profile that occurs at very high
gain in presence of a bell-shaped pump beam. In fact this gain
narrowing effect implies a broadening of the far-field coherence
area, whose transverse size is measured experimentally from the
width of the spatial intensity correlation function evaluated
between the symmetrical signal and idler regions under
consideration. The other effect is the unavoidable inaccuracy in
the experimental determination of the symmetry center of the
signal/idler pattern in the detection plane, and the role of the
CCD pixel size in relation to the coherence area dimension of the
radiation. Our experimental results are in accordance with the
predictions of a 3D quantum model used to describe the
experimental system Brambilla04 .
The paper is organized as follows. In section 2 we present the
characteristics of the far field PDC radiation in the pumping
conditions of the experiment, by illustrating the features of the
signal and idler beams detected by the CCD camera at degeneracy.
In section 3 we carefully describe the experimental set-up used
for the spatial correlation measurements and illustrate the
typical single-shot images recorded by the CCD for the evaluation
of the correlation, and in section 4 we present the experimental
results. Our attention is focused on the analysis of the spatial
correlation between signal and idler, to show that the height of
the correlation peak demonstrates the quantum nature of spatial
correlation and implies the apparent violation of a
Cauchy-Schwartz inequality, i.e. a spatial analogue of photon
antibunching in time, as predicted in Gatti99 ; Marzoli97 ; Lugiato97 ; Szwaj00 . The numerical simulations showing the
expected transition from the quantum to the classical regime for
increasing gain are presented in section 5, where we also
highlight the important role of the resolution cell size of the
CCD camera (pixel size) and thus, as mentioned above, of the
inaccuracy in the experimental determination of the center of
symmetry of the signal and idler image recorded in the far-field
plane. The conclusions are given in section 6.
II Detection of the spatial features of the far-field PDC radiation by means of the CCD
Before the quantitative investigation of the existence of spatial correlations between signal and idler beams, we perform a preliminary characterization of the generated parametric radiation. The type II 5x7x4mm3 BBO non-linear crystal, operated in the regime of parametric amplification of the vacuum-state fluctuations, is pumped by the third harmonic (352 nm) of a 1ps pulse from a chirped-pulse amplified Nd:glass laser (TWINKLE, Light Conversion Ltd.). The input and output facets of the crystal are anti-reflection coated at 352 nm and 704 nm, respectively. The pump beam (vertically polarized (e)) is spatially filtered and collimated to a beam waist characterized by a full width at half maximum (FWHM) of approximately 1 mm at the crystal input facet, although the fluorescence characterization has also been performed for smaller beam sizes. The energy of the 352 nm pump pulse can be continuously tuned in the range 0.1-0.4 mJ by means of suitable attenuating filters and by changing the energy of the 1055nm pump laser pulse, allowing to have a gain (representing the intensity amplification factor) in the range . The parametric fluorescence of the horizontally polarized signal (o) and vertically polarized (e) idler modes is emitted over two cones, whose apertures depend on the specific wavelengths (see, e.g., Berzanskis99 ; Rubin96 ). The BBO crystal (, ) is oriented in order to generate signal and idler radiation cones tangent to the collinear direction at the degenerate wavelength (s, i and p referring to signal, idler and pump respectively).
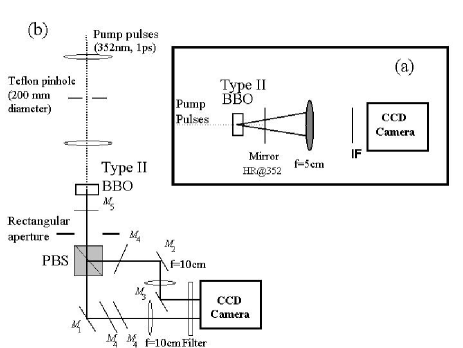
A simple far-field detection set-up is initially mounted as shown in Fig. 1(a). A deep-depletion back illuminated charged coupled device (CCD) camera Janesick01 (Roper Scientific, NTE/CCD-400EHRBG1, with quantum efficiency at 704 nm) triggered by a pulse from the laser system, is placed in the focal plane of a single large-diameter lens (f=5 cm), which collects at a distance f the far-field PDC radiation emitted by the BBO. The CCD detection array has 1340 x 400 pixels, with a pixel size of 20m x 20m. The pump-frequency contribution is removed by using a normal incidence high-reflectivity (HR) mirror coated for 352 nm placed after the BBO. By using a 10-nm broad interferential filter (IF), centered at 704 nm, we are able to visualize the degenerate signal and idler far-field beams emitted in the parametric process. It is worth pointing out that without any spectral filtering, emission occurs on a very wide range of wavelengths and emission angles (see, e.g. Berzanskis99 ; Rubin96 ). Typical far-field images recorded at degeneracy in a single shot (for 1ps pump pulse) are shown in Fig. 2(a) and Fig. 2(b) for two different values of the pump intensity and, in the particular cases illustrated, for two different pump beam sizes. The ring-shaped angular distribution is determined by the phase-matching conditions Berzanskis99 , and the rings at degeneracy are characterized by an angular width of about 8∘ each. Note that with this set-up the two rings, which are emitted along the vertical direction, are recorded by rotating the CCD by 90∘ in order to fit the entire ring pattern inside the rectangular chip.
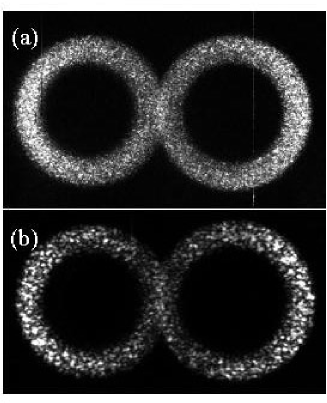
We draw now the attention on the speckle-pattern aspects of these images, observing that the dimensions of the speckles or spots (corresponding to the transverse modes in the far field) considerably change as a function of the pump beam waist and in general of the pump beam intensity, and therefore as a function of the gain. The enlargement of the coherence area of the PDC radiation in the far field for increasing gain is evident from Fig. 2 and is confirmed by the theory and the numerical calculations. This effect, which will be extensively analyzed in the following in sections 5 and 6, turns out to be very important for the interpretation of the experimental results of the correlation measurements.
A closer inspection of Fig. 2 reveals that the photon distribution on the rings is asymmetrical: there are more photons along the outer edges of the rings than in the collinear region where the rings overlap. Moreover, this asymmetry seems to become stronger in Fig. 2(b) which has a narrower pump waist than Fig. 2(a). An explanation of this phenomenon could be found by considering that for a small pump waist hot spots may appear in the emission spectrum of PDC. This is due to an additional phase-matching condition appearing when the Gaussian shape of the pump is taken into account Koch ; while always present when the pump field is Gaussian, it only becomes relevant when the pump waist is quite small. Instead, for larger pump waists the usual phase-matching conditions dominate. The hot spots are predicted to occur along the walk-off direction (in our case in the direction in the reference frame of Fig. 2) while perpendicular to the walk-off direction less photons should appear. To investigate if the hot spot phenomenon could explain the observed asymmetry we present in Fig. 3(a)-(b) numerical simulations for the same parameters as in Fig. 2 (for details on the numerics, see Ref. Brambilla04 and section 5). Despite the hot spot centers being predicted to be located close to the region where phase matching occurs, no asymmetry in the photon distribution is observed in Fig. 3(a)-(b). In order to see hot spots we had to reduce the pump waist further, as shown in Fig. 3(c): now hot spots along the walk off direction are evident. Figure 3(d) shows the signal and idler fields plotted separately after averaging over 20 pump pulses, and a weak asymmetry between the central (collinear) region and the edges of the circles is seen.

The numerics suggest that the hot spot phenomenon does occur and that it might lead to an asymmetry in the photon distribution. However, the pump waist needed to observe this is almost an order of magnitude lower than that used in the experiment. Therefore we checked if imperfections in the pump beam reduce the effective waist, thus provoking the hot spot effect: simulations including a Gauss-Hermite pump shape with an overall large pump waist but with smaller spikes in the profile showed that hot spots could occur for larger pump waists than those found from a pure Gaussian beam. Thus a clean pump seems vital as to avoid hot spots from occurring, in particular considering that in the crystal Kerr nonlinear effects would amplify any spikes in the pump profile (an effect we have not accounted for in the numerics). In other words small-scale focusing of the pump (i.e. filamentation) might occur or at least be initiated in the crystal due to input-beam imperfections and Kerr nonlinear response. This might cause the spectrum to behave as if the actual pump-beam size is smaller than its FWHM diameter. Nonetheless, we do not believe that hot spots alone can explain the observed asymmetry. One alternative explanation might be that absorption in the crystal is saturating the collinear direction of phase-matching as shown for a type I optical parametric amplifier by Dou et al. Dou . However, this seems an unlikely explanation because the BBO crystal has a very low absorption, and also Ref. Dou reports that the saturation occurs for much longer crystals than our. Preliminary numerical simulations that take into account such a loss also did not show any qualitative difference with respect to the data shown in Fig. 3, while it remains to be investigated if nonlinear absorption could lead to more dramatic effects. We are also suspecting that the interference filter is creating some unwanted attenuation of the collinear direction, or distortion effects, and we are currently investigating this in further detail.
III Experimental set-up for spatial correlation measurements
The existence of spatial correlation already appears from the symmetrical properties of the signal and idler patterns recorded experimentally and shown in Fig. 2. However, to investigate and reveal the quantum character of the correlation we use the experimental set-up illustrated in Fig. 1(b) where, with respect to Fig. 1(a), a different diagnostics configuration is adopted. We consider a pump beam size of 1mm and we now select the fluorescence around the collinear direction by means of a 5mm x 8mm aperture placed 15 cm from the output facet of the BBO. The radiation is then transmitted through a polarizing beam splitter (PBS) that separates the signal and idler beams. The aperture prevents beam clipping by the PBS and thereby reduces substantially scattered radiation. The beams are finally sent onto two separate regions of the high efficiency CCD, which is placed in the common focal plane of the two lenses (f=10 cm) used to image the signal and idler far fields. In contrast to the case of photon-counting experiments (which rely on coincidence measurements), and also differently from what was done for the preliminary characterization of the fluorescence, in this set-up the correlation measurements are performed without using any narrow-band IFs, since these unavoidably introduce relevant transmission losses reducing the visibility of sub-shot-noise correlations, and could also introduce distortion or even attenuation effects that, as commented in section 2, are still unclear. Here the pump-frequency contribution is removed by using normal incidence () and at 45∘ () high-reflectivity (HR) mirrors coated for 352 nm placed before and after the PBS, respectively, and a low-band pass colour filter (90% transmission around 704 nm) placed in front of the CCD. Note that a second PBS (not shown in the figure) is placed in the arm of the (e) idler beam to remove the residual contribution of ordinary (o) radiation reflected by the first PBS (), and a further HR@352 nm mirror () is placed in the signal arm at a suitable angle in order to balance the unequal transmission of radiation in the two arms. All the optical components (except the colour filter) have anti-reflection coatings at 704 nm. The estimated quantum efficiency of each detection line, which accounts for both the transmission losses and the detector efficiency, is 75%.
It is worth pointing out that prior to the experiment for the detection of quantum spatial correlations, we performed a test of the capabilities of the scientific CCD camera to perform spatially resolved measurements of photon shot-noise. The CCD used for the diagnostic has in fact been calibrated pixel by pixel to compensate for the gain inhomogeneity of the pixels on the CCD chip, allowing the retrieval of Poissonian statistics of the spatial fluctuations of an uniform enlightening in the full range of the camera dynamics Jiang03 . The procedure works efficiently for thermal as well as for laser sources, provided that the wavelength and the coherence properties of the source are chosen in order to avoid the formation of equal thickness fringes in the chip (etaloning effect). Calibration has also allowed the comparison at the shot-noise level of images recorded at different places on the chip. At that stage, before the realization of this quantum correlation experiment, retrieving the shot-noise in the CCD full dynamic range using classical sources certainly paved the way to spatially resolved photon noise measurements at the sub-shot-noise level, and turned out to be a necessary step to demonstrate quantum properties of images by means of CCD diagnostic.
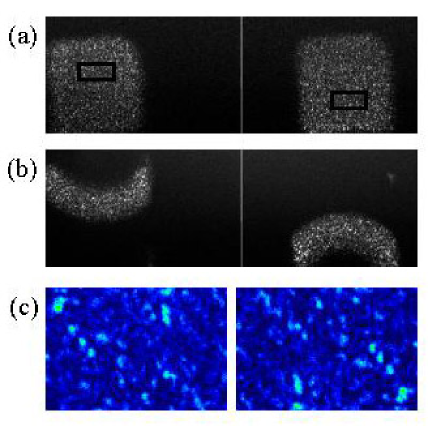
Fig. 4(a) shows a typical far-field image recorded in a single shot in the experimental configuration of Fig. 1(b), where a fairly broadband radiation (i.e., the one transmitted by the rectangular aperture) is acquired in the signal (left) and idler (right) branches. The selection of the desired temporal and angular bandwidth around degeneracy is made by temporarily inserting in front of the CCD a 10-nm wide IF around 704 nm, allowing us to locate the collinear degeneracy point (see Fig. 4(b)). The data analysis is limited within two rectangular boxes (black frames in Fig.4(a)) corresponding to an angular bandwidth of 20 mrad x 8 mrad and to a temporal bandwidth smaller than 10 nm. The selected regions contain 4000 pixels each. Since the aim of this work is to investigate pixel-pair correlation, and since the size of the CCD pixel approximately corresponds to the physical size of a replica (coherence area), the ensemble is large enough to perform the desired statistics. A zoom of the selected areas is presented in Fig.4(c), where the rather spectacular symmetry of the intensity distribution in the signal and idler branches shows the twin-beam character of the phase-conjugate modes.
IV Detection of quantum spatial correlation: Spatial analogue of photon antibunching in time
Each of the signal and idler far-field pattern taken separately, looks like a speckle pattern produced by a pseudo-thermal source, such as for instance a ground glass illuminated by a laser beam. When this thermal light is splitted by a macroscopic device as a beam-splitter, the two resulting beams show a high level of spatial correlation, which is however limited by shot-noise Magatti04 ; Gatti04a ; Gatti04b . The spatial correlation of the signal and idler beams generated by PDC is instead of microscopic origin, and is not limited by shot-noise. The aim of this experiment is to show the sub-shot-noise nature of the spatial correlation of the PDC beams. We are first interested in the symmetrical pixel-pair correlation, which is evaluated experimentally by measuring the variance of the PDC photoelectrons (pe) difference of the signal/idler pixel-pair versus the mean total number of down-converted pe of the pixel-pair. This variance is
| (1) |
where the averages are spatial averages performed over all the
symmetrical pixel-pairs contained in the chosen regions. Each
single shot of the laser provides a different ensemble,
characterized by its pixel-pair average pe number , in turn related to the parametric gain. In
the experiment, ensembles corresponding to different gains are
obtained by varying the pump-pulse energy. We note that the
read-out noise of the detector, its dark current, and some
unavoidable light scattered from the pump, signal and idler fields
contribute with a non-negligible background noise to the process.
This is taken into account by applying a standard correction
procedure (see for example Mosset04 ), by subtracting the
background fluctuations from the
effectively measured variance
of the total intensity difference
(signal+background)-(idler+background) obtaining
.
This background noise, having a standard deviation of 7 counts
( from shot to shot, estimated by repeating the
measurement with the same pump-pulse energy) is measured in
presence of pulse illumination over an area of the same size of
the acquisition area and suitably displaced from the directly
illuminated region. The validity of the data correction procedure
and the shot-noise level (SNL) calibration are made by sending in
the set-up (with no crystal) through the PBS, a coherent pulsed
beam (@704nm) linearly polarized at : we have
verified, for different laser energies, that the intensity
difference fluctuations from the two coherent portions of beams
recorded on the CCD lie at the SNL only if this background noise
is taken into account and subtracted from the rough data acquired.
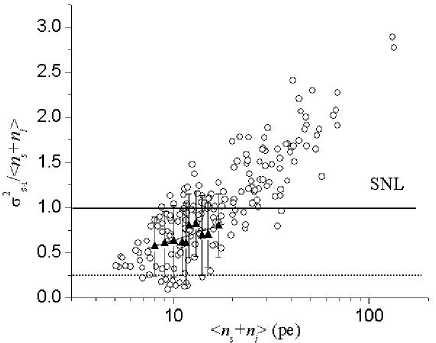
Fig.5 shows the experimental results where each point is
associated with a different laser shot. The data are normalized to
the shot-noise level, and their statistical spread accounts for
the background correction. Although the noise on the individual
signal and idler beams is found to be very high and much greater
than their SNL (= and respectively), we observe an evident sub-shot-noise
pixel pair correlation up to gains characterized by . Since in that regime the
observed transverse size of the coherence areas (i.e. of
the modes) is about 2-4 pixels, this approximately corresponds to
100 pe per mode. The maximum level of noise reduction observed
experimentally agrees with the theoretical limit (dotted line in
Fig. 5) determined by the total losses of the system
( Brambilla04 ).
We can have an idea of the transverse size of the mode by looking at the standard two-dimensional cross-correlation degree
| (2) |
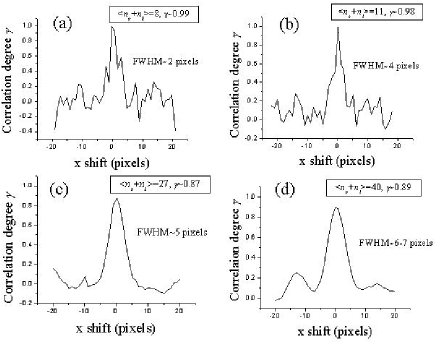
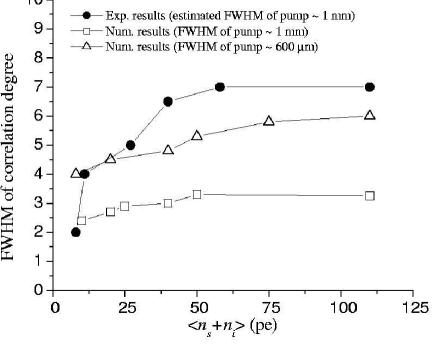
between all the angularly symmetrical signal and idler pixels contained within the black boxes (see Fig. 4). This can be plotted for instance as a function of the horizontal and vertical shifts of the recorded image on the CCD, keeping fixed the position of the boxes. In general with for perfect correlation. The transverse section of the correlation function plotted as a function of the horizontal shift (in pixel units) and obtained from four single-shot images corresponding to different gains is presented in Fig.6(a)-(d). We can notice how the FWHM of the curves increases for increasing gain, clearly reflecting the increment of the speckles size (and thus of the transverse mode size) already observed in Fig.2. For instance the graph obtained from a single-shot image characterized by (see Fig.6(a)) reveals a transverse mode size of about 2 pixels, while in the last case plotted in the figure where the FWHM of the correlation function reaches a dimension of almost 7 pixels. As expected, virtually perfect correlation (in our case we have peak values of up to ) is obtained for perfect determination (i.e. within one pixel) of the center of symmetry between the signal and the idler regions. Fig.7 illustrates the trend (as a function of the gain) of the coherence area transverse size evaluated from the FWHM of the correlation degree profiles. The experimental results (here associated with six images, the same as in Fig.6 with in addition two recorded for higher gains) are compared with numerical data calculated for two different pump size conditions.
Although the qualitative trend between experiment and numerics is in good agreement, we observe a quantitative discrepancy between the experimental and numerical data values. This discrepancy is attributed either to an overestimation of the pump beam size in the laboratory (measured at a different time from the data acquisition period -e.g. one month before-, and possibly measured for different conditions of the laser source, which is very sensitive to laboratory temperature fluctuations and very sensitive to the laser regenerative amplifier misalignment); or to a suspected narrowing of the third-harmonic pump profile for very high gains that could occur as a consequence of the nonlinear generation process, since the pump energy increase is performed by increasing in fact the fundamental laser pulse energy. This is a point which is currently under further investigation and new pump beam characterizations are going to be performed.
It is interesting to note that the quantum nature of the correlation can also be estimated from the peak value of the correlation degree. As a matter of fact, since
| (3) |
the sub-shot noise condition for the intensity difference variance
| (4) |
can be rephrased in the form
| (5) |
if we use (2) and assume that
| (6) |
as also confirmed experimentally within a good approximation. We can rewrite (5) further by taking into account that, as is well known, the signal and idler beams taken alone display a thermal-like statistics. Therefore, Goodman00 , where is the degeneracy factor representing the number of spatial and temporal modes intercepted by the pixel detectors. In the condition of the experiment the pump duration is slightly longer than the PDC coherence time while the pixel area is smaller than the coherence area, so that is expected to be only slightly larger than unity Mosset04 . Using this, (5) becomes
| (7) |
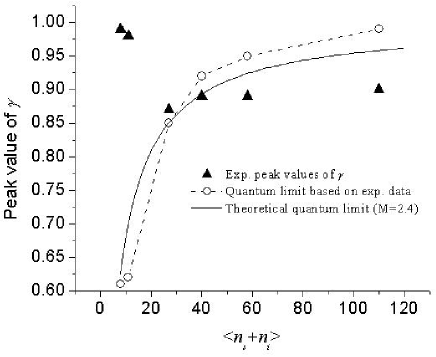
Fig.8 illustrates the trend of the peak values of for different gains (black triangles), extracted from the same images used for Fig.7. The dashed-dotted curve corresponds to the quantum standard limit obtained by interpolation of the function , calculated for different gains using the values for the mean and variance obtained from the experimental far-field patterns considered. The full line is the theoretical limit obtained from (7) by using as a fitting parameter. We thus observe a spatial quantum correlation whenever the value of lies in the region above the theoretical quantum limit. This limit becomes stronger (e.g more demanding) as the gain increases. The experimental correlation values obtained are, as expected, compatible with the trend of the data plotted in Fig.5, and highlight a quantum correlation region up to values of of about 20 pe (also corresponding to at least 100 pe per mode). For instance the first three triangles on the left correspond to three images characterized by an intensity difference variance that is clearly below the SNL in Fig.5, while the other three triangles correspond to images that are characterized by an intensity difference variance above the SNL. Similarly to the case of the points plotted in Fig.5, the background noise correction leads to a statistical spread of the measured data also for the correlation degree. In relation to this comment we mention then that the experimental points (black triangles) represented in Fig.8 have been extracted from images characterized, for a given gain, by the highest correlation found.
Finally we note that if we multiply (5) by , with the help of (2) and (6) we obtain
| (8) |
i.e., by defining
| (9) |
and
| (10) |
where the symbol : : indicates the normal ordering, we find the following inequality condition
| (11) |
equivalent to the sub-shot-noise level condition (5), and which states that the cross-correlation between signal and idler is larger than the (normally ordered) self-correlation. This corresponds to an apparent violation of the Cauchy-Schwartz inequality. This effect, which was predicted in Marzoli97 ; Lugiato97 ; Szwaj00 for the case of the optical parametric oscillator and then generalized Gatti99 to the case of the travelling-wave optical parametric amplifier, represents a spatial analogue of the phenomenon of photon antibunching in time.
V Transition from quantum to classical regime: numerical results
In order to interpret the observed transition from quantum to classical regime in Fig. 5, we present in Fig. 9 the results of the numerical calculations. The full quantum model accounts for the two transverse and the temporal degrees of freedom with propagation along the crystal, for the angular and chromatic material dispersion up to the second order, for the finite spatial and temporal widths of the Gaussian pump pulse, and for the experimental quantum efficiency . It has been important to investigate how these features affect the spatial quantum correlation phenomena initially predicted by the plane wave pump theory, also to identify the conditions under which they can be observed in the experiment. The quantum description of the PDC is performed by treating the pump as a known classical field which propagates linearly inside the crystal, while the down-converted fields are quantized. The quantum averages needed in the calculations are evaluated through a stochastic method based on Wigner representation, as described in Brambilla04 .
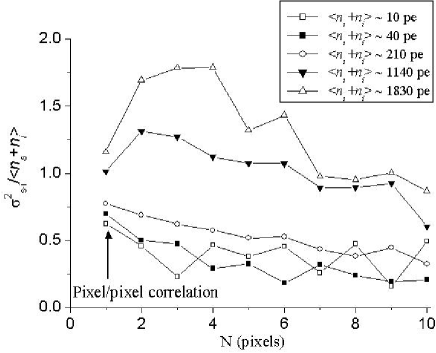
Fig. 9 presents , normalized to the SNL, vs. the size of the detection area for different gains. Each point is the result of a statistics performed over one single laser-shot. The case N=1 corresponds to the experiment. The simulations (data not shown) outline that, in spite of the fixed pump-beam diameter, the signal and idler beam diameters at the crystal output strongly depend on the gain and decrease when the latter increases. This can be easily interpreted when considering that the signal and idler beam size maps not the pump-beam profile but the actual parametric amplification gain profile Akhmanov (L being the crystal length, A the pump field amplitude and a parameter proportional to the setting characteristics), as long as filtering due to the limited spatial bandwidth does not take place Ditrapani98 . On narrowing the size of the PDC beams, the coherence areas in the far field (i.e. the modes) increase their size, as straightforward consequence of the convolution theorem in Fourier analysis Berzanskis99 . This is precisely the effect observed experimentally and revealed either directly by looking at the far-field patterns recorded by the CCD, or by analyzing the correlation degree function profile as discussed in section 4. Since revealing quantum correlations requires detection areas larger (or comparable) to the mode size (as also discussed in Brambilla04 ), it is necessary when increasing the gain to have larger detectors in order to obtain sub-shot-noise variance as shown in Fig. 9. Note that Fig. 9 evidences the transition from quantum to classical regime in case of single-pixel detection (N=1) for a gain that is higher than in the experiment. Indeed, in the experiment, excess noise is observed already for 20, which we attribute first to the effect of residual scattered light whose contribution grows linearly with the radiation fluence and is thus expected to overcome the shot noise at large pumping, and second to the uncertainty in the determination of the symmetry center of the signal and idler image portions.
In fact although the increase of the coherence area with the gain leads to a deterioration of the signal-idler correlation, numerical calculations have shown that this phenomenon alone is not sufficient to explain the steepness of the slope given by the ratio as a function of the shot-noise displayed in the plot of Fig. 5. As we shall now show, another important feature which contributes to this behaviour is related to the inaccuracy in the determination of the center of symmetry of the far-field pattern in the detection plane. In our experiment the typical error between the selected and the actual center of symmetry is on the order of half the size of the pixels of the CCD, that is about 10 m. can therefore be a significant fraction of the far-field coherence length, (transverse size of the spatial mode), depending on the gain values considered in the experiment (here is typically on the order of 50 m). We are therefore in an intermediate situation between the ideal condition where – for which the theory predicts sub-shot noise correlation – and the opposite limit in which the selected pixel pairs used to perform the statistics are completely uncorrelated. In this latter case the variance of is simply the sum of the variance of and (since ), that is . As mentioned before, since the signal and idler beams taken alone display thermal statistics, , having assumed . The saturation value of in the limit is therefore given by .
The general behaviour for arbitrary values of the parameter is illustrated in Fig. 10, where is obtained from numerical simulations by varying in the -axis (walk-off) direction for different gain values. As becomes larger than the data saturate, and from these saturation values we estimate the degeneracy factor by comparing them to the predicted values . This value is quite close to the one estimated experimentally () in the previous section. From the behaviour of these curves it can be inferred that the transition from sub-shot-noise to above-shot-noise correlations occurs approximately when exceeds a critical value .
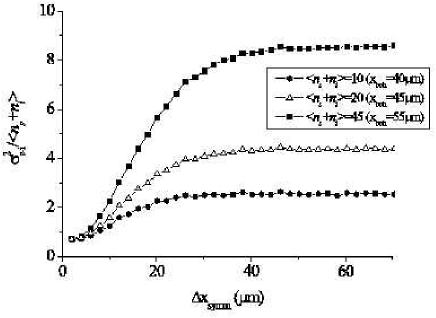
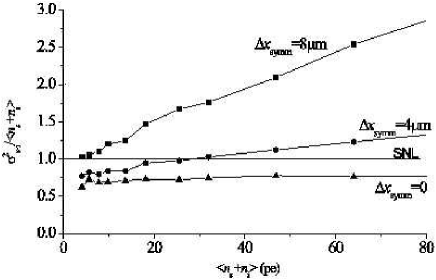
It also follows from Fig. 10 that increases almost linearly with with a slope which is on the order of . The plot of Fig. 11 confirms this result, showing how rapidly the sub-shot-noise correlation is lost as becomes a significant fraction of . We note that in the range of considered in those simulations (which are those of the experiment) the effect of the broadening of the coherence area due to the increasing gain is negligible (see also the numerical resuls of Fig. 9 in the case N=1), as can be seen from the curve which is almost horizontal. For high values of the gain, the inaccuracy in the determination of the symmetry center becomes therefore particularly relevant and its contribution to the loss of correlation is expected to exceed the contribution due to broadening of the coherence area. Other contributions not included in the numerical model, such as light scattering from the environment, becomes also important as the number of PDC photons increases.
VI Conclusions
In conclusion, we have presented experimental and numerical
results demonstrating the quantum spatial features of the
radiation generated in parametric-down-conversion in the high-gain
regime and measured by means of a scientific CCD camera. We have
first illustrated the speckle-like patterns of the fluorescence
detected in particular at degeneracy, pointing out the effect of
coherence area enlargement for increasing gain. The experimental
investigation of the quantum aspects of the intensity correlations
between signal and idler leads to the conclusion that twin beams
of light generated in PDC exhibit sub-shot-noise spatial
correlation. This has been shown by measuring in the far-field an
evident quantum noise reduction on the signal/idler intensity
difference, and by having high peak correlation degree values
lying above the standard quantum limit. The latter phenomenon
corresponds to an apparent violation of the Cauchy-Schwartz
inequality, i.e. to the spatial analogue of photon antibunching in
time, which was predicted in Gatti99 ; Marzoli97 ; Lugiato97 ; Szwaj00 . A transition to above shot-noise correlation is observed
as the gain increases. The theory and numerical simulations show
how a quantum-to-classical transition is expected to occur because
of a narrowing of the signal/idler beams with increased gain. This
leads in turn to a larger far-field mode size and therefore also
to the need of larger pixels to observe sub-shot-noise correlation
Brambilla04 . However numerical calculations have also shown
that this phenomenon alone is not sufficient to explain the
steepness of the slope of the transition observed experimentally.
In addition to the effect of residual scattered light, whose
contribution grows linearly with the radiation fluence and is thus
expected to overcome the shot noise at large pumping, an important
feature contributing to this behavior is found to be related to
the inaccuracy in the determination of the center of symmetry of
the signal/idler recorded pattern in the far-field plane. The
importance of the results presented in this work lies in the fact
that this is the first experimental investigation of quantum
spatial correlations in the high gain regime, where the huge
number of transverse spatial modes is detected in single shot by
means of a high-quantum-efficiency CCD.
Acknowledgements
This work was supported by projects FET QUANTIM ”Quantum imaging”, PRIN of MIUR ”Novel devices based on quantum entanglement”, FIRB01 ”Space-time phenomena in nonlinear optics”, INTAS 2001-2097. M.B. acknowledges support from the Carlsberg Foundation. We thank Yunkun Jiang for useful discussions and many helpful advices.
References
- (1) M. I Kolobov, Rev. Mod. Phys. 71, 1539 (1999), and references therein.
- (2) L. A. Lugiato, M. Brambilla, and A. Gatti, Adv. At., Mol., Opt. Phys. 40, 229 (1999).
- (3) T. B. Pittman, D. V. Strekalov, D. N. Klyshko, S. P. Kulik, A. N. Penin, and Y. H. Shih, Phys. Rev. A 53, 2804 (1996).
- (4) A. V. Burkalov, M. V. Chekhova, D. N. Klyshko, S. P. Kulik, A. N. Penin, Y. H. Shih, and D. V. Strekalov, Phys. Rev. A 56, 3214 (1997).
- (5) B. E. A. Saleh, A. F. Abouraddy, A. V. Sergienko, and M. C. Teich, Phys. Rev. A 62, 043816 (2000); A. F. Abouraddy, M. B. Nasr, B. E. A. Saleh, A. V. Sergienko, and M. V. Teich, Phys. Rev. A 63, 063803 (2001); A. F. Abouraddy, B. E. A. Saleh, A. V. Sergienko, and M. C. Teich, J. Opt. Soc. Am. B 19, 1174 (2002).
- (6) A. Gatti and L. Lugiato, Phys. Rev. A 52, 1675 (1995).
- (7) A. F. Abouraddy, B. E. A. Saleh, A. V. Sergienko, and M. C. Teich, Opt. Express 9, 498 (2001).
- (8) I. V. Sokolov, M. I. Kolobov, A. Gatti, and L. A. Lugiato, Opt. Commun. 193, 175 (2001).
- (9) N. Treps et al., Phys. Rev. Lett. 88, 203601 (2002).
- (10) L. A. Lugiato, A. Gatti, and E. Brambilla, J. Opt. B: Quant. Semiclass. Opt. 4, S176 (2002), and references therein.
- (11) F. Devaux and E. Lantz, Eur. Phys. J. D 8, 117 (2000).
- (12) B. M. Jost, A. V. Sergienko, A. F. Abouraddy, B. E. A. Saleh, and M. C. Teich, Opt. Express 81, 3 (1998).
- (13) S. S. R. Oemrawsingh, W. J. van Drunen, E. R. Eliel, and J. P. Woerdman, J. Opt. Soc. Am. B 19, 2391 (2002).
- (14) O. Aytur and P. Kumar, Phys. Rev. Lett. 65, 1551 (1990).
- (15) E. Brambilla, A. Gatti, M. Bache, and L. A. Lugiato, Phys. Rev. A 69, 023802 (2004).
- (16) A. Gatti, E. Brambilla, L. A. Lugiato, and M. I. Kolobov, Phys. Rev. Lett. 83, 1763 (1999); E. Brambilla, A. Gatti, L. A. Lugiato, and M. I. Kolobov, Eur. Phys. J. D 15, 117 (2001).
- (17) O. Jedrkiewicz, Y.-K. Jiang, E. Brambilla, A. Gatti, M. Bache, L. A. Lugiato, and P. Di Trapani, Phys. Rev. Lett. 93, 243601 (2004).
- (18) M. L. Marable, S.-K. Choi, and P. Kumar, Opt. Express 2, 84 (1998).
- (19) I. Marzoli, A. Gatti, and L. A. Lugiato, Phys. Rev. Lett. 78, 2092 (1997).
- (20) L. A. Lugiato, A. Gatti, H. Ritsch, I. Marzoli, and G.-L. Oppo, J. Mod. Opt. 44, 1899 (1997).
- (21) C. Szwaj, G.-L. Oppo, A. Gatti, and L. A. Lugiato, Eur. Phys. J. D 10, 433 (2000).
- (22) A. Berzanskis, W. Chinaglia, L. A. Lugiato, K.-H. Feller, and P. Di Trapani, Phys. Rev. A 60, 1626 (1999).
- (23) M. H. Rubin, Phys. Rev. A 54, 5349 (1996).
- (24) J.R. Janesick, Scientific Charge-Coupled Devices (SPIE Press Bellingham, Washington, 2001), pp. 204-205; see also http://www.roperscientific.de/theory.html.
- (25) Y.-K. Jiang, O. Jedrkiewicz, S. Minardi, P. Di Trapani, A. Mosset, E. Lantz, and F. Devaux, Eur. Phys. J. D 22, 521 (2003).
- (26) K. Koch, E. Cheung, G. T. Moore, S. H. Chakmakjian, and J. M. Liu, IEEE J. Quant. Electron. 31, 769 (1995).
- (27) S. X. Dou, D. Josse, and J. Zyss, J. Opt. Soc. Am. B 9, 1312 (1992).
- (28) D. Magatti, F. Ferri, A. Gatti, M. Bache, E. Brambilla, and L.A. Lugiato, preprint quant-ph/0408021.
- (29) A. Gatti, E. Brambilla, M. Bache and L.A. Lugiato, Phys. Rev. Lett. 93, 093602 (2004).
- (30) A. Gatti, E. Brambilla, M. Bache and L.A. Lugiato, Phys. Rev. A 70, 013802 (2004).
- (31) A. Mosset, F. Devaux, G. Fanjoux, and E. Lantz, Eur. Phys. J. D 28, 447 (2004).
- (32) J.W. Goodman, Statistical Optics (Wiley Classics Library, New York, 2000).
- (33) S. A. Akhmanov, V. A. Vysloukh, A. S. Chirkin, Optics of Femtosecond Laser Pulses (American Institute of Physics, New York, 1992), p.151.
- (34) P. Di Trapani, G. Valiulis, W. Chinaglia and A. Andreoni, Phys. Rev. Lett. 80, 265 (1998).