Demonstration of the spatial separation of the entangled quantum side–bands of an optical field
Abstract
Quantum optics experiments on “bright” beams typically probe correlations between side-band modes. However the extra degree of freedom represented by this dual mode picture is generally ignored. We demonstrate the experimental operation of a device which can be used to separate the quantum side-bands of an optical field. We use this device to explicitly demonstrate the quantum entanglement between the side-bands of a squeezed beam.
pacs:
03.67.Mn, 42.50.LcEarly on in the discussion of squeezed light it was realized that a single mode description is often not adequate. The spectral structure of squeezed light with its frequency side-bands is essential when analyzing specific Fourier components of the field fluctuations Caves82 ; Unruh83 ; Caves85 ; Yurke85 . From a theoretical point of view it became clear that the two side-bands of a squeezed beam carry quantum correlated noise Gea87 ; Caves82 ; Caves85 . Later it was realized that squeezing across two distinct spatial modes led to entanglement and tests of the Einstein Podolsky Rosen (EPR) Gedankenexperiment using such two mode squeezed light were proposed Graham84 ; Reid89 and demonstrated Kimble92 ; zhang00EPR ; Silberhorn01 . Since then EPR entanglement has been recognized as a basic resource of continuous variable quantum information protocols cvbook . Two mode squeezing involves pair-wise correlations between the four frequency side-band modes of the two beams. Recently it has been suggested that the spectral side-band correlations of single mode squeezed light can be transferred to entanglement between two spatial modes hunt02 ; zhang03 . The entanglement thus produced would be of a quite different character to that produced by two mode squeezing as it would involve a pair wise correlation between only a single side-band on each of the beams.
In this letter we demonstrate experimentally for the first time the production of this new type of entangled light by separating the quantum side-bands of a single spatial mode into two separate spatial beams. We first demonstrate the basic effect using continuous wave coherent states (experiment type A) and then demonstrate entanglement production from pulsed squeezed light (experiment type B). As well as the fundamental interest of demonstrating this paradigm of quantum optics explicitly, the techniques described here represent a new tool in the analysis and manipulation of quantum optical fields hunt04 ; merolla and produce entanglement useful for quantum information applications. Note that the ability to detect a single side-band may also open new possibilities for astronomy Townes .
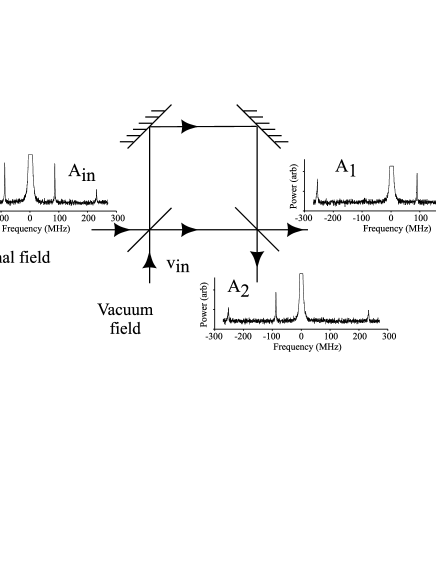
Fig. 1 illustrates our experimental set-up. This figure also shows sketches of input and output frequency spectra indicating the desired operation of the system. The system is essentially a Mach-Zehnder interferometer whereby the path length for one of the interferometer arms is much greater than for the other, thus introducing a time delay between the two arms of . Previously such unbalanced Mach-Zehnder interferometers (UMZI) have been used in quantum optics experiments to filter spurious longitudinal lasing modes yam? and measure the phase quadrature of bright pulsed beams glockl . Here we pick the path length difference such that the quantum side-bands at a particular radio frequency are decomposed into separate spatial beams.
All of the beamsplitters in the UMZI are assumed transmitting. In the Heisenberg picture, time varying fields are written in the rotating frame as and where the steady-state coherent amplitude of the field is given by and the time-varying component of the field is given by the operator . In Fourier transform space, we may define operators for the quadrature amplitude and phase fluctuations of a field as and respectively. The absence of hats indicates the Fourier transform. Additionally we have made use of the relation that to find the relevant creation operators in the frequency domain glauber . The spectral variances of all fields are found from .
The annihilation operators for the UMZI inputs (outputs) at a Fourier frequency relative to the carrier are denoted and ( and ) - see Fig. 1. The outputs of the UMZI are given in terms of the inputs as
| (1) | |||||
| (2) | |||||
where is the phase shift acquired by a field at the carrier frequency . Let us focus on the specific frequency such that . Choosing , the outputs of the UMZI are
For the terms are interchanged.
Hence we find that the positive and negative frequency components of the input field can be separated into spatially distinct beams. If the UMZI is locked to the upper and lower side-bands will exit from the opposite ports. This behaviour has been confirmed experimentally and is indicated in Fig 1. The spectra illustrating successful operation at the classical level are the results of measurements of a continuous wave Nd:YAG laser (Innolight Mephisto 500) with MHz phase modulation side-bands sent as an input to the UMZI (experiment type A). The UMZI had a path length difference of m and fringe visibility of . The DC power at output was used to lock the interferometer. Spectral measurements of the field were made for and for . The second of these is shown on the output to illustrate schematically the desired operation of the device. The spatial separation of the upper and lower side-bands is clearly visible.
We now turn to non-classical effects. The power spectrum of the input fluctuations is given by
| (3) | |||||
The final unit component in the sum is the vacuum noise. Using the transfer relations for the UMZI () we find for the output fluctuations of the first beam
| (4) |
where expectation values such as , and are all zero. is similar to Eq.4 with replaced by . Thus we expect only the power of the upper side-band to appear at the first output and only that of the lower side-band to appear at the second. Also we expect the spectra to be independent of the local oscillator phase when probing the side–bands with a homodyne detector. If the input state is symmetric (same power in the upper and lower side–bands) then the variances of the amplitude and phase quadratures of both outputs of the UMZI when locked to either would be (normalized to quantum noise limit, QNL, of one output)
| (5) |
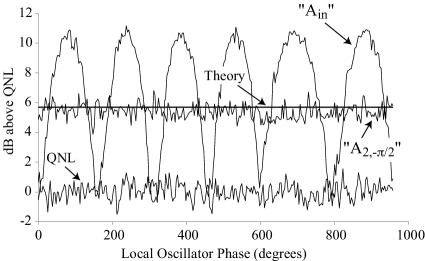
Fig. 2 shows the results of homodyne measurements of the input and output of the UMZI for experiment type A at MHz. Ref. hunt04 outlines the approach taken to model mode-mismatch. To take an example, the intensity noise of either of the output fields is where is the mode-matching efficiency of the UMZI given by the square of the fringe visibility. There is good agreement between the measured and predicted behaviour of the UMZI.
Of more interest is what happens if the input beam is squeezed. From Eq. 5 we see that the noise of the output beam must be greater than the QNL for all quadratures (as is always greater than 2 for ). Indeed, from Eq. 4, this shows that squeezed beams have side-band photons. So the output beams show excess noise. Now consider the correlations between the output beams. If amplitude quadrature measurements are simultaneously made on both beams then the sum and difference photocurrent variances (normalised to the QNL of both output beams) are given by
| (6) |
If the input beam is amplitude squeezed then Eq. 6 shows that amplitude measurements of the two beams are anti–correlated to below the QNL. On the other hand if phase quadrature measurements are simultaneously made on both beams then the normalised sum and difference photocurrent variances are given by
| (7) |
Thus phase quadrature measurements are correlated to below the QNL. Sub–QNL correlations on both quadratures are the signature of entanglement duan , showing that the side–band entanglement has been transferred to entanglement between spatially separated beams hunt02 .
To demonstrate these quantum effect, we use an UMZI to separate the side–bands of an amplitude squeezed input field. In this experiment (type B), we use a commercially available pulsed Optical Parametric Oscillator pumped by a mode locked Ti:Sapphire laser (both Spectra Physics). The Optical Parametric Oscillator produces pulses of 130fs at a center wavelength of 1530nm and a repetition rate of 82MHz. The nonlinear Kerr effect experienced by intense pulses in optical fibers (see e. g. ref. SIZ99 ) is used to generate non–classical states of light. During propagation of such pulses through a fibre, a high degree of excess phase noise is introduced mainly due to some classical noise effects. Employing an asymmetric fibre Sagnac interferometer SCHM98 , amplitude squeezing can be produced, the amplitude not being affected by excess noise.
For a pulsed laser beam the separation of side–bands can be performed only at certain frequencies, as two conditions have to be fulfilled simultaneously. (1) Two pulses have to overlap temporally giving a boundary condition for the path length difference ( is an integer number and is the time between two pulses) and (2) A –phase shift at the measurement frequency must be introduced, so that . Possible measurement frequencies are therefore . At our repetition rate the arm length difference must be a multiple of 3.66m, corresponding to the distance between two successive pulses. The arm length difference is set to be 7.32m for measurements at MHz.
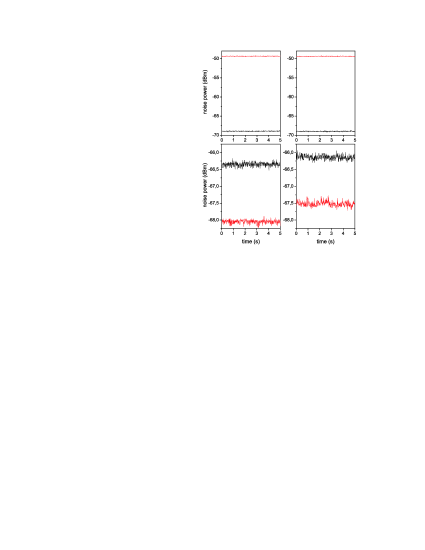
We launched about dB of amplitude squeezed light into the UMZI. A visibility of 95% was observed at the output to generate entanglement. On each of the two output beams we performed an amplitude noise measurement (see the upper two graphs in Fig. 3). The amplitude noise of the output beams (gray traces) is almost 20dB above the quantum noise limit (black traces). This high noise level is an indication that strong correlations between pairs of side–bands might be present. Note also that the squeezing is lost as a result of the separation of side–bands. The high noise level is not only due to antisqueezing, but also due to the high classical thermal phase noise of our squeezed states.
To demonstrate that this beam pair is indeed entangled, correlations below the quantum noise limit between the two beams in the amplitude as well as in the phase quadrature must be observed. While amplitude correlations are verified rather easily in direct detection of the two output modes and subsequently correlating the photocurrents, phase measurements are more involved. Having intense pulsed light trains, neither homodyne detection (that might saturate our detectors due to the high intensities involved) nor phase shifting cavities (with high requirements on resonance conditions) could be easily employed. We therefore used an interferometric scheme where two entangled beams interfere at yet another 50/50 beam splitter. Their relative phase is such that the output beams (denoted a and b) of this interference have equal intensity Silberhorn01 . Both output beams are then detected directly. The spectral component at frequency of the sum and the difference of the photocurrents from the two detectors yields signals that are proportional to the sum of the amplitude and the difference of the phase quadratures of the two entangled beams respectively
The measurement scheme is equivalent to a Bell state measurement on intense light beams LEU99ZHA00 . It turned out that this type of measurement can also be applied to the entangled beam pair generated by separating the side–bands to check for the correlations in the amplitude and the phase quadrature. In the verification experiment, we achieved a visibility of more than 90%. We observed about 1.6dB of correlations below the quantum noise limit in the amplitude quadrature (lower left traces in Fig. 3) and about 1.4dB of correlations in the phase quadrature (lower right traces in Fig. 3). This experiment shows that the quantum correlations between the side–bands of the squeezed input beam have been successfully transferred to quantum correlations between two spatially distinct outputs. The result clearly shows the entanglement between the outputs, as both, non–classical correlations in the amplitude as well as in the phase quadrature of the beam pair were detected. Note that the degree of observed correlations of dB for the amplitude quadrature (dB for the phase quadrature) agrees with the prediction from theory. About dB of correlations are expected when dB of input squeezing are used, as the correlations are degraded by the contribution of the uncorrelated vacuum side–bands (see Eqs. 6 and 7). To extract the full correlations of dB a pair of frequency shifted local oscillators would have to be applied as proposed by Zhang zhang03 .
In summary, we have demonstrated the production of a new type of entangled light via a device which can be used to separate the quantum side-bands of an optical field. This device is in essence an unbalanced Mach-Zehnder interferometer (UMZI) where the path length difference is determined by the frequency at which side-band separation is required. We have shown that the UMZI may be used to spatially separate the positive and negative side-bands of a phase modulated optical field. Applying this to single mode squeezed light produces spatially separated entangled beams. Many landmark experiments have investigated quantum properties with homodyne detection, for example breit97 ; furu98 . The techniques described here and in ref. hunt04 open a new window on these and other quantum optics experiments.
This work was supported by the Australian Research Council and by the Schwerpunktprogramm 1078 of the Deutsche Forschungsgemeinschaft and the network of competence QIP of the State of Bavaria (A8). U. A. gratefully acknowledges financial support of the Alexander von Humboldt foundation.
References
- (1) C. M. Caves, Phys. Rev. D 26, 1817 (1982)
- (2) W. G. Unruh, in Quantum Optics, Experimental Gravitation, and Measurement Theory, edited by P. Meystre and M. O. Scully, p. 647, Plenum, New York (1983)
- (3) C. M. Caves and B. L. Schumaker, Phys. Rev. A 31, 3068 (1985)
- (4) B. Yurke, Phys. Rev. A 32, 300 (1985)
- (5) J. Gea-Banacloche and G. Leuchs, J. Mod. Opt. 34, 793 (1987)
- (6) R. Graham, Phys. Rev. Lett. 52, 117 (1984)
- (7) M. D. Reid and P. D. Drummond, Phys. Rev. Lett. 60, 2731 (1989); M. D. Reid, Phys. Rev. A 40, 913 (1989)
- (8) Z. Y. Ou et al., Phys. Rev. Lett. 68, 3663 (1992); S. F. Pereira et al., Phys. Rev. A, 62, 042311 (2000).
- (9) Y. Zhang et al., Phys. Rev. A62, 023813 (2000).
- (10) Ch. Silberhorn et al., Phys. Rev. Lett. 86, 4267 (2001)
- (11) Continuous Variable Quantum Information, edited by S.Braunstein and A.Pati, Kluwer Academic Publishers, The Netherlands, (2003).
- (12) E. H. Huntington and T. C. Ralph, J. Opt. B: Quant. Semiclass. Opt., 4, 123 (2002).
- (13) J. Zhang, Phys. Rev. A, 67, 054302 (2003)
- (14) E. H. Huntington and T. C. Ralph, Phys. Rev. A, 69, 042318 (2004).
- (15) J. M. Merolla et al., Phys. Rev. Lett. , 82, 1656 (1999)
- (16) M. A. Johnson and C. H. Townes, Opt. Commun. 179, 183 (2000)
- (17) S. Inoue et al., J. Opt. Soc. Am. B, 14, 2761 (1997).
- (18) O. Glöckl et al., Opt. Lett., 29, 1936 (2004).
- (19) R. J. Glauber, Phys. Rev., 130, 2529 (1963).
- (20) H. A. Bachor and T. C. Ralph, A Guide to Experiments in Quantum Optics 2nd Ed., Wiley-VCH, Wenheim, 2003
- (21) H. Kogelnik and T. Li, App. Opt., 5, 1550 (1966).
- (22) L.-M. Duan et al., Phys. Rev. Lett. , 84, 2723 (2000); R. Simon, Phys. Rev. Lett. , 84, 2726 (2000)
- (23) A. Sizmann and G. Leuchs, Progress in Optics, XXXIX, 373 (1999).
- (24) S. Schmitt et al., Phys. Rev. Lett. , 81, 2446 (1998); D. Krylov and K. Bergman, Opt. Lett., 23, 1390 (1998)
- (25) G. Leuchs et al., J. Mod. Opt. 46, 1927 (1999); J. Zhang and K. Peng, Phys. Rev. A 62, 064302 (2000)
- (26) G. Breitenbach and S. Schiller, Nature 387, 471 (1997).
- (27) A. Furusawa et al., Science, 282, 706 (1998)