Thermodynamic and noise considerations for the detection of microscopic particles in a gas by Photoacoustic Raman spectroscopy
Abstract
We develop a simple thermodynamic model to describe the heat transfer mechanisms and generation of acoustic waves in photoacoustic Raman spectroscopy by small particulate suspensions in a gas. Using Langevin methods to describe the thermal noise we study the signal and noise properties, and from the noise equivalent power we determine the minimum number density of the suspended particles that can be detected. We find that for some relevant cases, as few as 100 particles per cubic meter can be detected.
pacs:
42.65.Dr, 33.20.Fb, 51.70.+fI Introduction
Optoacoustics as a field has venerable roots dating back to 1880 when Alexander Graham BellBell first found that periodic illumination of colored substances generates sound. The process involves absorption of energy from a modulated light source by the atoms or molecules in the medium, producing a variable heat source which serves as a source for acoustic waves; the sound can be detected by microphones or piezoelectric transducers.
Photoacoustic spectroscopy, as it is also known, has become a valuable spectroscopic tool with extensive use in the study of absorption spectra and electronic spectra of substances in both condensed and gaseous phases Pao ; cknrmp ; tam ; Rosencwaig . The type of atomic or molecular modes being studied determines the frequency of the incident light used, which can be in the visible range for electronic excitations or in the infra-red for vibrational modes.
Photoacoustic techniques were first applied to Raman spectroscopy in 1979 by Barrett and Berry Barrett , to create the nonlinear spectroscopic technique they called photoacoustic Raman spectroscopy (PARS). It was subsequently applied to liquids ckn and to gaseous trace analysisSeibert . Resolution much higher than the natural linewidth of Raman transitions has been achieved using narrow linewidth pulsed lasers Rotger .
Numerous researchers in the last couple of decades have routinely applied photoacoustic methods to determine structural and thermal properties in solid state physics Mandelis ; solidstate , to conduct non-intrusive studies of nanostructures nano , to analyze internal structure and dynamics of molecules in chemistry chemistry , and as a non-invasive way of characterizing wavelength dependent optical properties of biological samples Krebs . But almost all such applications have involved linear infrared excitations, and very often the photoacoustic measurements were a supplement to separate Raman spectroscopic analysis. In contrast there has been limited literature on the usage of PARS as a tool by itself for spectral studies.
However as we will show here, PARS can become a very effective and sensitive means of spectral detection of suspended solid contaminants in air. The immediate motivation for our study arises from the urgent necessity for reliable methods to detect trace amounts of microbial spores like anthrax in the current context of defense against bio-terrorism. Methods based on coherent Raman spectroscopy are already being actively pursued fastcars where the spectroscopic signature of a characteristic molecular constituent is sought. An optoacoustic method based on Raman spectroscopy can take advantage of the same signature but offer an alternative and experimentally simpler detection scheme. In fact the first application of infra-red photoacoustic spectroscopy for identifying bacterial spores was reported just a few months ago Thompson where the constituents in a mixture of diverse specimen were identified correctly with accuracy. Applications are viable also in a broader context since acoustic detection of stimulated Raman emissions using the powerful lasers available these days can lead to more sensitive trace analysis.
It is worth noting that application of photoacoustics to highly sensitive detection of trace amounts of pollutants in gaseous medium was originally responsible for its tremendous growth and revival in the 1970’s. Traditionally such applications have almost always relied on infrared single photon absorption by the pollutants. But using Raman scattering provides several advantages: (i) the incident light can be in the visible range in which both air and water are essentially transparent while they absorb in the infrared; this is particularly relevant for bacterial spores because most of the non-signature molecules are water, (ii) adjusting the difference of the two input fields allows tuning to different vibrational modes not available for direct infrared excitation, and (iii) in stimulated Raman scattering the signal depends on the product of two laser intensities, and so it can be maximized using strong lasers.
Moreover new innovations in Raman spectroscopy, such as STImulated Raman Adiabatic Passage (STIRAP) Bergmann or using chirped pulses allows complete population transfer from the ground state to the first molecular vibrational state. Subsequent relaxation of the excited state can generate sound waves. In fact experimental evidence already exists harris , that a coherently excited molecular gas generates intense sound waves when the incident electromagnetic fields are close to Raman two-photon resonance.
In this paper we will consider a model for a PARS experiment to detect small () suspended solid particle in air. We determine the signal strength by considering the basic thermodynamic processes involved and describe the acoustic disturbance by a wave equation. To describe the noise in the system we use a Langevin method which has the advantage of being able to include possible additional sources of noise with little extra effort. From the expressions for the signal and the noise we determine the noise equivalent power (NEP) and from that the minimum detectable particle density. We describe our model in Sec. II, and then in Secs. III and IV we consider the thermodynamics of the energy transfer from the fields to the photoacoustic cell. In the following two sections V and VI we describe the acoustic waves and evaluate the thermal noise and the NEP using second order Langevin equations, and then in Sec. VII we bring all the elements together to determine the minimum detectable number density for the specific example of an anthrax spore.
II The model
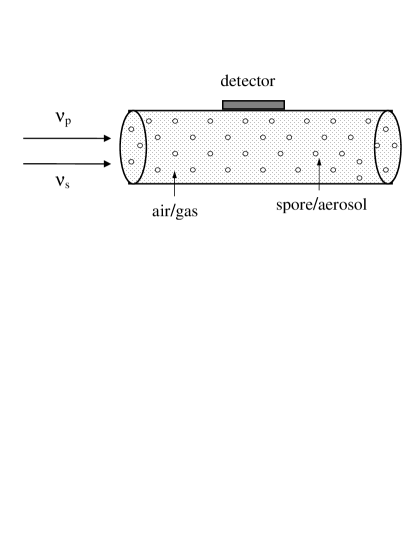
The configuration we consider, shown in Fig. 1, is typical of most photacoustic experiments where the driving lasers pass through a gas/air-filled cylinder which may contain the Raman active medium of interest in the form of suspended particles. The detector is located at a position orthogonal to the direction of propagation of the laser beams. Mirrors may be placed at the ends of the gas cell for multiple passes of the lasers.
The Raman scattering needs to be Stokes-type because energy needs to be deposited in the medium, and necessarily be stimulated in nature because of the stronger signals produced. Thus there are two input beams: the pump beam with energy and a Stokes beam with energy . The Raman scattering scheme is shown in Fig. 2 with and being the upper and the lower levels and energy difference is . Raman resonance is achieved when .
Each of the spores we wish to detect has volume and contains molecules; out of these a fraction are the Raman active molecules we call , and the remaining we take to be predominantly composed of another species of molecule , usually water for a bacterial spore, that is effectively non-absorbing in either of the input fields. The Raman scattering deposits energy in the gas cell whereby heat is generated that serves as the driving force for acoustic waves. The heat-energy transfer happens in two steps:
Step 1. The excitation energy of the molecules will be converted to heat energy via collisions , and among the molecules in a particle. This will depend on the Raman scattering cross-section and the radiative and collisional damping that happens within a spore.
Step 2. The energy gained by molecules in the spore will be transferred to the gas molecules in the tube. Since the spore is much larger than the gas molecules, this can be modelled by kinetic theory.
If we define to be the energy absorbed due to Raman scattering per unit volume per unit time, then the energy absorbed by a spore per unit time is . A fraction of this energy is converted to translational energy or heat of the surrounding gas molecules within the time scales of acoustic modes, and therefore that is the fraction available for the acoustic signal. The spores will be randomly distributed in a gas cell, and we define to be their average number density. The amount of energy available for acoustic signals per unit volume of air per unit time is then given by:
| (1) |
In order to determine the minimum detectable , we will have to find the minimum energy density that can produce a detectable signal, and for this we first need to estimate all the other quantities in the above expression as well as the noise level.
III Raman induced heat energy
In the Raman scattering process, the pump beam loses photons by exciting the molecules and their subsequent de-excitation produces Stokes photons, and the energy difference is deposited in the medium. For each photon converted the deposited energy is . The total energy deposited is determined by the number of photons gained by the Stokes beam, which has an exponential dependence on the interaction length ,
| (2) |
The gain coefficient is given by Yariv
| (3) |
where is the velocity of the Stokes photons with being the refractive index in the medium; is the linewidth for the Raman transition; is the density of the active medium. The last factor is the fractional population difference of the upper and lower atomic levels for thermal occupation probabilities. The gain is relatively small over the interaction lengths which is on the scale of a spore-size for trace occurrences, so we may write . This also means that the fractional change in the input beam intensities is small so that we can treat the average values of and as constants during the time of interaction. Thus the change in the intensity of the Stokes signal is
| (4) |
where we defined the intensity-independent gain factor . By definition, intensity power/area, therefore dividing through by we have a relation for the rate of change of energy of the Stokes beam per unit volume. Each photon converted deposits energy in the medium, so the rate of energy absorbtion per unit volume of the medium is given by
| (5) |
There are three possible fates for this energy: (i) it can be lost by radiation, (ii) energy from one molecule can be transferred to excite another molecule via collisions or (iii) the energy will be converted to translational energy via collisions. The last process is the one which will directly lead to heating of the system. Since the excitations are vibrational in nature the second process will also cause heating as well after a few collisions. We denote the radiative decay rate by which corresponds to the first process of loss, and we denote the collisional loss by which corresponds to the last two processes. With these considerations we can now relate the heat absorbed per unit volume of the medium to the Raman gain factor and the input laser intensities
| (6) |
IV heat transfer efficiency
We next need to determine the part of this heat that is actually available as acoustic energy. This is parameterized by which depends on how much of the Raman energy absorbed by a spore can be transferred to the surrounding gas in the optoacoustic cell on the time scale of acoustic modes. As we noted in the previous section the heat is lost from the spore through radiation and through collisions with gas molecules.
We first calculate the collisional energy transfer rate. Assuming a spherical particle of radius , the rate of collisions of gas molecules with the surface of the particle is determined by
| (7) |
with mean velocity of the gas molecules given by ; at standard temperature and pressure (STP), collisions/second. The temperature increase of the spore due to Raman absorption is given by
| (8) |
where is the Avogadro number and the molar specific heat. Most of the molecules in a bacterial spore are usually water (for example in anthrax spores ) and so we use the specific heat of water . Then for typical vibrational frequencies of Hz and Raman active fraction in the range , the spore will gain a temperature of K. Thus the increase in temperature of the spore after Raman scattering is of the order of the initial temperature of the gas ( K), and since the water and the diatomic gas molecules have similar masses, the energy transfer in each collision will also be of the same order . Therefore the rate of heat transfer from the particle to the gas is given by
| (9) |
and the time scale of the collisional heat loss is . The number of water molecules in a micron-size particle is . Thus the typical acoustic modulation times of s.
The rate of heat loss by radiation is given by
| (10) |
where is the Stefan-Boltzmann constant. At the upper limiting temperature of K for a micron-size particle the radiative flux is . The energy deposited in the spore is given by J, so the time scale of radiative loss is of the order of s, which is much slower than the collisional loss rate. Therefore we can assume that on the time scale of the acoustic waves, essentially all the heat from the spores is transferred to the gas through collisions, and so we can take .
V Acoustic signals
The absorbed heat will cause a pressure wave which will radiate out from each spore. Considering that the time for a laser pulse to traverse the optoacoustic device is very short compared to the time scale of sound propagation, the heat absorption and subsequent release is simultaneous for all the spores. So the wavefronts from each spore will be in sync and will add constructively to cause a macroscopic expansion/contraction of gas in the optoacoustic device. This allows us to describe the acoustic waves in the tube by a macroscopic wave equation for which serves as the source.
When the density of the spores is sufficiently high to give a statistically uniform distribution, the wavefronts from all of them will merge to yield acoustic waves which bear the symmetry of the beam profile, typically cylindrical; on the other hand if the density is such that the number of spores in the tube is of order unity, the waves will bear the symmetry of the spore which is roughly spherical. For an estimate of signal and noise we need not delve into the specific nature of the acoustic modes, except to note that only the lowest modes are significantly excited.
There is no net transport of matter for weak acoustic modes, so the waves can be described by relative displacement of infinitesimal volume segments in the medium; we denote the displacement from equilibrium of the air at distance from the source by and the associated variation from the equilibrium pressure by . The propagation of the disturbance is then described by
| (11) |
The sound velocity in the medium is with equilibrium density, the volume of the gas cell and the ratio of specific heat at constant pressure to that at constant volume. The macroscopic damping rate of the acoustic modes is denoted by and the external driving force is . We have added a random force to allow a Langevin treatment of the fluctuations. The calculation of the noise in terms of the displacement variable has the intuitive appeal that the driving terms carry dimensions of force.
The process of heat transfer on the other hand is best described in terms of a thermodynamic variable and we will write an equivalent wave equation for the pressure variation which is related to Eq. (11) by
| (12) |
Before we write the equation we determine the form of the driving force. For fixed total volume of the gas in the cell, basic thermodynamics relates the change in heat to the pressure differential
| (13) |
Earlier we defined as the heat generated per second per unit volume of the gas due to the incident light so that , it carries dimensions of power/volume pressure/time. This heat drives the acoustic waves and we can now write the wave equation for the pressure variations
| (14) |
Here the random term is not a force, but it can be derived from the force in the displacement equation. The first step to the solution of the wave equation is to eliminate the spatial derivative by doing an expansion in terms of the normal modes of the corresponding homogenous equation
| (15) |
where the mode functions and the mode frequencies are determined by the symmetry of the system and the boundary condition of vanishing velocity at the cell-walls. The displacement has an identical expansion with the same frequencies but different mode functions and amplitudes . The modes are orthogonal and normalized to
| (16) |
VI Signal, noise and NEP
The signal strength is determined by the mode amplitudes of the pressure variations that satisfy
| (17) |
The signal damping rate , which determines the profile of the acoustic signal, is determined primarily by macroscopic thermal and viscous losses. After doing a Fourier transform, etc., we obtain an expression for the mode amplitudes in the frequency domain
| (18) |
To calculate the noise we use the normal mode expansion of the displacement in Eq. (11) and write the resultant second order Langevin wave equation for the mode amplitudes as two coupled linear equations
| (19) |
with . The damping rate of the noise amplitudes is mainly determined by the characteristics of the detector and should be distinguished from the signal damping. A time-frequency Fourier transform of the first of the two equations, along with the property of the noise that , determines the power spectrum of the velocity distribution
| (20) |
Assuming white noise, the noise is delta-correlated . The Weiner-Khintchine theorem gives the correlations for the noise force in the time domain, which define the diffusion coefficient ,
| (21) |
An inverse Fourier transform and the equipartition theorem for each mode in thermal equilibrium, , yields the diffusion coefficient
| (22) |
Now we take a Fourier transform of the second order equation in the displacement mode amplitudes
| (23) |
and use expression (22) for the diffusion coefficient and the relation between and in Eq. (12)
| (24) |
to get the noise spectrum of pressure-wave amplitude
| (25) |
The noise equivalent power (NEP) is defined to be the input power necessary to produce a signal amplitude equal to the noise amplitude Kreuzer . In order to estimate the NEP we note that the signal is typically generated in the lowest mode corresponding to an uniform excitation of the gas. The noise is also dominated by the lowest modes for weak excitations. For the very lowest mode the noise amplitude vanishes, so we take the amplitude of the next higher one as a measure of the magnitude of the noise. Thus the noise equivalent power is approximately given by the value (indicated by subscript NEP) of the input power for which . Using the expressions from Eqs. (18) and (25) we get
where we also used the fact that acoustic modulation frequency is typically much smaller than the mode frequencies .
VII Minimum detectable density
The minimum detectable number density of spores can be estimated by setting the input power density , the noise equivalent power density in Eq. (1). For the purpose of numerical estimation we will use the specific example of an anthrax spore for which the Raman active molecule is dipcolinic acid (DPA) which constitutes of the weight, the rest being mainly water. Since some of the properties of DPA are not easily available, for those we use the values for benzene an organic molecule similar in structure.
The dimensions of gas cell are optimized for the maximum interaction with the input beams, for a typical cell length of m, the optimum radius for focussing the beams into the cell is given by if we use a wavelength in the visible range so that the cell volume . We will assume that by placing multiple microphones all of the generated signal can be detected, but this can be easily relaxed by including a geometrical factor which involves the ratio of detector surface area to the cell surface area.
At standard temperature and pressure, and and ; for air being mainly diatomic gases. We take the dominant noise mode to be at the resonant frequency of the detector, typically a condenser microphone, , and a reasonable valueKreuzer is , the damping of the mode has the same order of magnitude assuming a quality factor . The optimum modulation frequency is determined by the thermal damping time . Using these values we find
In order to calculate the Raman gain factor , we use optical frequencies for the input beams . The number density of DPA molecules in an anthrax spore is molecules m-3. We use the Raman cross-section for Benzene . A typical linewidth of a Raman line for Benzene is about . Using these values we get for the gain factor
| (26) |
Finally noting that an anthrax spore has dimensions we can use Eq. (1) to find the minimum detectable number density of anthrax spores in air
where we multiplied by the square root of the width of the acoustic signal since the NEP is not really “power” but power/. With powerful lasers available today intensities of are reasonable, in which case one would get .
Note that so one cannot indefinitely increase the laser intensities because at intensities of there is cascade breakdown Kroll of air at STP. While cooling the gas cell seems to be easy way to reduce thermal noise, due to condensation effects temperatures cannot be lowered too much. Also it is much simpler and realistic to do conduct tests for atmospheric contaminants at room temperatures.
VIII Conclusion
In conclusion, we developed a simple thermodynamic model to describe the heat transfer mechanisms and generation of acoustic waves in photoacoustic Raman spectroscopy for detection of trace amounts of small solid particles suspended in air. As it has been pointed out since its first application Barrett PARS has several advantages over other stimulated Raman techniques: it is not plagued by a non-resonant background and there is no necessity for phase-matching, two very crucial issues in Coherent Anti-Stokes Raman Spectroscopy (CARS) for example, also PARS directly measures the deposited Raman energy instead of a fractional energy change. The noise in PARS arises primarily from thermal fluctuations which may be reduced by controlling macroscopic parameters, unlike in other Raman process where the noise arises from microscopic quantum fluctuations harder to control. Even though thermal noise in a gas is well documented, we applied Langevin methods to calculate it for our particular physical situation; a reason for doing that is that it can be immediately applied to include other sources of noises in more detailed studies in the future.
We applied our model to the specific case of anthrax spores and showed that as few as spores in a volume of one cubic meter could be detected if thermal noise is the main limitation in the system. This promises potential development of a PARS-based method to detect such harmful contaminants in real time with relatively simple means at room temperatures, something that is certainly of very strong practical and immediate interest.
Acknowledgments
We thank S. E. Harris for useful discussions and gratefully acknowledge the support from the Office of Naval Research, the Air Force Research Laboratory (Rome, NY), Defense Advanced Research Projects Agency-QuIST, Texas AM University Telecommunication and Information Task Force (TITF) Initiative, and the Robert A. Welch Foundation.
References
- (1) A. G. Bell, Am. J. Sc., 20, 305 (1880).
- (2) An excellent early overview of various aspects of optoacoustic spectroscopy is to be found in the book edited by Y. H. Pao, Optoacoustic Spectroscopy and Detection (Acacemic, New York, 1977).
- (3) C. K. N. Patel and A. C. Tam, RMP 53, 517 (1981).
- (4) A. C. Tam, RMP 58, 381 (1986).
- (5) A. Rosencwaig , Photoacoustics and Photoacoustic Spectroscopy Chem. Anal. (N.Y.) Vol. 57 (1980).
- (6) J. J. Barrett and M. J. Berry, Appl. Phys. Lett. 34, 144.
- (7) C. K. N. Patel and A. C. Tam, Appl. Phys. Lett. 34(11), 760 (1979).
- (8) D. R. Seibert, G. A. West, J. J. Barrett, Appl. Phys. Lett.34, 144 (1979).
- (9) M. Rotger, B. Lavorel and R. Chaux, Jour. Ram. Spec. 23, 303 (1992).
- (10) Photoacoustic and Thermal Wave Phenomena in Semiconductors, edited by A. Mandelis (Elsevier, New York, 1987).
- (11) Some recent works where photoacoustic methods have used to study solid state systems include: L. Fangxin, Y. Jinlong, Z. Tianpeng, Phys. Rev. B 55, 8847 (1997); C. Glorieux, J. Thoen, G. Bednarz, M. A. White, and D. J. W. Geldart, ibid. 52, 12770 (1995); J. J. Alvarado-Gil, O. Zelaya-Angel, H. Vargas, and J. L. Lucio M., 50, 14627 (1994); T. Ikari, A. Fukuyama, K. Maeda, K. Futagami, S. Shigetomi, and Y. Akashi, ibid. 46, 10173 (1992); A. Pinto Neto, H. Vargas, N. F. Leite, and L. C. M. Miranda, ibid. 41, 9971 (1990).
- (12) Y. Xiong, K. N. Yu, C. Xiong, Phys. Rev. B 49, 5607 (1994); J. Y. Ying, J. B. Benziger, and H.Gletier, ibid. 48, 1830 (1993).
- (13) S. S. Brown, H. L. Berghout and F. F. Crim, J. Chem. Phys. 106, 5805 (1997); D. Luckhaus, M. J. Coffey, M. D. Fritz, and F. F. Crim, ibid. 104 3472 (1996); D. Cavagnat, L. Lespade, and C. Lapouge, ibid.103, 10502 (1995); A. Melchior, I. Bar, and S. Rosenwaks, J. Phys. Chem. A 102, 7273 (1998).
- (14) For example see R. Krebs, M. Bartels, M. Meinhardt, H. Lubatschowski, and A. Anders, Laser Physics 5, 724 (2003).
- (15) M. O. Scully, G.W. Kattawar, R. P. Lucht, T. Opatrny, H. Pilloff, A. Rebane, A. V. Sokolov, and M. S. Zubairy, PNAS 99, 10994 (2002).
- (16) S. E. Thompson, N. S. Foster, T. J. Johnson, N. B. Valentine, and J. E. Amonette, Appl. Spec. 57, 893 (2003).
- (17) K. Bergmann, H. Theuer, and B. W. Shore, Rev. Mod. Phys. 70, 1003 (1998).
- (18) A. V. Sokolov, D. D. Yavuz, D. R. Walker, G. Y. Yin, and S. E. Harris, Phys. Rev. A 63, 051801(R) (2001).
- (19) A. Yariv Quantum Electronics, 2nd ed. (Wiley, New York, 1975), chapter 18.
- (20) See the article by L. B. Kreuzer in Ref. Pao .
- (21) N. Kroll and K. M. Watson, Phys. Rev. 5, 1883 (1972).