Ultralong coherence times in the purely electronic zero-phonon line emission of single molecules
Abstract
We report the observation of ultralong coherence times in the purely electronic zero-phonon line emission of single terrylenediimide molecules at 1.4 K. Vibronic excitation and spectrally resolved detection with a scanning Fabry-Perot spectrum analyzer were used to measure a linewidth of 65 MHz. This is within a factor of 1.6 of the transform limit. It therefore indicates that single molecule emission may be suited for applications in linear optics quantum computation. Additionally it is shown that high resolution spectra taken with the spectrum analyzer allow for the investigation of fast spectral dynamics in the emission of a single molecule.
Schemes employing linear optics offer a promising approach for the realization of efficient quantum computation Knill et al. (2001). True single photon sources generating photons on demand are indispensable for this purpose. Until recently, such ideal light sources have been substituted with parametric down conversion in nonlinear crystals generating twin photons. Even though high levels of indistinguishability, and thus strong Hong-Ou-Mandel correlations Hong et al. (1987), can be achieved with this method, experiments using this source are bound to be performed at very low intensities. This however impedes the implementation of large scale protocols Sanaka et al. (2004).
Single photon sources based on two-level emitters constitute an attractive alternative to twin photons. Single molecules Martini et al. (1996); Brunel et al. (1999); Lounis and Moerner (2000), single quantum dots Michler et al. (2000); Santori et al. (2001), and single nitrogen-vacancies in diamond Beveratos et al. (2002) have successfully been used as such sources. They can provide single photons at high emission rates with negligible two or more photon generation probabilities. A crucial remaining requirement for their application to linear optics quantum information protocols is photon indistinguishability.
Indistinguishability of emitted photons from incoherently excited two-level emitters is directly related to their coherence length, provided that the excited level is populated via a fast relaxation process Kiraz et al. (2004). In the case of transform limited emission, a high level of indistinguishability is then granted. The ultimate transform limit is given by , where and represent the population and coherence decay times, respectively. This limit has recently been approached within a minimum factor of for single InAs quantum dots Bayer and Forchel (2002); Kammerer et al. (2002); Santori et al. (2002). These results enabled direct measurements of indistinguishability Santori et al. (2002), violation of Bell’s inequality Fattal et al. (2004a), and quantum teleportation Fattal et al. (2004b). In contrast, the linewidth measurement of a single nitrogen-vacancy in diamond revealed a coherence time which was much smaller than the transform limit Jelezko et al. (2003).
For more than a decade, single molecules in organic host materials have been detected at cryogenic temperatures Tamarat et al. (2000); Moerner (2002). With one exception Nonn and Plakhotnik (2001), these experiments rely on the narrow bandwidth excitation of the molecule’s purely electronic zero-phonon line (ZPL). The detected Stokes shifted fluorescence is composed of the contributions from several vibrational states, but does not contain the ZPL. In these experiments, transform limited absorption of the ZPL is routinely observed by scanning the excitation wavelength. To date however, the ZPL emission as a potential source of indistinguishable single photons has not been detected and analyzed.
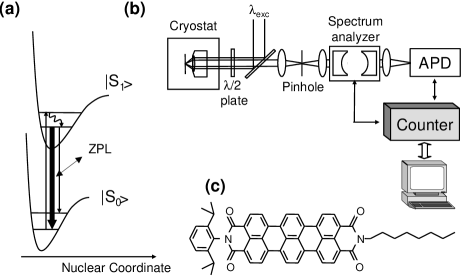
Here, we demonstrate that nearly transform limited ZPL emission from single molecules can be obtained by using vibronic excitation. For this purpose, we excite vibronic transitions of individual molecules (Figure 1(a)) Kiraz et al. (2003). The fluorescence signal is now composed of the ZPL and the vibrational bands with intensities determined by the respective Franck-Condon factors. From the integral fluorescence, the ZPL of single molecules can be selected with a spectrally narrow interference filter. The linewidth of the ZPL is measured by using a scanning Fabry-Perot spectrum analyzer (SA). Our excitation scheme is also less susceptible to spectral jumps of the molecules. The absorption bands have a spectral width of several cm-1 which is determined by the lifetime of the excited vibrational state (1-10 ps) and its intense phonon sideband. For this reason, small spectral jumps of the molecular absorption do not lead to a loss of the excitation.
The experiments were performed using a home-built confocal microscope keeping the sample in a superfluid Helium bath at 1.4 K (Fig. 1(b)). The beam from a single mode dye laser (Coherent, 899-29) is reflected off a dichroic mirror, passed through a plate, a galvo optic scanner and a telecentric system, before being focused onto the sample with an aspherical lens (NA=0.55), which is also used for collecting the fluorescence. After transmision through the plate and the dichroic mirror, the collected fluorescence is focused onto a pinhole (200 m diameter) and dispersed with a 46 cm monochromator (Jobin-Yvon, HR460) before detection with a charge coupled device detector (CCD, Acton Research, 128HB). Alternatively, the signal can be sent to the Fabry-Perot SA (Coherent, 240) before detection with an avalanche photodiode (APD, Perkin-Elmer, SPCM-AQR-16). A spectral resolution of 30 GHz is obtained in the spectra taken with the monochromator and the CCD. By contrast, the SA has a free spectral range of 1.5 GHz. Its finesse and peak transmission are measured to be 100 (spectral resolution 15 MHz), and 5%, respectively. A broadband filter (Chroma, HQ 655/60), a color filter (Schott, RG630), and a narrowband interference filter (Omega, 677 SC2, FWHM=2 nm, angle tunable between 650-677 nm) are used in spectrally selecting the ZPL emission. A gated counter (Stanford Instruments, SR400) is used for both external triggering of the SA and accumulation of the APD counts.
We examined terrylenediimide (TDI) molecules (Fig. 1(c)), highly diluted in the Shpol’skii matrix hexadecane. In this crystalline host, TDI molecules exhibit high spectral stabilities allowing the observation of lifetime limited ZPL absorption bands at 1.4 K Mais et al. (1999). The sample solution was prepared by predissolving TDI molecules in a small amount of CH2Cl2. In order to remove the solvent CH2Cl2 and oxygen from the solution, several evaporation (10-5 mbar) and freezing (77 K) cycles were performed. The sample was subsequently heated and quickly loaded to the cryostat.
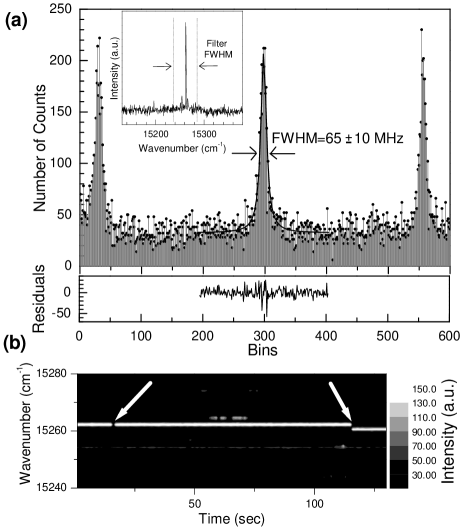
In order to select a single molecule during an experiment, we first scan a 100 m x 100 m area at a fixed excitation wavelength. We then choose the optimum excitation polarization at a sample location and scan the laser wavelength over the 10 nm width of the inhomogeneous band. By this, we can optimize the excitation conditions to detect the resolution limited ZPL emission spectra of single TDI molecules on the CCD, as shown in the inset of Fig. 2(a).
High resolution spectra are obtained by directing this ZPL emission to the SA. A slow scan of the SA reveals spectra of the type depicted in Fig. 2(a). This scan consists of 600 bins, each of which corresponds to different mirror separations of the Fabry-Perot SA. At each bin, the APD counts are integrated for 500 ms. The excitation intensity is 35 W, which is much lower than the saturation power. For this reason, no power broadening is expected. The Lorentzian modulations seen in the figure are separated by 1.5 GHz, which equals the free-spectral range of the SA. A fit to the data yields a MHz linewidth for the ZPL emission. This corresponds to a coherence decay time of ns. By comparison, conventional fluorescence excitation spectroscopy of single TDI molecules in hexadecane yield a homogeneous linewidth of 40 MHz Mais et al. (1999). Therefore, our measured emission linewidth is within a factor of 1.6 of the transform limit. Such deviations from the transform limited value can be due to dynamic host-guest interactions occurring during the acquisition time at 1.4 K. These dynamics can be increased by local heating induced by the excitation laser. Note, however, that local environments of individual molecules may also lead to homogeneous linewidth values differing from the ensemble value of 40 MHz.
Two experimental observations give conclusive evidence that the emission shown in Fig. 2(a) stems from a single molecule. First of all, at the end of this experiment, we increased the excitation power to 10 mW and were able to thermally activate local degrees of freedom by laser induced heating. This resulted in blinking and a digital spectral jump in the fluorescence spectra (Fig. 2(b)). Secondly, given the large inhomogeneous broadening of the TDI band in hexadecane, it is highly improbable that several molecules would appear at the same spectral position in the SA.
We have observed Lorentzian ZPLs with narrow spectra for 8 other molecules. Apart from three molecules, which were spectrally stable over a time of 10 minutes, the other molecules exhibited spectral dynamics even at moderate excitation intensities. This is shown in Fig. 3, where we plot four fast consecutive scans taken with the ZPL fluorescence from such a molecule, at an excitation intensity of 200 W. At each bin, an integration time of 25 ms was used. From the spectra it is evident that the molecule preferentially occupies several spectral positions. Among those, at least two can be identified as indicated by the straight and dotted lines in the figure. It is however important to note that even molecules which exhibit such spectral dynamics can be suitable sources of indistinguishable single photons. The only requirement which needs to be fulfilled then is that they are spectrally stable on the time scale of the spontaneous emission lifetime. In our case, the spectral jumps take place on a ms time scale whereas the fluorescence lifetime is 106 times shorter.
In conclusion, we have observed nearly transform limited ZPL emission from a single TDI molecule in hexadecane with a coherence decay time of 4.9 ns. We used a newly developed vibronic excitation at cryogenic temperatures in connection with a high resolution Fabry-Perot SA to measure these linewidhts in emission. The results show that single molecules can serve as sources for indistinguishable single photons. Our approach offers new possibilities for performing linear optics quantum information experiments like those reported in Santori et al. (2002); Fattal et al. (2004a, b) using larger coherence times. It can also be employed to follow spectral dynamics of single molecules in emission.
The authors thank K. Müllen for a gift of TDI and T.H.P. Brotosudarmo for help with the sample preparation. This work was supported by the Deutsche Forschungsgemeinschaft, SFB533, and the Alexander von Humboldt Foundation (A.K.).
References
- Knill et al. (2001) E. Knill, R. Laflamme, and G. J. Milburn, Nature (London) 409, 46 (2001).
- Hong et al. (1987) C. K. Hong, Z. Y. Ou, and L. Mandel, Phys. Rev. Lett. 59, 2044 (1987).
- Sanaka et al. (2004) K. Sanaka, T. Jennewein, J.-W. Pan, K. Resch, and A. Zeilinger, Phys. Rev. Lett. 92, 017902 (2004).
- Martini et al. (1996) F. D. Martini, G. D. Giuseppe, and M. Marrocco, Phys. Rev. Lett. 76, 900 (1996).
- Brunel et al. (1999) C. Brunel, B. Lounis, P. Tamarat, and M. Orrit, Phys. Rev. Lett. 83, 2722 (1999).
- Lounis and Moerner (2000) B. Lounis and W. E. Moerner, Nature (London) 407, 491 (2000).
- Michler et al. (2000) P. Michler, A. Kiraz, C. Becher, W. V. Schoenfeld, P. M. Petroff, L. Zhang, E. Hu, and A. Imamoḡlu, Science 290, 2282 (2000).
- Santori et al. (2001) C. Santori, M. Pelton, G. Solomon, Y. Dale, and Y. Yamamoto, Phys. Rev. Lett. 86, 1502 (2001).
- Beveratos et al. (2002) A. Beveratos, S. Kühn, R. Brouri, T. Gacoin, J.-P. Poizat, and P. Grangier, Eur. Phys. J. D 18, 191 (2002).
- Kiraz et al. (2004) A. Kiraz, M. Atatüre, and A. Imamoḡlu, Phys. Rev. A 69, 032305 (2004).
- Bayer and Forchel (2002) M. Bayer and A. Forchel, Phys. Rev. B 65, 041308 (2002).
- Kammerer et al. (2002) C. Kammerer, G. Cassabois, M. Perrin, C. Delalande, P. Roussignol, and J. M. Gérard, Appl. Phys. Lett. 81, 2737 (2002).
- Santori et al. (2002) C. Santori, D. Fattal, J. Vuc̆ković, G. S. Solomon, and Y. Yamamoto, Nature (London) 419, 594 (2002).
- Fattal et al. (2004a) D. Fattal, K. Inoue, J. Vuc̆ković, C. Santori, G. S. Solomon, and Y. Yamamoto, Phys. Rev. Lett. 92, 037903 (2004a).
- Fattal et al. (2004b) D. Fattal, E. Diamanti, K. Inoue, and Y. Yamamoto, Phys. Rev. Lett. 92, 037904 (2004b).
- Jelezko et al. (2003) F. Jelezko, A. Volkmer, I. Popa, K. K. Rebane, and J. Wratchup, Phys. Rev. A 67, 041802 (2003).
- Tamarat et al. (2000) P. Tamarat, A. Maali, B. Lounis, and M. Orrit, J. Phys. Chem. A 104, 1 (2000).
- Moerner (2002) W. E. Moerner, J. Phys. Chem. B 106, 910 (2002).
- Nonn and Plakhotnik (2001) T. Nonn and T. Plakhotnik, Chem. Phys. Lett. 336, 97 (2001).
- Kiraz et al. (2003) A. Kiraz, M. Ehrl, C. Bräuchle, and A. Zumbusch, J. Chem. Phys. 118, 10821 (2003).
- Mais et al. (1999) S. Mais, T. Basché, G. Müller, K. Müllen, and C. Bräuchle, Chem. Phys. 247, 41 (1999).