Bichromatic electromagnetically induced transparency in cold rubidium atoms
Abstract
In a three-level atomic system coupled by two equal-amplitude laser fields with a frequency separation 2, a weak probe field exhibits a multiple-peaked absorption spectrum with a constant peak separation . The corresponding probe dispersion exhibits steep normal dispersion near the minimum absorption between the multiple absorption peaks, which leads to simultaneous slow group velocities for probe photons at multiple frequencies separated by . We report an experimental study in such a bichromatically coupled three-level system in cold 87Rb atoms. The multiple-peaked probe absorption spectra under various experimental conditions have been observed and compared with the theoretical calculations.
42.50.Gy, 32.80.2t
A resonant laser beam can pass through an opaque atomic medium without attenuation due to the quantum interference effect between the dressed states created by a coupling laser field. This phenomenon is known as electromagnetically induced transparency (EIT) [1, 2, 3]. In recent years, many studies on EIT and related phenomena have been carried out, which reveal the importance of EIT in understanding the fundamental physics involving interactions between light field and resonant medium [4, 5, 6, 7, 8]. It has been shown that EIT may have applications in a variety of research topics such as quantum optics with slow photons [9, 10, 11, 12, 13], quantum information processing [14], atomic frequency standard [15, 16, 17, 18], and quantum nonlinear optics [19, 20].
Recently, Lukin et al proposed a mechanism to entangle two photons in an EIT medium based on obtaining slow photons at different frequencies [21]. Since the EIT created by a monochromatic field only provides the steep dispersion near the resonant frequency, sophisticated schemes are proposed to obtain slow photons at different frequencies [21, 22]. Here, we show that EIT in a type level configuration created by a bichromatic laser field may be used to slow down photons at different frequencies. The three-level system coupled by a bichromatic field and a probe field is depicted in Fig. 1(a). The dressed states created by the bichromatic field consist of an infinite ladder with an equal-spacing separation between the neighboring levels when the average frequency of the bichromatic field with equal amplitudes of the two frequency components matches the atomic transition frequency. The dressed states are the superposition of the atomic states 2, 3, and the photon number states with the amplitude determined by the Rabi frequency () and the frequency separation . Such dressed states and the fluorescence spectrum of the two-level atoms coupled by a bichromatic field have been extensively studied before [23, 24, 25, 26]. The dressed state picture of the bichromatic driven three-level system is depicted in Fig. 1(b). It is expected that the probe absorption spectrum will exhibit multiple peaks corresponding to the dressed transitions and transparent windows with minimum absorption located near the middle separation of the dressed states. In particular, when , the transition amplitudes will be dominant only for a few dressed state around .

We have numerically solved the density matrix equations of the bichromatic coupled three-level system with a continued fraction [27] method and the results are plotted in Fig. 2. Fig. 2(a) presents the calculated probe absorption and dispersion for a moderate coupling Rabi frequency () and the frequency separation of the bichromatic components The absorption spectrum exhibits three peaks, corresponding to the dressed state transition 1 to and . The probe dispersion exhibits a normal steep slope at the absorption minimum near . This implies that the bichromatic EIT medium supports slow photons at frequencies simultaneously. In Fig. 2(b), we plot the calculated probe absorption and dispersion for a strong bichromatic field. The spectrum exhibits more peaks indicating that the transition amplitudes spread to more dressed states. The probe dispersion again shows the normal slope at the absorption minimum, which can be used to obtain slow group velocities simultaneously for photons with different frequencies. Our calculations show that for the optimal performance of two slow photons at frequencies , it is desirable to have a moderate Rabi frequency and ( in order to optimize the slope of the normal dispersion and the = dispersion amplitude).Then the frequency bandwidth of the light pulses should satisfy For comparison, Fig. 2(c) shows the monochromatic EIT spectrum and the corresponding dispersion curve under similar conditions.

We have performed an experimental study of bichromatic electromagnetically induced transparency in a three-level system of cold 87Rb atoms confined in a MOT [28]. The frequency separation of the bichromatic coupling field is 2 (taken as 40 MHz or 80 MHz). The observed probe absorption spectrum is qualitatively different from the spectrum of the usual three-level EIT with a monochromatic coupling field. There are several absorption peaks and transparency dips in bichromatic EIT profile separated in frequency by . We studied the dependence of probe spectrum on the coupling field intensity and the frequency separation and found that the experimental results agree with the theoretical calculations.
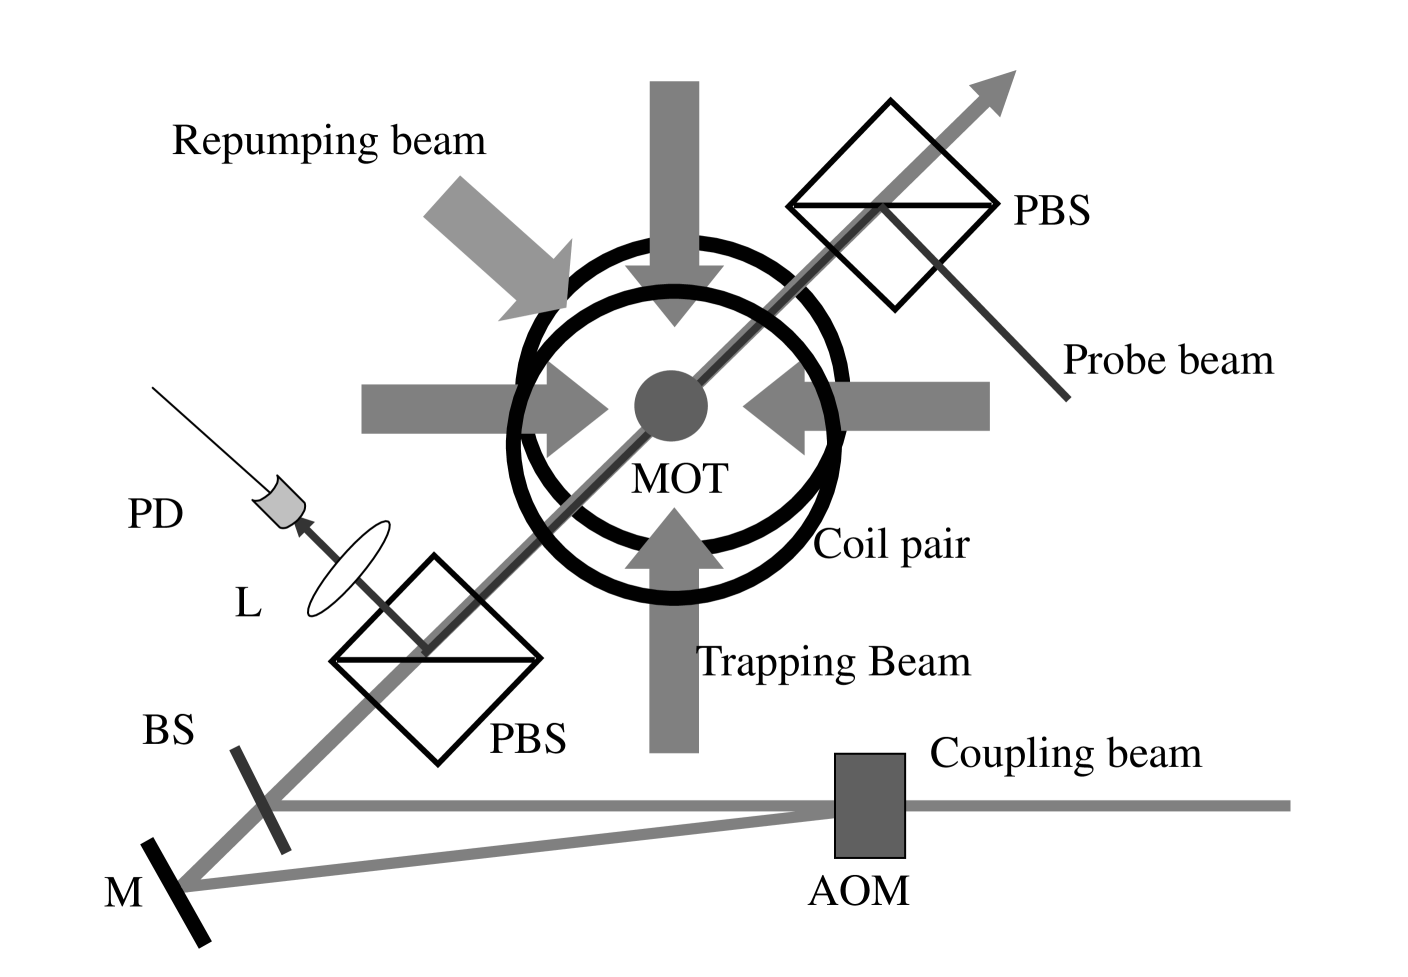
The three-level type EIT system of 87Rb atoms is shown in Fig. 1(a). A bichromatic coupling laser drives the D2 transition , and a weak probe laser with frequency drives the transition , = . The bichromatic coupling field is produced by combining the diffracted zeroth-order and the first-order beams from a single laser beam passing through an acousto-optic modulator (AOM). The two frequencies of the bichromatic field are and with the respective Rabi frequencies . A simplified diagram of the experimental apparatus is depicted in Fig. 3. A homemade octagon quartz cell is used as the MOT cell. The inner pressure of the cell is Pa . The cooling and trapping beam (at 780 nm) is provided by a tapered amplifier diode laser (TOPTICA TA100) and the laser frequency is stabilized by the saturated absorption spectroscopic method. The repumping laser (at 780nm) is provided by an extended-cavity diode laser (TOPTICA DL100). The Coupling laser for the bichromatic EIT study is provided by a Ti: sapphire laser (Coherent MBR 110) with a beam diameter 3 mm. An AOM is used to produce the zeroth-order, and the frequency shifted first-order beams and followed by a mirror and a beam splitter to combine the two beams. Another extended-cavity diode laser (TOPTICA DL100) provides the weak probe beam with a diameter 1 mm. The coupling and probe laser beams are linearly polarized perpendicular to each other. They pass through the MOT in opposite directions and overlap in the path via the polarization beam splitters (PBS). A photodiode (PD) and a digital oscilloscope (Tektronix TDS 220) are used to detect and record the probe attenuation signal.
In the experiment, the trapping laser frequency is red-detuned and then locked [29] by an amount relative to the resonant frequency of the , transition and the repumping laser frequency is locked to the , transition. A near-spherical 87Rb atom cloud with a diameter 3 mm is formed that contains about atoms with the temperature of the atom cloud K. We adjusted the steering mirror of probe beam to optimize the spatial overlap of the probe beam and the cold atom cloud by monitoring the probe absorption amplitude. The maximum absorption of is obtained when we tune the probe frequency to the peak of the transition . Then, the bichromatic coupling laser is applied and overlapped with the probe beam. The intensities of bichromatic beams are balanced via neutral density filters placed before the combing beam splitter. During the experiment, the bichromatic coupling laser is tuned to the line transition , the probe frequency is scanned across the , transition, and the transmitted probe light is detected and recorded. Because the two coupling laser beams have a fixed frequency difference, we define the coupling detuning as , where is the resonant frequency of the 87Rb D2 transition , and is the frequency of the red-detuned component of the bichromatic coupling beams.

Fig. 4 shows the probe absorption spectrum recorded with the frequency separation MHz and the coupling Rabi frequency MHz (the solid line). The average frequency of the bichromatic field is resonant with the atomic transition (). The symmetrical absorption spectrum exhibits three absorption peaks with the neighboring peak separation equal to , the half frequency difference of the bichromatic coupling field. The dashed line in Fig. 4 represents the theoretical fit. The linewidth of the absorption peak is broadened by the Zeeman shifts (the magnetic field is on during the experimental process), the induced decay of the ground state coherence due to the presence of the MOT lasers, and the finite laser linewidth. The calculated results are obtained with a suitable line average to account for the Zeeman spectral broadening.
To produce a bichromatic field with MHz, we use two AOMs (not shown in Fig. 4) with 80 MHz and 120 MHz carrier frequencies and combine the 1st-order diffracted beams of the two AOMs as the bichromatic coupling field. The measured probe absorption spectra are presented in Fig. 5 and 6. The solid lines are the experimental data and dash lines are the theoretical fits. There are more peaks and EIT dips, differing from the probe absorption profile obtained with MHz. The Bichromatic EIT profile also changes with the coupling beam intensity: more peaks appear with stronger coupling field. Fig. 5(a), 5(b), 5(c), and 5(d) are measured with a resonant bichromatic field (), and the coupling Rabi frequencies MHz, 12 MHz, 10 MHz, and 9 MHz respectively.

We also measured the probe absorption spectrum when the average frequency of the bichromatic field is not resonant with the atomic transition (). As expected, the probe absorption profile becomes asymmetrical. Fig. 6 shows the experimental data (solid line) and the calculated results (dashed line) obtained with several different values of . The coupling Rabi frequencies are MHz. Fig. 6(a), 6(b), and 6(c) correspond to = MHz MHz, and MHz, respectively. These measurements agree with the theoretical calculations.

In summary, we have shown that a three-level system coupled by a bichromatic field exhibits multiple absorption peaks, which lead to the normal dispersion curves near the multiple transparent windows. This phenomenon may be used to simultaneously slow down photons at equally spaced frequencies, which may have applications in quantum information processing and quantum nonlinear optics [21, 22]. We have observed such bichromatic EIT in cold 87Rb atoms. The multi-frequency transparency of the probe light occurs under an equal-amplitude bichromatic coupling field, which expands the frequency range of EIT and may improve the controllability of EIT. The number of absorption peaks depends on the intensity and the frequency separation of the bichromatic field. The separation between two adjacent peaks depends on the frequency difference between bichromatic coupling lasers and is independent of the coupling intensity.
We acknowledge the financial support of National Natural Science Foundation of China under Grant Nos. 10104018, 10074072. YZ acknowledges support from the National Science Foundation (Grant No. 0140032).
Email address: wangjin@wipm.ac.cn
REFERENCES
- [1] M. D. Lukin, A. Imamoglu, Nature(London) 413, 273 (2001).
- [2] A. Imamoglu and S. E. Harris, Opt. Lett. 14, 1344 (1989).
- [3] K. J. Boller, A. Imamoglu, and S. E. Harris, Phys. Rev. Lett. 66, 2593 (1991).
- [4] Y. C. Chen, C. W. Lin, and I. A. Yu, Phys. Rev. A 61, 053805 (2000).
- [5] T. van der Veldt, J.-F. Roch, P. Grelu, and P. Grangier, Opt. Commun. 137, 420 (1997).
- [6] S. A. Hopkins, E. Usadi, H. X. Chen, A. V. Durran, Opt. Commun. 138, 185 (1997).
- [7] H. X. Chen, A. V. Durrant, J. P. Marangos, and J. A. Vaccaro, Phys. Rev. A 58, 1545 (1998).
- [8] F. S. Cataliotti, C. Fort, T. W. Häsch, M. Inguscio, and M. Prevedelli, Phys. Rev. A 56, 2221 (1997).
- [9] D. F. Phillips, A. Fleischhauer, A. Mair, R. L. Walsworth, and M. D. Lukin, Phys. Rev. Lett. 86, 783 (2001).
- [10] X. H. Tu, J. Wang, K. J. Jiang, M. He, K. Li, J. Q. Zhong, and M. S. Zhan, Chin. Phys. Lett. 20, 1954 (2003).
- [11] O. Schmidt, R. Wynands, Z. Hussein, and D. Meschede Phys Rev. A 53, R27 (1996).
- [12] L. Vestergaard Hau, S.E. Harris, Z. Dutton, and C. H. Behroozi, Nature(London) 397, 594 (1999).
- [13] C. Liu, Z. Dutton, C.H. Behroozi, and L. Vestergaard Hau, Nature(London) 409, 490 (2001).
- [14] M. G. Payne and L. Deng, Phys. Rev. Lett. 91, 123602 (2003);M. Paternostro, M. S. Kim, and B. S. Ham, Phys. Rev. A 67, 023811 (2003).
- [15] J. E. Thomas, P. R. Hemmer, S. Ezekiel, C. C. Leiby, R. H. Picard, and C. R. Willis, Phys. Rev. Lett. 48, 867 (1982).
- [16] A. Godone, F. Levi, and J. Vanier, Phys. Rev. A 59, 12 (1999).
- [17] S. Knappe, R. Wynands, J. Kitching, H. G. Robinson, and L. Hollberg, JOSA B 18, 1545 (2001).
- [18] S. Knappe, J. Kitching, and L. Hollberg, Appl. Phys. Lett. 81, 553 (2002).
- [19] S. E. Harris, and L. V. Hau, Phys. Rev. Lett. 82, 4611 (1999).
- [20] Y. Wu, J. Saldana, and Yifu Zhu, Phys Rev. A 67, 013811 (2003).
- [21] M. D. Lukin and A. Imamoglu, Phys. Rev. Lett. 84, 1419 (2000).
- [22] D. Petrosyan and G. Kurizki, Phys. Rev. A 65, 033833 (2003).
- [23] Yifu Zhu, Qilin, Wu A. Lezama, D. J. Gauthier, and T. W. Mossberg, Phys. Rev. A 41, 6574 (1990).
- [24] H. Freedhoff, and Z. Chen, Phys. Rev. A 41, 6013 (1990).
- [25] G. S. Agarwal, Y. Zhu, D. J. Gauthier, and T. W. Mossberg, JOSA B 8, 1163 (1991).
- [26] Z. Ficek and H. S. Freedhoff, Phys. Rev. A 48, 3092 (1993).
- [27] H. Risken and H. D. Vollmer, Z. Physik B - Condensed Matter 39, 339 (1980).
- [28] J. Wang, X. J. Liu, J. M. Li, H. T. Zhao, K. J. Jiang, M. S. Zhan, Acta. Opt. Sin. 20, 862 (2000) (in Chinese).
- [29] J. Wang, X. J. Liu, J. M. Li, K. J. Jiang, M. S. Zhan, Chin. J. Quantum Electron. 17, 43 (2000) (in Chinese).