The wave nature of biomolecules and fluorofullerenes
Abstract
We demonstrate quantum interference for tetraphenylporphyrin, the first biomolecule exhibiting wave nature, and for the fluorofullerene using a near-field Talbot-Lau interferometer. For the porphyrins, which are distinguished by their low symmetry and their abundant occurence in organic systems, we find the theoretically expected maximal interference contrast and its expected dependence on the de Broglie wavelength. For the observed fringe visibility is below the expected value, but the high contrast still provides good evidence for the quantum character of the observed fringe pattern. The fluorofullerenes therefore set the new mark in complexity and mass (1632 amu) for de Broglie wave experiments, exceeding the previous mass record by a factor of two.
pacs:
03.65.-w,03.65.Ta,03.75.-b,39.20.+qThe wave-particle duality of massive objects is one of the corner stones of quantum physics. Nonetheless this quantum property is never observed in our everyday world. The current experiments are aiming at exploring the limits to which one can still observe the quantum wave nature of massive objects and to understand the role of the internal molecular structure and symmetry.
Coherent molecule optics was already initiated as early as in 1930 when Estermann and Stern confirmed de Broglie’s wave hypothesis de Broglie (1923) in a diffraction experiment with He atoms and H2 molecules Estermann and Stern (1930). In contrast to the rapidly evolving field of electron and neutron optics, atom optics became only feasible about twenty years ago and has led from experiments with thermal atoms to coherent ensembles of ultra-cold atoms forming Bose-Einstein condensates. Molecule interferometry was only taken up again in 1994 with the first observation of Ramsey-Bordé interferences for I2 Bordé et al. (1994) and with the proof of the existence of the weakly bound He2 in a far-field diffraction experiment Schöllkopf and Toennies (1994). Experiments with alkali dimers in the far-field Chapman et al. (1995) and in near-field Clauser and Li (1997) interferometers followed. Recent interest in molecule optics has been stimulated by the quest for demonstrations of fundamental quantum mechanical effects with mesoscopic objects Arndt et al. (1999, 2002); Bruch et al. (2002).
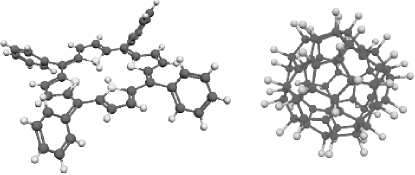
In the present letter, we report the first demonstration of the wave nature of both tetraphenylporphyrin (TPP) and of fluorinated fullerenes using near-field interference. The porphyrin structure is at the heart of many complex biomolecules, serving as a color center for instance in chlorophyll and in hemoglobin. The fluorofullerene is the most massive (1632 amu) and most complex (composed of 108 atoms) molecule for which the de Broglie wave-nature has been shown so far (see fig.1).
In order to demonstrate the wave property of a massive object with a short de Broglie wavelength it is advisable to use a near-field diffraction scheme. In particular a Talbot-Lau-interferometer (TLI, for details see Patorski (1989); Clauser and Li (1994); Brezger et al. (2002, 2003 (in press)) is compact and rugged, has favorable scaling properties, permits to work with acceptable grating constants even for large molecules and allows one to work with an initially uncollimated and spatially incoherent beam. The basic structure of our interferometer has been described elsewhere Brezger et al. (2002). The experiment is set up in a vacuum chamber at a base pressure of mbar, which is sufficient to avoid molecule loss or decoherence by residual gas scattering in the interferometer Hornberger et al. (2003). The molecular beam is created by sublimation in an oven. TPP was heated to 690 K corresponding to a vapor pressure of 46 Pa Perlovich et al. (2000). was sublimated at 560 K with a vapor pressure of 2.3 Pa Boltalina et al. (1999).
The initial thermal velocity distribution is rather broad (full width at half maximum %), both for TPP and for C60F48. We therefore apply a gravitational -selection scheme: three horizontal slits restrict the beam to a well-defined free-flight parabola. The first slit is given by the orifice of the oven (m high). The central height limiter is situated at 138 cm (for TPP) and 126 cm respectively (for C60F48) behind the oven. Its opening is set to m. The third horizontal slit (m) is positioned in 10 cm distance from the molecule detector. For porphyrin we achieve a velocity resolution between % (full width at half maximum) at a mean velocity of vm=160 m/s and % at vm=235 m/s. For the value is at vm=105 m/s. The velocities can be varied by changing the vertical position of the source and they are measured using a time-of-flight method.
The interferometer itself consists of three identical gold gratings with a grating period of nm, a nominal open fraction of and a thickness of b = 500 nm (Heidenhain, Traunreut). The first grating prepares the transverse coherence of the molecular beam. The second grating is responsible for the diffraction and interference. The third grating is used to mask the molecular interference pattern and is therefore already part of the detection scheme, providing high spatial resolution. The distance between the first and the second grating and that between the second and the third grating are equalized to within 100 m and are of the order of the Talbot-length for the most probable wavelength of the thermal molecular beam. They are set to 0.22 m for the porphyrins and to 0.38 m for . The alignment and distance of the gratings have been carefully set in a calibration experiment using . To record the molecular interferogram the third grating is scanned across the molecule beam using a piezo-electric translation stage. The number of transmitted molecules as a function of the third grating position is then the measure for the spatial molecular distribution.
The quantum wave nature of the resulting molecule pattern is reflected in the strong wavelength dependence of the fringe visibility.
A previous Talbot-Lau setup had proven successful before Brezger et al. (2002) but the detector was limited to the special case of fullerenes since it employed a thermal laser ionization scheme which cannot be applied to those molecules which have an ionization energy exceeding the binding energy. In contrast to these earlier experiments, all results presented here were obtained using electron-impact ionization. Although this ionization mechanism has a much lower efficiency than the optical scheme it is more universal and can be applied to virtually any molecule up to a mass of about 2000 amu. The universality of electron impact ionization is important but it also implies the necessity of a mass selection stage to prevent the residual gases in the vacuum chamber from contributing to the signal. In our experiment this selection is done using a quadrupole mass spectrometer (ABB Extrel, 2000 amu).
The first set of experiments reported here were done with meso-tetraphenylporphyrin (TPP), , with a purity of 98 % as purchased from Sigma-Aldrich (fig. 1, left). It has a diameter of 20 Å, which is about twice the size of C60. The flat geometry of TPP (aspect ratio ) is rather different from the highly symmetric structure of the fullerenes which were used in previous studies. One might imagine two possible effects of the asymmetric structure which can influence the interference contrast. First, there could be an orientation-dependent coupling between the molecules and the gratings. Molecules with an anisotropic polarizability will experience an angle dependent phase shift due to the van der Waals interaction with the grating walls. This may change the interference contrast considerably (see e.g. Brezger et al. (2002)). However, at several hundred Kelvins the molecules rotate at a frequency of about which should lead to an effective averaging of orientation dependent effects. Second, the structure might give rise to ’internal’ decoherence. This could be the case if one molecular axis acted as the hand of a pointer showing finally in different directions depending on which path the molecule took through the interferometer. If stray field gradients vary on the scale of the molecular path separation, as for instance caused by patch fields in the grating slits, they might encode which-path information in the internal (e.g. rotational) state. The electric or magnetic moments required for the coupling to the local fields usually grow with increasing size and decreasing symmetry of the molecules.
To confirm the absence of any effect of the molecular geometry on the de Broglie interference it is important to reach experimentally the fringe contrast which is predicted from the description of the center of mass motion and the scalar molecular properties alone.
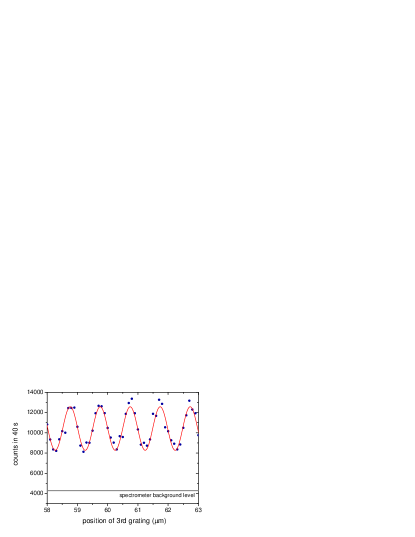
Fig. 2 now shows the TPP interference fringes obtained for a mean velocity of vm=160 m/s as the third grating is shifted in steps of 100 nm across the molecular density profile. At each step the intensity was recorded over a period of 2 seconds. This figure is the average of 20 scans. For our particular grating design quantum mechanics predicts a nearly sinusoidal molecule intensity as a function of the grating displacement Brezger et al. (2003 (in press). We therefore fit a sine function on top of a mean count rate and a fixed, measured background to the data. The fringe visibility is then determined as the ratio of the amplitude to the mean count rate of this fit. The observed contrast is very close to the theoretically predicted value of , and differs significantly from the classically expected value of (see discussion below).
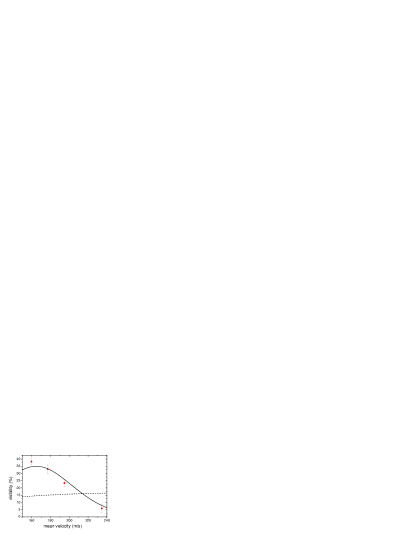
In order to further support the interpretation of our data as being due to the molecular wave-nature we show in fig. 3 (full dots) the wavelength (i.e. velocity) dependence of the fringe contrast. Four different velocity distributions were selected from the initial thermal distribution. For each of them the contrast was determined by averaging 10 scans as described above. The quantum mechanical calculation (continuous line) - which includes the molecule/wall interaction Brezger et al. (2003 (in press) - fits the experimental data rather well within the experimental errors. The error bars in fig. 3 give the measured statistical standard deviation within a series of 10 scans Error .
However, one might argue that a periodic density pattern behind grating three could in principle also result from classical dynamics. Simple shadow images of two gratings are commonly known as moiré fringes. They also depend slightly on the velocity of the passing object if we take into account the molecule-wall interaction. But the classically predicted contrast differs significantly from the measured visibility both in magnitude and in velocity dependence (fig.3, dashed line).
Having proven the perfect contrast for a molecule of low symmetry it is encouraging to investigate a more complex object. is among the heaviest objects that can be thermally vaporized and detected in our mass spectrometer. It was purchased from L. Sidorov (State University Moscow) and had a specified purity of 95 %. The fluorofullerenes are present in several isomers with D3 and S6 symmetry. Typical count rates were only about 100 counts per second (cps) including a spectrometer background of 70 cps with a noise of 30 %. In addition the background increased up to 130 cps towards the last recording. The much reduced signal-to-noise ratio (with respect to TPP), the extended measuring time and the correspondingly larger drifts require a very careful data evaluation:
The total intensity is recorded as a function of the position of the third grating, which was shifted in steps of 40 nm over a distance of m. In total a series of 68 scans were recorded over 5 hours. Every second scan was a background scan, where the source was blocked. Repeated background measurements were necessary since the dark count rate was changing over time. The single scans are shifted with respect to each other due to thermal drifts of the gratings of up to a few 100 nm between subsequent scans. Therefore a simple average of all data is not reasonable.
The best fitting sine curve of each single interference pattern was evaluated using a Fourier transformation and each pattern was shifted to a common origin according to its phase. Averaging over all recorded scans, regardless of their individual quality, yields an interference contrast of 13 %, which would still be explicable in classical terms. However, this includes scans with high background noise which show no interference at all and which lower the resulting contrast considerably. In order to eliminate the noisy graphs without introducing an additional bias by the selection, all scans were sorted according to their -value obtained from the Fourier transformation. The -value is here a measure for the distribution of spatial frequencies in the molecular density pattern. A large occurs if there is more than a single relevant spatial frequency, i.e. it is increasing with increasing deviation from the expected sine wave shape of the interferogram.
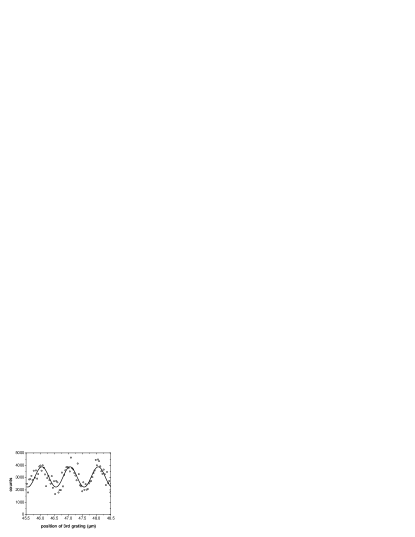
It is important to note that this procedure selects recordings with a clear period, but it explicitly avoids any restrictions on the particular value of this period. Taking only the fraction of all scans with the lowest -value we find an increasing interference contrast for decreasing . A maximal contrast of about is observed for , while single scans are too noisy to reach this value. We estimate the error of the visibility for the selected set to . It is also significant and important that the only high contrast variation in the molecular density pattern is found at the expected spatial period of m. Figure 4 shows three periods of the interference fringes of selected with .
It is important to note that this procedure selects recordings with a clear period but it explicitly avoids any restrictions on the particular value of this period. Taking only those 40 % of all scans with the lowest -value we find an interference contrast of . The statistical error of the selected set amounts to . It is also significant and important that the only observed high contrast variation in the molecular density pattern is found at the expected spatial period of m. Figure 4 shows three periods of the thus selected interference fringes of .
This high visibility is good evidence for the quantum wave character of the interference fringes since it lies significantly above the classically expected contrast of 12 %. However, the expected quantum mechanical value of is still higher than the experimental contrast. Some information on the origin of this discrepancy is provided by the fact that pure C70, which can be detected using cw-laser ionization and which does not suffer from any significant detector noise, exhibits perfect interference in the same Talbot-Lau setup at a velocity of 200 m/s but it shows a contrast reduction by up to 40 % with respect to the numerical calculations for molecules as slow as the fluorofullerenes, i.e. with v m/s.
We are therefore led to assume that the reason for the difference between model and experiment is independent of the molecular species. While we cannot exclude unexpected contributions to the molecule-wall interaction or more fundamental phenomena, it is certain that mechanical vibrations of the setup become more relevant for longer transit times. The strong influence of floor vibrations was already recognized in earlier fullerene interferograms and could be drastically reduced by the pneumatic vibration isolation of the optical table which supports the experiment. But one has to note that grating motions around 100 nm are already detrimental to the interference contrast and slow relative motions can not be excluded with our available vibration sensors. Further investigations are required to clarify this point.
Concluding, we have demonstrated the wave nature of both the biomolecule TPP and the fluorofullerene in a near-field interferometer. The experimental visibilities of the interference fringes have been compared to a quantum and a classical model, both taking into account the grating/wall interaction. For the porphyrin experiment the visibility is in full agreement with predictions by quantum mechanics and in clear disagreement with the classical model. This is also the case for the velocity dependence, i.e. wavelength dependence, of the contrast. For the measured interference contrast is somewhat below the maximally expected quantum visibility but it is still significantly above the classical value. This result provides very good evidence for the wave nature of fluorofullerenes which are therefore currently the largest and most complex molecules to show quantum interference.
This work has been supported by the Austrian Science Foundation (FWF), within the projects START Y177 (M.A.) and SFB F1505, by the DFG Emmy Noether program (K.H.), as well as by the European Community under contract HPRN-CT-2000-00125 (E.R.) and HPMF-CT-2000-00797 (B.B.). We thank O. Boltalina for the preparation of for preliminary studies.
References
- de Broglie (1923) L. de Broglie, Nature 112, 540 (1923).
- Estermann and Stern (1930) I. Estermann and O. Stern, Z. Phys. 61, 95 (1930).
- Bordé et al. (1994) C. Bordé, N. Courtier, F. D. Burck, A. Goncharov, and M. Gorlicki, Phys. Lett. A 188, 187 (1994).
- Schöllkopf and Toennies (1994) W. Schöllkopf and J. P. Toennies, Science 266, 1345 (1994).
- Chapman et al. (1995) M. S. Chapman, C. R. Ekstrom, T. D. Hammond, R. A. Rubenstein, J. Schmiedmayer, S. Wehinger, and D. E. Pritchard, Phys. Rev. Lett. 74, 4783 (1995).
- Clauser and Li (1997) J. L. Clauser and F. Li, in Atom Interferometry, edited by P. R. Berman (Academic Press, San Diego, 1997), pp. 121–151.
- Arndt et al. (1999) M. Arndt, O. Nairz, J. Voss-Andreae, C. Keller, G. van der Zouw, and A. Zeilinger, Nature 401, 680 (1999).
- Arndt et al. (2002) M. Arndt, O. Nairz, and A. Zeilinger, in Quantum [Un]Speakables, edited by R. Bertlmann and A. Zeilinger (Springer, Berlin, 2002), pp. 333–351.
- Bruch et al. (2002) L. W. Bruch, W. Schöllkopf, and J. P. Toennies, J. Chem. Phys. 117, 1544 (2002).
- Troyanov et al. (2001) S. I. Troyanov, P. A. Troshin, O. V. Boltalina, I. N. Ioffe, L. N. Sidorov, and E. Kemnitz, Angew. Chem. Int. Ed. 40, 2285 (2001).
- Patorski (1989) K. Patorski, in Progress in Optics XXVII, edited by E. Wolf (Elsevier Science Publishers B. V., Amsterdam, 1989), pp. 2–108.
- Clauser and Li (1994) J. F. Clauser and S. Li, Phys. Rev. A 49, R2213 (1994).
- Brezger et al. (2002) B. Brezger, L. Hackermüller, S. Uttenthaler, J. Petschinka, M. Arndt, and A. Zeilinger, Phys. Rev. Lett. 88, 100404 (2002).
- Brezger et al. (2003 (in press) B. Brezger, M. Arndt, and A. Zeilinger, J. Opt. B.,5, S82 (2003).
- Hornberger et al. (2003) K. Hornberger, S. Uttenthaler, B. Brezger, L. Hackermüller, M. Arndt, and A. Zeilinger, Phys. Rev. Lett. 90 160401(2003).
- Perlovich et al. (2000) G. L. Perlovich, O. A. Golubchikov, and M. E. Klueva, Journal of Porphyrins and Phthalocyanines 4, 699 (2000).
- Boltalina et al. (1999) O. V. Boltalina, V. Y. Markov, A. Y. Borschevskii, N. A. Galeva, L. N. Sidorov, G. Gigli, and G. Balducci, J. Phys. Chem. B 103, 3828 (1999).
- (18) The mean visibilities of different scan series varied due to uncontrolled external perturbations. The additional error is comparable to the statistical one.