Direct observation of non-classical photon statistics in parametric downconversion
Abstract
We employ a high quantum efficiency photon number counter to determine the photon number distribution of the output field from a parametric downconverter. The raw photocount data directly demonstrates that the source is nonclassical by forty standard deviations, and correcting for the quantum efficiency yields a direct observation of oscillations in the photon number distribution.
pacs:
42.50.Ar,42.50DvQuantum optics Man95 ; Sch01 is concerned with optical phenomena that cannot be described by a classical field treatment. Operationally, photon correlations are measured and nonclassicality is established by violations of correlation inequalities imposed by the assumption that the field is classical. Well known examples are observations of sub-Poissonian photon number statistics Sho83 , photon antibunching Kim77 , and photocurrent fluctuations below the shot noise level for squeezed light sources Slu85 . Although an equivalence between sub-Poissonian statistics and photon antibunching has sometimes been assumed, the two phenomena are distinct revelations of a nonclassical field Sin83 ; Zou90 , and the choice of test for nonclassicality may need to depend on the source. Both measures are adequate to test nonclassicality for resonance fluorescence, but antibunching is certainly not sufficient to identify nonclassicality for two-photon sources such as an atomic cascade Koc67 or parametric downconversion (PDC) Bur70 . Sophisticated demonstrations of nonclassicality for two-photon sources have been employed such as showing complementarity Gra86 or violating a Bell inequality Asp81 . However, direct measurement of the photon number distribution may be sufficient to demonstrate nonclassicality, and such a measurement is appealing because the nonclassicality criterion is strictly based on the actual measurement record, inequalities that arise from a classical field treatment, and no assumptions whatsoever about the source, propagation or pre-photodetection processing.
Direct measurements of the photon number distribution have been elusive for technical reasons, but photon counting technology, namely the visible light photon counter (VLPC) Kim99 ; Tak99 , now provides a means for directly testing nonclassicality for the (bunched) output field from a PDC as we demonstrate here. Although criteria for proving nonclassicality of the source via direct counting have been suggested, such as sub-Poissonian statistics Man79 , observing photon number oscillations Sch87 and deciding if these oscillations are classical or nonclassical Sim97 , or by employing Hillery’s two criteria of comparing the total probabilities of even vs odd photon numbers being detected Hil85 , such criteria are not necessarily practical, especially for a super-Poissonian two-photon source. We introduce a new and practical criterion for evaluating nonclassicality for weak bunched sources of light and show that our PDC source strongly violates this criterion, whereas it does not violate Hillery’s inequalities. Our violation of nonclassicality is the first time that nonclassical light has been unambigously observed by direct photon number detection without any need for assumptions about the source.
Furthermore the relatively innocuous assumption that detector inefficiency is due to linear loss processes enables us to reconstruct from raw data a photon number distribution that exhibits even-odd photon number oscillations, which strongly violate Hillery’s criteria. Although photon number oscillations have been reported Bre97 , these have in fact been inferred by performing optical homodyne tomography and thus involve many assumptions to process the data; in contrast our reconstruction of photon number oscillations requires no assumptions about the source and only one assumption about the loss mechanism for detectors.
.0.1 Test for non-classical statistics
With an ideal (i.e., perfect efficiency) photon number detector, direct observation of PDC output is predicted to exhibit photon number oscillations Sch01 . For example, with the probability of observing photons, an ideal detector should yield and . However, an imperfect detector described by a linear loss model may not directly observe photon number oscillations, and thus we must establish a criteria for photon number statistics to be non-classical. Define as the ratio
| (1) |
For a perfect detector measuring PDC output, we predict ; detector inefficiencies will lead to a reduced value of this ratio.
We now prove that any semi-classical theory of light which is constrained to distributions of Poissonian photon statistics cannot yield states with greater than a maximum classical bound . For a Poisson photon number distribution given by , this ratio has a maximum value , saturated by the Poisson distribution with average photon number . However, one can show that this optimal value holds not only for a Poisson distribution, but for any weighted sum of Poisson distributions. Consider a weighted sum of two Poisson distributions and , where has average photon number , and is any other Poisson distribution. The ratio for this weighted sum is
| (2) |
Because maximizes for any single Poisson distribution, the mathematical relation
| (3) |
proves that . Thus, no sum of Poisson distributions can give rise to a distribution with
All classical light fields will lead to statistics that can be expressed as weighted sums of Poisson photon number states. Thus, the classical theory of light predicts that the inequality
| (4) |
cannot be violated. In contrast, one expects that light from PDC will lead to a violation of this condition, which can be demonstrated by simply measuring , , and .
In the presence of imperfect detection efficiency, loss may serve to degrade this ratio and a violation of the classical criterion may not be observed. Consider a PDC experiment in which the pump is sufficiently weak that the probability of generating more than one photon pair is very small. In this case the ratio in Eq. (1) is given by , where is the detection efficiency. A violation of the inequality is not predicted unless .
Fortunately, the Visible Light Photon Counter (VLPC) has the capability to detect photon number states with high quantum efficiency Kim99 ; Tak99 . The VLPC has been shown to have quantum efficiencies approaching . Furthermore, if more than one photon is incident on the detector surface, the height of the output electrical pulse is proportional to the number of incident photons. This gives us information about the number of photons that have been detected.
.0.2 Observation of non-classical statistics
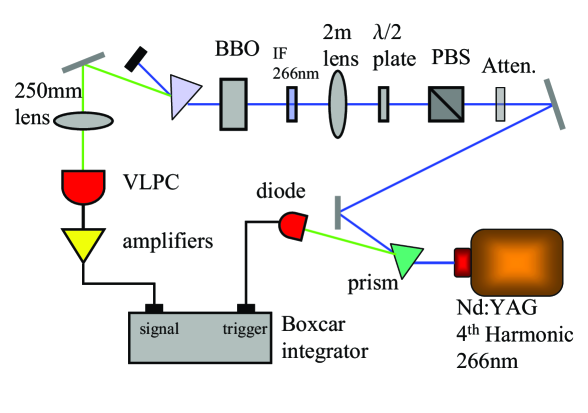
The experimental setup is shown in Fig. 1. We use the fourth harmonic (266nm) of a Q-Switched ND:YAG laser as a pump source. The pulse duration of the laser is 20ns. Using a pulsed pump allows us to eliminate the detector dark counts () by temporal gating. The laser pumps a BBO crystal set for collinear degenerate Type I phase matching (optic axis 47.6 degrees from the pump). In this configuration, the down-converted photons have half the energy of the pump (532nm), and travel in the same direction. The pump is removed by a prism, while the down-conversion is focused by a 250mm lens onto the detector surface. We also have the option of directly illuminating the detector with second harmonic light (532nm) from the laser, which is a classical light source. The detector output is amplified, and then sent to a gated boxcar integrator, which is triggered by the laser. The boxcar integrates the pulse over a 20ns window, and the output is sent to an Analog-to-Digital converter and stored on a computer.
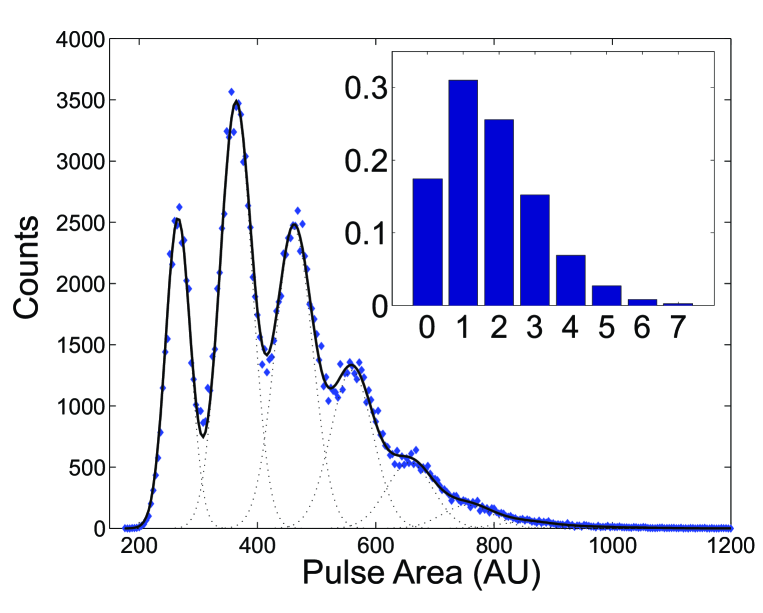
The output of the detector illuminated by light from the second harmonic of the laser is shown in Fig. 2. The pulse area spectrum features a series of peaks representing the different photon number state detections. In the inset we show the probability distribution, which is calculated by fitting each peak to a Gaussian function. The area under each Gaussian curve gives the number of events representing that photon number. The area of each peak can be normalized by the total area to give the probability distribution, which is a Poisson distribution as expected.
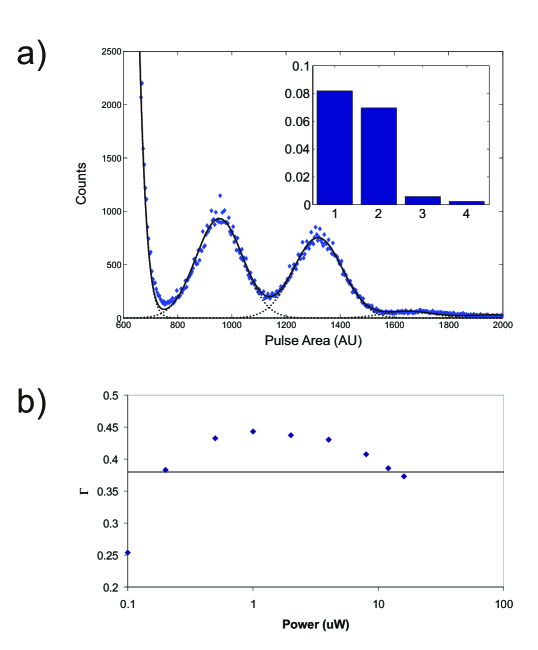
Fig. 3(a) shows the pulse area histogram when the detector is illuminated by parametric down-conversion, using a pump power of . At this weak pump intensity, a single pump pulse will usually generate zero photons, while a photon pair is generated with a small probability. The probability of generating more than one photon pair is very small. The figure focusses on the 1, 2, and 3 photon detection peaks, which we will use to verify non-classical statistics. The photon number probability distribution is calculated by fitting each peak to a Gaussian function. These areas are normalized by the total area of all the peaks. The calculated probability distribution is shown in the inset. One can see that the probability of 1 and 2 photon detection is nearly equal, but the probability of 3 photon detection is nearly zero. These probabilities are , , and , which yields , representing a 40 standard deviation violation of the classical limit.
The large 1 photon probability is due to losses from the detector and collection optics. In the limit of low excitation, the 1 photon and 2 photon probability can be used to calculate the detection efficiency, given by
| (5) |
From the measurements, it is calculated that the detection efficiency is 0.67. Using the measured VLPC quantum efficiency of , the photon collection efficiency is calculated to be .
Fig. 3(b) shows the measured value of as a function of pumping intensity. The black line represents the classical limit, which is violated for a large range of pumping intensities. At high pumping intensities begins to drop. This drop is due to an increase in the two pair creation probability, which, in the presence of losses, will enhance the 3 photon detection probability. The parameter also drops at low pumping intensities. This drop is attributed to the dark counts of the VLPC. At low pumping intensities the relative fraction of detection events originating from dark counts becomes large. This enhances the 1 photon probability, which reduces the value of .
.0.3 Reconstruction of even-odd oscillations
With high detector efficiency, the emitted output of PDC is predicted to feature even-odd photon number oscillations due to the two photon nature of the process. These oscillations lead to the non-classical statistics discussed in the previous section. Direct observation of these oscillations using the photon counting capability of the VLPC would be a remarkable achievement; unfortunately, direct observation of these oscillations requires extremely high quantum efficiencies. Even the relatively high detection efficiencies of in our experiment are not predicted to observe this oscillatory behavior. The requirement of very high quantum efficiency makes direct observation of the photon number oscillation extremely difficult in practice. However, one can make an accurate independent measurement of the photon detection efficiency, and correct for this effect in the photon number distribution. This allows the reconstruction of the original even-odd oscillations of the field.
The detection efficiency can be corrected for as follows. Define as the probability that the photon field contained photons, and as the probability that photons are detected. In the presence of losses, these two distributions are related by
| (6) |
In order to calculate from , the above transformation must be inverted. To perform this inversion, we truncate the photon number distribution at some photon number , which is sufficiently large such that is a good approximation. Under this approximation, the initial and final probability distributions are simply related by a matrix, whose coefficients are given by Eq. (6). The dark counts of the VLPC can also be accounted for by this matrix, which can then be inverted to calculate the photon number distribution of the field. It is important to emphasize that there are no fitting parameters in this model. The only two parameters, the quantum efficiency and dark counts of the VLPC, are both independently measured. Once they are known there is a one-to-one relationship between the actual and measured photon number distribution.
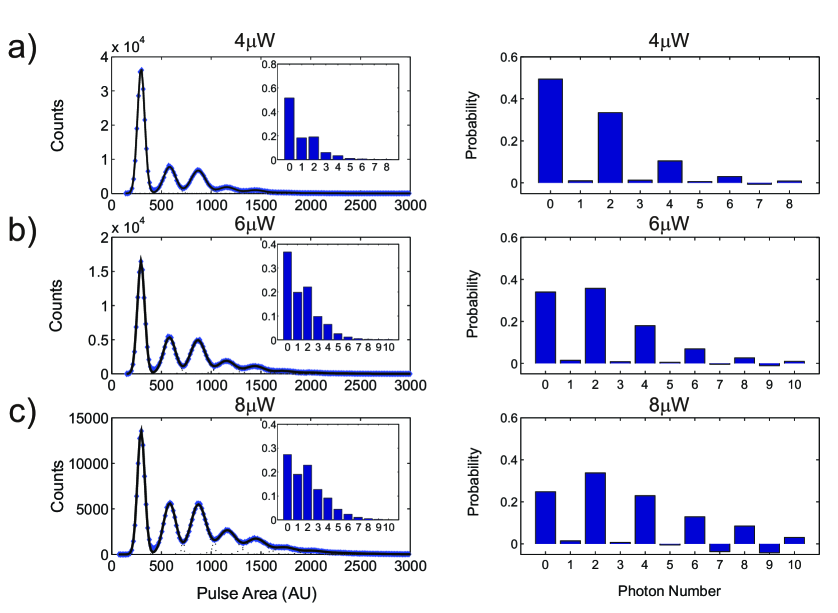
Fig. 4 shows the result of the photon number reconstruction. Three different pumping intensities are shown. For each pump intensity, the left panel shows the pulse area histogram, and the inset to the panel shows the calculated photon probability distribution. The right panel shows the reconstructed photon number distribution using the measured quantum efficiency and backgrounds. The photon number distribution is truncated at 10 photons. The reconstructed probabilities demonstrate very clear even-odd oscillations as predicted from PDC.
At higher photon numbers, it can be seen that the reconstructed distribution becomes slightly negative. This erroneous effect is caused by truncation error. As the pumping intensity is increased, the approximation that the photon distribution can be truncated after 10 photons becomes less accurate. This error manifests itself in the probabilities becoming slightly negative for the 9 and 7 photon probability. This error is worst at the largest pumping intensity of 8, where the truncation approximation is least accurate. One could suppress this error by truncating at a higher photon number. Unfortunately, because of the limited range of the amplifiers and A2D converters, it is difficult to measure these higher order photon numbers in practice. This puts a limit on the pumping power one can use and still get a good reconstruction. It is possible that an improved numerical algorithm over simply putting a cutoff in the number distribution may overcome some of these practical difficulties.
.0.4 Conclusion
In conclusion, we have directly observed non-classical photon counting statistics from PDC. We have shown theoretically that the photon counting statistics for all classical fields must satisfy the inequality given in Eq. (4). Using the high quantum efficiency and photon number detection capability of the VLPC we have experimentally demonstrated violations of this inequality by light emitted from PDC. By correcting for the quantum efficiency and dark counts of the VLPC, we have also succeeded in reconstruction the even-odd oscillation in the photon number distribution of light generated by the down-conversion field.
References
- (1) Also at NTT Basic Research Laboratories, Atsugi, Kanagawa, Japan.
- (2) L. Mandel and E. Wolf, Optical Coherence and Quantum Optics (Cambridge University Press, Cambridge, 1995).
- (3) W. P. Schleich, Quantum Optics in Phase Space (Wiley-VCH, Berlin, 2001).
- (4) R. Short and L. Mandel, Phys. Rev. Lett. 51, 384 (1983).
- (5) H. J. Kimble et al, Phys. Rev. Lett. 39, 691 (1977).
- (6) R. E. Slusher et al, Phys. Rev. Lett. 55, 2409 (1985).
- (7) S. Singh, Opt. Comm. 44, 254 (1983).
- (8) X. T. Zou and L. Mandel, Phys. Rev. A41, 475 (1990).
- (9) C. A. Kocher and E. D. Commins, Phys. Rev. Lett. 18, 575 (1967).
- (10) D. C. Burnham and D. L. Weinberg, Phys. Rev. Lett. 25, 84 (1970).
- (11) P. Grangier et al, Europhys. Lett. 1, 173 (1986).
- (12) A. Aspect et al, Phys. Rev. Lett. 47, 460 (1981).
- (13) J. Kim et al, Appl. Phys. Lett. 74, 902 (1999).
- (14) S. Takeuchi et al, Appl. Phys. Lett. 74, 1063 (1999).
- (15) W. Schleich and J. A. Wheeler, Nature (Lond.) 326, 574 (1987).
- (16) L. Mandel, Opt. Lett. 4, 205 (1979).
- (17) R. Simon et al, eprint quant-ph/9708038 (1997).
- (18) M. Hillery, Phys. Rev. A31, 338 (1985).
- (19) G. Breitenbach et al, Nature (Lond.), 387, 471 (1997).