Spectroscopy by frequency entangled photon pairs
Abstract
Quantum spectroscopy was performed using the frequency-entangled broadband photon pairs generated by spontaneous parametric down-conversion. An absorptive sample was placed in front of the idler photon detector, and the frequency of signal photons was resolved by a diffraction grating. The absorption spectrum of the sample was measured by counting the coincidences, and the result is in agreement with the one measured by a conventional spectrophotometer with a classical light source.
pacs:
42.50.Dv, 42.62.Fi, 42.65.LmI Introduction
The polarization entanglement of spatially separated photon pairs, generated by spontaneous parametric down-conversion (SPDC), has been used in a variety of quantum experiments to demonstrate quantum teleportation, entanglement-based quantum cryptography, Bell-inequality violations, and others Tittel and Weihs (2001).
These SPDC photon pairs are also entangled in their wave vectors. The entanglement in wave-vector space is used in various experiments, such as quantum imaging Shih (2002); Pittman et al. (1995), photonic de Broglie wavelength measurement Fonseca et al. (1999); Jacobson et al. (1995); Edamatsu et al. (2002), quantum interference Strekalov et al. (1995); Hong et al. (1987), and quantum lithography D’Angelo et al. (2001); Shimizu et al. (2003); Boto et al. (2000). It was claimed and experimentally verified that they have higher resolution than the classical limit, which will be used to various applications.
On the other hand, in the case of quantum imaging, the information about the shape of a spatial filter is transferred by entangled photon pairs, therefore it is useful for secure two-dimensional information transfer. Compared with the case using the polarization entanglement, it can send much more information by the entanglement of the wave-vector space taking an advantage of the continuity of the entangled parameter. A protocol for quantum key distribution was proposed based on a system whose dimension is higher than 2 in Ref.Bechmann-Pasquinucci and Tittel (2000).
In this paper, a frequency entanglement was used to measure the spectroscopic property of a sample, which can also be used for nonlocal pulse shaping Bellini et al. (2003). The state was maximally entangled by using a continuous-wave (cw) pump Giovannetti et al. (2002); Grice and Walmsley (1997); Rubin et al. (1994). Focusing the pump on a SPDC crystal by an objective lens, the bandwidth of SPDC was extended. It enabled to measure the absorption spectrum of a sample in broadband. Various types of spectroscopic measurements were performed utilizing classical light source including sophisticatedly constructed extremely short pulses Kobayashi et al. (2001). However, in the following situations, spectroscopy utilizing the frequency entanglement can be a powerful way to measure the spectroscopic properties of the sample.
One of the situations is the case when it is difficult to analyze frequency of photons transmitted through an absorptive sample. For example, to measure the spectroscopic property of a sample in vacuum ultraviolet (VUV) range, a spectrometer must be settled in a vacuum chamber in case of the conventional VUV spectroscopy, and the spectrometer must be aligned and controlled under the vacuum condition. However, in case of spectroscopy using the frequency-entangled photon pair consists of a VUV photon and a longer wavelength photon (like a visible photon), the VUV photon transmitted thorough the sample is to be detected by the photodetector without capability of energy resolution. Instead the visible photon is to be resolved by a spectrometer in the atmospheric pressure which is easily handled. This is one of the useful features of this method. The method is also useful when the sample is in space and the photons transmitted through the sample are not easy to be resolved by their energy.
Another situation is the case when the spectroscopic property of a fragile sample is to be measured in infrared range. The power of the light source must be very low not to damage the sample, and yet an infrared photodetector is usually so noisy that a signal-to-noise ratio is very low in the measurement using the classical light source. However, when the frequency-entangled photon pairs are used, the coincidence counts are measured, then one of the photons of each photon pair works as a timing gate for the measurement of another photon of the pair which is to be resolved by its energy, and the signal-to-noise ratio is expected to be enhanced substantially. This is another advantage of this method.
The SPDC photon pairs are emitted conically from the point where the pump light is focused on the beta-barium borate (BBO) crystal. Using a parabolic mirror, all SPDC photon pairs in the light cones are collimated without achromatic aberration, and travel to a beam splitter without expanding their beam diameters keeping their polarization entanglement. It is not aimed to use the polarization in this experiment, so signal and idler photons are separated from each other by a polarizing beam splitter which destroys the polarization entanglement. When a nonpolarizing beam splitter is used in place of the polarizing beam splitter, the photon pairs detected at the photon counters have polarization entanglement, which can be used for quantum cryptography Waks et al. (2002); Bennett (1992). Therefore using the polarization entanglement and the frequency entanglement simultaneously, it will become possible to implement wavelength-division multiplexing (WDM), quantum cryptography, or WDM quantum key distribution, which can send much more information compared with the case of polarization-only entanglement.
II Experiment
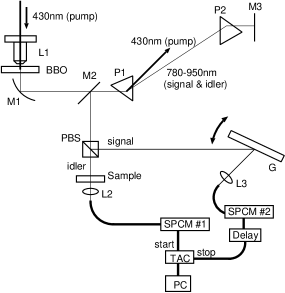
The schematic drawing of our experimental setup is shown in Fig. 1. Frequency-nondegenerate photon pairs are generated by SPDC in a 1-mm-thick type-II BBO (-BaB2O4) crystal pumped by the second harmonic light (1.5 mW) of a cw Ti:sapphire laser operated at 859.4 nm. To generate photon pairs by bandwidth extended SPDC, the pump light is focused on the BBO crystal by a microscope objective lens of 8-mm focal length (L1). Generated SPDC photons diversing from the focal waist are collimated by an off-axis parabolic mirror (M) of 25.4-mm focal length. A prism pair (P1,P2) is used to eliminate the remainder of the pump light, which can be a noise source in the experiments. When the light beam passes through the prism pairs, the beam height was lowered by a mirror (M3), and only the SPDC pairs are picked out by another mirror (M2). The signal and idler photons were separated from each other by a polarizing beam splitter (PBS). Vertically polarized photons (signal) are reflected by the PBS, and diffracted by a grating (G) (1400 grooves/mm). Horizontally polarized photons (idler) pass through the PBS and a partially absorptive sample.
A 2.5-mm-thick plate of Nd3+-doped glass was used as a sample. The main absorption transitions in Nd3+ around the visible spectral range are from to , , , and , of which peak wavelengths are located at about 580, 750, 810, and 870 nm, respectively. The spectrum of signal light is centered at 840 nm, and it overlaps with the absorption peaks at 810 and 870 nm (see Fig. 2), of which transitions are studied in this paper.

Both signal and idler photons are collimated into fibers by lenses (L2,L3) and then detected by a set of two single-photon counting modules (SPCM: EG&G SPCM-AQR-14). Delaying the electric signal from the SPCM detecting signal photons by a nanosecond delay unit (ORTEC 425A), the coincidences are counted by a time-to-amplitude converter/single-channel analyzer (ORTEC 567) followed by a computer-controlled multichannel pulse-height analyzer (MCA:ORTEC TRUMP-PCI-2k).
III Theory
In this paper, we discuss the application of the frequency-entanglement of SPDC photon pairs to absorption spectroscopy. The state of generated SPDC photon pairs can be written as Giovannetti et al. (2002); Grice and Walmsley (1997); Rubin et al. (1994)
| (1) |
where is a single-photon state whose frequency is . is the photon creation operator for frequency photons. Here and indicate the pump, signal, and idler waves, respectively. is the Fourier transform of the classical field of pump laser, and
| (2) |
is the phase-matching function Weiner (1983) with the phase mismatch parameter expressed as
| (3) |
As easily seen from Eq. (2), thinner crystals are preferable for the generation of broadband SPDC photon pairs. Generally, in our quantum experiments using SPDC photon pairs, thick crystals as thick as 5 mm are usually used to obtain high SPDC conversion efficiency. However in this paper broadband SPDC photon pairs are indispensable for its spectroscopic measurement, thin crystal of 1-mm thickness is used.
The wavelength resolution of this system is calculated as 4 nm using , where , , and are a gap of grating grooves( mm), a fiber diameter (m), and a focal length of lens L2 (11 mm), respectively. It is much narrower than the full width of the parametric fluorescence spectrum.
Since a cw laser is being used as a pump, the pump bandwidth is also much narrower than the width of the parametric fluorescence spectrum. It forces the sum of signal and idler frequency to be equal to the pump frequency as , and it entangles a SPDC photon pair in its frequency as a signal photon at frequency is generated with an idler photon at frequency .
The wavelength resolution of the system and the pump bandwidth are so narrow that, using some approximations, the absorption spectrum of the sample can be easily calculated as Lvovsky et al. (2001); Aichele et al. (2002)
| (4) |
where is a coincidence counting rate when the sample was placed in the idler path, and is the one without the sample.
IV Results and Discussion
Figure 3 shows coincidence counts accumulated for 30 s without a sample when the grating angle is set to diffract the center wavelength of signal light, and the coincidence counts have a peak at the delay time of 18 ns determined by the delay unit.

Coincidence counts averaged from 5 to 45 ns except between 14 and 22 ns delay is used for the calculation of a background noise. In this paper, coincidence sum counts is obtained by the integration of the coincidence counts during the delay from 14 to 22 ns and by subtracting the background noise.
Rotating the grating around the vertical axis crossing the incident point of the idler beam, coincidence counts are accumulated for 120 s at each step without a sample. The dashed curve in Fig. 4 shows the wavelength dependence of the sum of coincidence counts at each step (coincidence spectrum). The center wavelengths of the signal and idler are centered at 883 and 840 nm, respectively, and the full width at half maximums (FWHMs) are 63 and 69 nm, respectively.

Then, rotating the grating, coincidence spectrum was measured with the Nd3+-doped glass sample in the idler light path, accumulating for 120 s at each step (see Fig. 4). The wavelength calibration is performed using a reflection, zeroth-order diffraction, from the grating. Beside the center wavelength of the SPDC light, the glass sample has two absorption peaks at about 810 and 870 nm (see Fig. 2), so the idler photons are absorbed and the coincidence counts are reduced in the spectral ranges.

By dividing the coincidence spectrum without a sample by one with the sample, the absorption spectrum of the sample is calculated, and compared with one measured by a UV-visible-near-infrared spectrophotometer in Fig. 5. The absorption spectrum determined from the ratio of the coincidence counts fits fairly well with the one measured by the conventional spectrophotometer except in the spectral range from 860 to 880 nm, where the sample absorbance is large and the amount of transmitted photons is so small that the error tends to be substantially large.
V Conclusion
In conclusion, the absorption spectrum of the Nd3+-doped glass plate was measured using an frequency-entangled two-photon state generated by spontaneous parametric down-conversion. This method is performed without resolving the frequency of idler photons which transmit through the sample. It is greatly advantageous in the case when the transmitted photons are not easy to be resolved by their energy, like in vacuum ultraviolet range or in space. The method using the frequency entangled photon pairs has an advantage over the one using classical method, when the spectroscopic property of a fragile sample is analyzed in a spectral range where any low-noise photodetector is not available, like in infrared range. Not to damage fragile samples, the pump light power must be very low, but the photodetector for a infrared range is usually so noisy that it is difficult to measure the characteristics under such situation. However, using the frequency-entangled photon pairs, one of the photon of each pair can be used as a timing gate for the other photon of the pair resolved by its energy. It increases the signal-to-noise ratio, so the measurement becomes much easier than the case using the classical spectroscopy apparatus.
A type-II BBO crystal is used for production of SPDC photon pairs entangled in polarization. All photon pairs in the SPDC light cones are collimated by a parabolic mirror, and travel to a beam splitter. In this experiment, a polarizing beam splitter was used to separate signal and idler photons from each other effectively. However it destroys the polarization entanglement. Using a nonpolarizing beam splitter in place of the polarizing beam splitter, the SPDC photon pairs detected at photon counters have the polarization entanglement besides the frequency entanglement, and it will enable WDM cryptography to be implemented which has an ability to send much more information than the case not using the frequency entanglement.
We thank Dr. Haibo Wang and Tomoyuki Horikiri for their valuable discussion.
References
- Tittel and Weihs (2001) W. Tittel and G. Weihs, in Quantum Information and Computation (Rinton Press, Princeton, New Jersey, 2001), vol. 1, pp. 3–56.
- Shih (2002) Y. Shih, J. Mod. Opt. 49, 2275 (2002).
- Pittman et al. (1995) T. B. Pittman, Y. H. Shih, D. V. Strekalov, and A. V. Sergienko, Phys. Rev. A 52, 3429 (1995).
- Fonseca et al. (1999) E. J. S. Fonseca, C. H. Monken, and S. Pádua, Phys. Rev. Lett. 82, 2868 (1999).
- Jacobson et al. (1995) J. Jacobson, G. Björk, I. Chuang, and Y. Yamamoto, Phys. Rev. Lett. 74, 4835 (1995).
- Edamatsu et al. (2002) K. Edamatsu, R. Shimizu, and T. Itoh, Phys. Rev. Lett. 89, 213601 (2002).
- Strekalov et al. (1995) D. V. Strekalov, A. V. Sergienko, D. N. Klyshko, and Y. H. Shih, Phys. Rev. Lett. 74, 3600 (1995).
- Hong et al. (1987) C. K. Hong, Z. Y. Ou, and L. Mandel, Phys. Rev. Lett. 59, 2044 (1987).
- D’Angelo et al. (2001) M. D’Angelo, M. V. Chekhova, and Y. Shih, Phys. Rev. Lett. 87, 013602 (2001).
- Shimizu et al. (2003) R. Shimizu, K. Edamatsu, and T. Itoh, Phys. Rev. A 67, 041805 (2003).
- Boto et al. (2000) A. N. Boto, P. Kok, D. S. Abrams, S. L. Braunstein, C. P. Williams, and J. P. Dowling, Phys. Rev. Lett. 85, 2733 (2000).
- Bechmann-Pasquinucci and Tittel (2000) H. Bechmann-Pasquinucci and W. Tittel, Phys. Rev. A 61, 062308 (2000).
- Bellini et al. (2003) M. Bellini, F. Marin, S. Viciani, A. Zavatta, and F. T. Arecchi, Phys. Rev. Lett. 90, 043602 (2003).
- Giovannetti et al. (2002) V. Giovannetti, L. Maccone, J. H. Shapiro, and F. N. C. Wong, Phys. Rev. Lett. 88, 183602 (2002).
- Grice and Walmsley (1997) W. P. Grice and I. A. Walmsley, Phys. Rev. A 56, 1627 (1997).
- Rubin et al. (1994) M. H. Rubin, D. N. Klyshko, Y. H. Shih, and A. V. Sergienko, Phys. Rev. A 50, 5122 (1994).
- Kobayashi et al. (2001) T. Kobayashi, T. Saito, and H. Ohtani, Nature (London) 414, 531 (2001).
- Waks et al. (2002) E. Waks, K. Inoue, C. Santori, D. Fattal, J. Vuckovic, G. S. Solomon, and Y. Yamamoto, Nature (London) 420, 762 (2002).
- Bennett (1992) C. H. Bennett, Phys. Rev. Lett. 68, 3121 (1992).
- Weiner (1983) A. M. Weiner, IEEE J. Quant. Electron. 19, 1276 (1983).
- Lvovsky et al. (2001) A. I. Lvovsky, H. Hansen, T. Aichele, O. Benson, J. Mlynek, and S. Schiller, Phys. Rev. Lett. 87, 050402 (2001).
- Aichele et al. (2002) T. Aichele, A. I. Lvovsky, and S. Schiller, Eur. Phys. J. D 18, 237 (2002).