Atomic Qubit Manipulations with an Electro-Optic Modulator
P. J. Lee, B. B. Blinov, K. Brickman, L. Deslauriers, M. J. Madsen, R. Miller, D. L. Moehring, D. Stick, and C. Monroe
FOCUS Center and Department of Physics, University of Michigan, Ann Arbor, MI 48109-1120
Abstract
We report new techniques for driving high-fidelity stimulated Raman transitions in trapped ion qubits. An electro-optic modulator induces sidebands on an optical source, and interference between the sidebands allows coherent Rabi transitions to be efficiently driven between hyperfine ground states separated by in a single trapped ion.
OCIS codes: 020.7010, 020.1670, 300.6520, 270.0270.
A collection of trapped atomic ions is one of the most attractive candidates for a large-scale quantum computer [1, 2, 3, 4]. Ground-state hyperfine levels within trapped ions can act as nearly ideal quantum bit memories and be measured with essentially perfect quantum efficiency [5]. Qubits based on trapped ions can be entangled by applying appropriate radiation that couples the internal levels of the ions with their collective quantum motion [1, 6, 7, 8]. Such quantum logic gates are best realized with stimulated Raman transitions (SRT), involving two phase-coherent optical fields with frequency difference equal to the hyperfine splitting of the ion [9, 10, 11]. These fields are far detuned from the excited state, making decoherence due to spontaneous Raman scattering negligible, though the SRT coupling itself vanishes when the detuning becomes much larger than the excited state fine-structure splitting[2]. We therefore desire qubit ions such as or that have a large fine-structure splitting. Such ions also exhibit a large ground-state hyperfine splitting, making it difficult to span the frequency difference with conventional acousto-optic modulators. In this letter, we describe several methods for driving SRT in trapped ions using a high frequency electro-optic phase modulator (EOM).
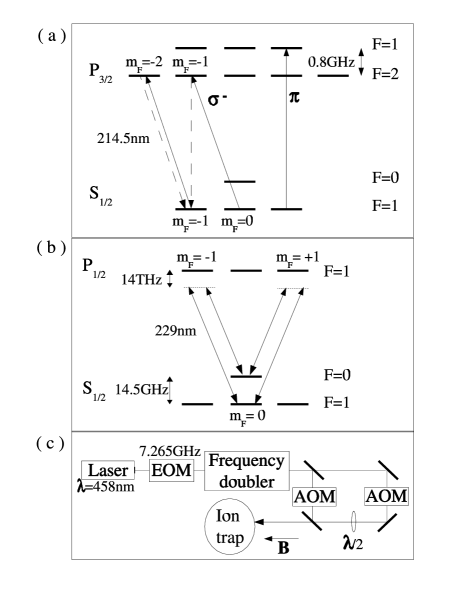
The experiment is conducted in an asymmetric quadrupole rf ion trap, as described in previous work [12]. Qubits are stored in the and ground state hyperfine levels of a single trapped ion (nuclear spin ), with a frequency splitting of [13], as shown in figure 1b.
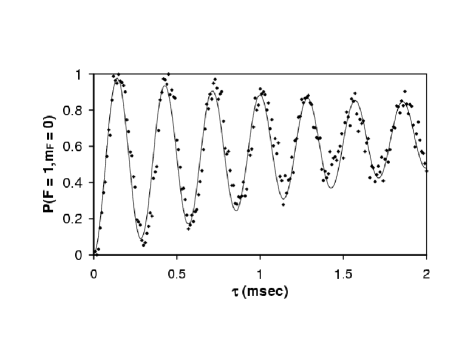
Rabi oscillations are measured by performing the following sequence: (see Fig 1)(i) The ion is optically pumped to the qubit state by -polarized radiation resonant with the transition. (ii) SRT are driven by applying the electro-optic modulated Raman beams to the ion for time . (iii) The qubit state is measured by collecting the ion fluorescence from a pulse of -polarized radiation resonant with the cycling transition . This sequence is repeated multiple times for each , and the Rabi frequency is extracted from the averaged fluorescence oscillation in time (an example is shown in Figure 2).
We use a tunable frequency-quadrupled Ti:Sapphire laser operating near 214.5nm for the resonant optical pumping and detection steps (i) and (iii). For the SRT in step (ii), a 458nm laser is phase-modulated with a resonant EOM at and subsequently frequency doubled. The blue optical field following the EOM can be written as
| (1) |
where is the unmodulated field amplitude, is the n-th order Bessel function with modulation index , and . We couple the beam into a build-up cavity containing a BBO crystal for sum frequency generation. The free spectral range (fsr) of the cavity is carefully tuned to be 1/4 of the modulation frequency so that the carrier and all the sidebands resonate simultaneously. The resulting ultraviolet radiation consists of a comb of frequencies centered at 229nm and separated by . The carrier is detuned by from the excited state (the fine-structure splitting between and is ), resulting in an expected probability of spontaneous emission per Rabi cycle of . At the output of the cavity the electric field becomes
| (2) |
where is the harmonic conversion efficiency (assumed constant over all frequencies considered). All pairs of spectral components of electric field separated by frequency can individually drive SRT in the ion, but the net Rabi frequency vanishes due to a destructive interference. Therefore, the relative phases and/or amplitudes of the spectral components in Eq 2 must be modified in order to drive SRT. We present three schemes below.
One approach is to employ a Mach-Zehnder (MZ) interferometer, where the beam is split and recombined at another location with path length difference (see figure 1c). The expression for the Rabi frequency is
| (3) |
where and are the matrix elements of the electric dipole moment for a transition between the respective hyperfine states and the excited state, and the fields are time-averaged under the rotating wave approximation (). The base Rabi frequency pertains to the usual case of SRT with a pair of monochromatic Raman beams separated in frequency by and each with field amplitude . For , where is an integer, the Rabi frequency can be as high as for . One drawback to the form of Eq 3 is that the factor in the cosine requires optical stability of the MZ interferometer. This can be circumvented by introducing a relative frequency shift between the two paths of the MZ. This shift can be compensated by changing the modulation frequency of the EOM by , resulting in a Rabi frequency of
| (4) |
where . Note that the cosine term has been replaced by a phase factor , thus eliminating the effects of small changes in on the magnitude of the Rabi frequency. In this case, the SRT Rabi frequency can be as high as for and , where is an integer.
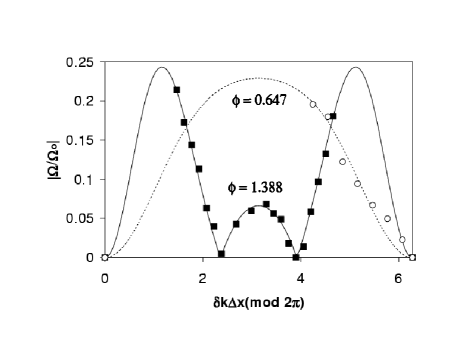
In the experiment, we set to be and measure the Rabi frequency as the relative path length of the MZ is varied. We fit to Eq 4 to extract the modulation index , which is also independently measured with a Fabry-Perot spectrum analyzer. The results are plotted in Figure 3. The dependence on gross path length difference with spatial period is clearly visible [14].
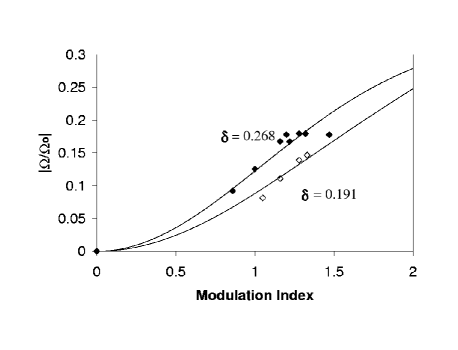
We also shaped the sideband spectrum without using a MZ interferometer by detuning the fsr of the frequency doubling cavity slightly from a subharmonic of the EOM frequency. This detuning modifies the amplitude and phase of each sideband with respect to the carrier, resulting in a Rabi frequency of
| (5) |
where is the number of cavity linewidths by which the first sideband is detuned from a cavity resonance. Figure 4 displays versus for various cavity detunings, and the data agree with Eq 5.
Another possible scheme involves the suppression of certain spectral components. By setting the fsr of the cavity to be where n is an integer, only alternating sidebands will resonate. When the even or odd sidebands are selected, we find
| (6) |
| (7) |
The maximum is at modulation frequency , while the maximum is at .
The techniques reported here have been extended to drive SRT between internal and motional states of trapped ions for entangling quantum logic operations. Here, the modulated Raman beams are split with a beamsplitter and recombined at the ion with non-copropagating wavevectors. The resulting MZ interferometer gives rise to Rabi oscillations according to Eqs 3 or 4, with the additional dependence on the motional state of the ion[2]. In addition, by inserting an appropriate relative frequency shift between the arms of the interferometer, the resulting pair of offset frequency combs can be used to implement the Molmer-Sorensen bichromatic quantum logic gate scheme[7, 3].
In summary, we have used a high-frequency EOM to demonstrate SRT Rabi oscillations on a single trapped ion with a frequency separation of , where spontaneous emission is expected to be negligible. The techniques of shaping the sideband spectrum or creating an interference pattern between multiple modulated beams results in efficient use of the optical power for SRT. This new tool for coherent control of single ions brings us one step forward in buiding higher fidelity quantum logic gates.
We wish to acknowledge useful discussions with Ralph Conti and Chitra Rangan. This work was supported by the U.S. National Security Agency and the Advanced Research and Development Activity under U.S. Army Research Office contract DAAD19-01-1-0667, and the National Science Foundation ITR Program.
References
- [1] J. I. Cirac and P. Zoller, Phys. Rev. Lett. 74, 4091 (1995).
- [2] D. J. Wineland, C. Monroe, W. M. Itano, D. Leibfried, B. E. King, and D. M. Meekhof, J. Res. Nat. Inst. Stand. Tech. 103, 259 (1998).
- [3] A. Sørensen and K. Mølmer, Phys. Rev. Lett. 82, 1971 (1999).
- [4] D. Kielpinski, C. Monroe, and D. J. Wineland, Nature 417, 709 (2002).
- [5] R. Blatt and P. Zoller, Eur. J. Phys. 9, 250 (1988).
- [6] C. Monroe, D. M. Meekhof, B. E. King, W. M. Itano, and D. J. Wineland, Phys. Rev. Lett. 75, 4714 (1995).
- [7] K. Mølmer and A. Sørensen, Phys. Rev. Lett. 82, 1835 (1999).
- [8] C. A. Sackett, D. Kielpinski, B. E. King, C. Langer, V. Meyer, C. J. Myatt, M. Rowe, Q. A. Turchette, W. M. Itano, D. J. Wineland, and C. Monroe, Nature 404, 256 (2000).
- [9] J. E. Thomas, P. R. Hemmer, S. Ezekiel, C. C. Leiby, Jr., R. H. Picard, and C. R. Willis, Phys. Rev. Lett. 48, 867 (1982).
- [10] M. Kasevich and S. Chu, Phys. Rev. Lett. 69, 1741 (1992).
- [11] C. Monroe, D. M. Meekhof, B. E. King, S. R. Jefferts, W. M. Itano, D. J. Wineland, and P. Gould, Phys. Rev. Lett. 75, 4011 (1995).
- [12] B. Blinov, L. Deslauriers, P. Lee, M. Madsen, R. Miller, and C. Monroe, Phys. Rev. A 65, 040304 (2002).
- [13] U. Tanaka, H. Imajo, K. Hayasaka, R. Ohmukai, M. Watanabe, and S. Urabe, Phys. Rev. A 53, 3982 (1996).
- [14] M. Kasevich and S. Chu, Appl. Phys. B 54, 321 (1992).