Demonstration of Dispersion-Cancelled Quantum-Optical Coherence Tomography
Abstract
We present an experimental demonstration of quantum optical coherence tomography (QOCT). The technique makes use of an entangled twin-photon light source to carry out axial optical sectioning. QOCT is compared to conventional optical coherence tomography (OCT). The immunity of QOCT to dispersion, as well as a factor of two enhancement in resolution, are experimentally demonstrated.
PACS numbers: 42.50.Nn, 42.50.Dv, 42.30.Wb
Optical coherence tomography (OCT) has become a versatile and useful biological imaging technique Fuj1 ; Fuj2 ; Schmidt-Review , particularly in ophthalmology Ophthalmology , cardiology Cardiology , and dermatology Dermatology . It is an interferometric scheme that makes use of a light source of short coherence time (broad spectrum) SalehTeich to carry out axial sectioning of a biological specimen. Axial resolution is enhanced by increasing the spectral bandwidth of the source (sub-micrometer resolution has recently been achieved by using a light source with a bandwidth of 325 nm SubmicronRes ). However, as the bandwidth is increased the effects of group-velocity dispersion becomes increasingly deleterious DispersionEffects . Various techniques have been used in attempts to counteract the effects of dispersion, but these require a priori knowledge of the dispersion intrinsic to the specimen DispersionCorrection1 .
A quantum version of OCT that makes use of an entangled twin-photon light source has recently been proposed Abouraddy . A particular merit of quantum-optical coherence tomography (QOCT) is that it is inherently immune to dispersion by virtue of the frequency entanglement associated with the twin-photon pairs Franson ; Kwiat ; Larchuk . Moreover, for sources of the same bandwidth, the entangled nature of the twin photons provides a factor of two enhancement in resolution relative to OCT.
In this letter we report the first experimental demonstration of QOCT, and show that the technique is indeed insensitive to group-velocity dispersion. A parallel experiment using conventional OCT with a source of the same bandwidth is conducted to provide a direct comparison of the two techniques. Using the reflections from the two surfaces of a fused-silica sample buried under a 10-mm-thick ZnSe window (a highly dispersive material) as a sample, we obtain an improvement in resolution by a factor of approximately 5. This improvement arises from the concatenation of two effects: dispersion cancellation and the factor-of-two advantage.
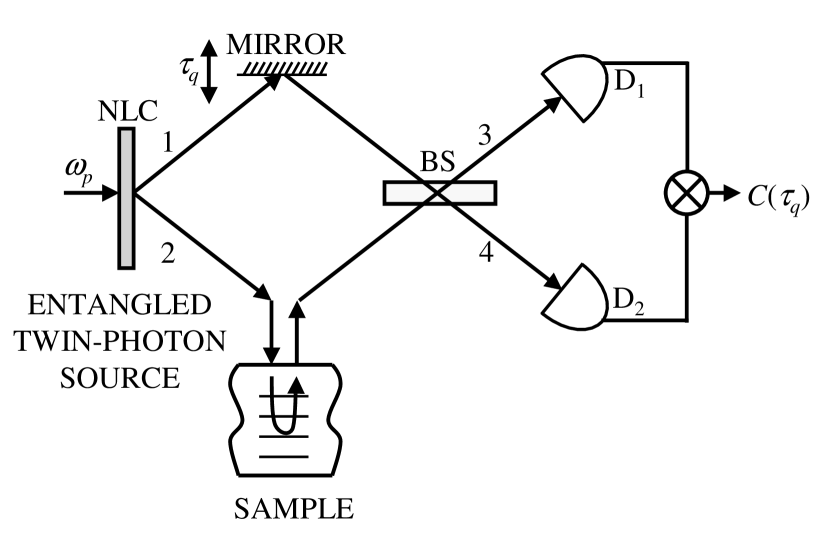
We begin with a brief discussion of the principle underlying QOCT (for a comparative review of the theories of QOCT and OCT the reader is referred to Ref. Abouraddy ). A schematic of the QOCT arrangement is illustrated in Fig. 1. The entangled twin photons may be conveniently generated via spontaneous parametric down-conversion (SPDC) MandelWolf . In this process a monochromatic laser beam of angular frequency , serving as the pump, is sent to a second-order nonlinear optical crystal (NLC). A fraction of the pump photons disintegrate into pairs of downconverted photons. Both downconveted photons have the same polarization and central angular frequency , corresponding to type-I degenerate SPDC. We direct our attention to a noncollinear configuration, in which the photons of the pairs are emitted in selected different directions (modes), denoted 1 and 2. Although each of the emitted photons has a broad spectrum in its own right, the sum of the angular frequencies must always equal by virtue of energy conservation.
The twin-photon source is characterized by the frequency-entangled state
| (1) |
where is the angular frequency deviation about the central angular frequency of the twin-photon wave packet, is the spectral probability amplitude, and the spectral distribution is normalized such that . For simplicity we assume to be a symmetric function. Each photon of the pair resides in a single spatial mode, indicated by the subscripts 1 and 2 in Eq. (1).
The schematic illustrated in Fig. 1 has, at its heart, the two-photon interferometer considered by Hong, Ou, and Mandel (HOM) HOM . The conventional HOM configuration is modified by placing the sample to be probed in one arm and an adjustable temporal delay () in the other arm. The entangled photons are directed to the two input ports of a symmetric beam splitter (BS). Beams 3 and 4 at its output ports are directed to two single-photon-counting detectors, D1 and D2, respectively. The coincidence rate of photons arriving at the two detectors, , is recorded within a time window determined by a coincidence circuit (indicated by ).
An experiment is conducted by sweeping the temporal delay and recording the interferogram . If a mirror were to replace the sample, this would trace out a dip in the coincidence rate whose minimum would occur when arms 1 and 2 of the interferometer had equal path lengths. This dip would result from interference of the two photon-pair probability amplitudes, viz. reflection or transmission of both photons at the beam splitter.
For simplicity, we neglect losses in this exposition. A weakly reflecting sample is then described by a transfer function , characterizing the overall reflection from all structures that comprise the sample, at angular frequency :
| (2) |
The quantity is the complex reflection coefficient from depth and is the round-trip phase accumulated by the wave while travelling through the sample to depth . As shown previously Abouraddy , the coincidence rate is then given by
| (3) |
where
| (4) |
and
| (5) |
represent the constant and varying contributions, respectively. The interferogram yields useful information about the transfer function and hence about the reflectance Abouraddy .
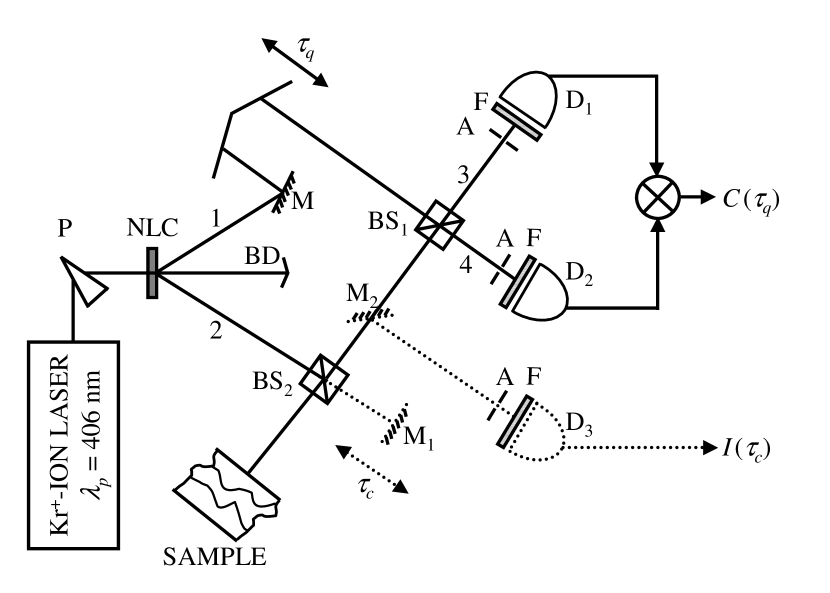
The details of the QOCT experimental arrangement are shown in Fig. 2. For QOCT scans, the dotted components (mirrors M1 and M2, as well as detector D3) are removed. The entangled photons, centered about and emitted in a non-collinear configuration, travel in beams 1 and 2. The photon in beam 1 travels through a temporal delay before it enters the input port of the first beam splitter, BS1. The second photon in beam 2 goes through a second beam splitter, BS2, which ensures normal incidence onto the sample. The photon returned from the sample is directed to the other input port of BS1. Beams 3 and 4, at the output of BS1, are directed to D1 and D2, respectively.
For OCT scans, the photons in beam 1 are discarded and mirrors M1 and M2 remain in place (see Fig. 2). The photons in beam 2 serve as a short-coherence-time light source. The reflections from the sample and mirror M1, after recombination at beam splitter BS2 are directed to detector D3 via mirror M2. The result is a simple Michelson interferometer, the standard configuration for OCT. To conduct an experiment, the temporal delay is swept and the singles rate is recorded, forming the OCT interferogram . This arrangement permits a fair comparison between QOCT and OCT since both make use of a light source with identical spectrum.
The initial experiment makes use of a thin fused-silica window as the sample. The transfer function is then given by
| (6) |
where the reflectances from the front and back surfaces are at normal incidence; = 90 m is the sample thickness (which is greater than the 37-m coherence length of the source), is the speed of light in vacuum, and is the refractive index of the fused silica (which is taken to be independent of by virtue of the low dispersiveness of the material). Under these conditions, Eqs. (4), (5), and (6) yield
| (7) |
and
| (8) |
where is the Fourier transform of the source spectrum . Substituting Eqs. (7) and (8) into Eq. (3) yields an interferogram that contains the three varying terms in Eq. (8).
The first two terms in Eq. (8) are dips arising from reflections from each of the two surfaces. They are separated by and are expected to exhibit 50 visibility since . The third term, which appears midway between the two dips, arises from interference between the probability amplitudes associated with these reflections. This term changes from a hump to a dip depending on the values of , , , and the arguments of and .
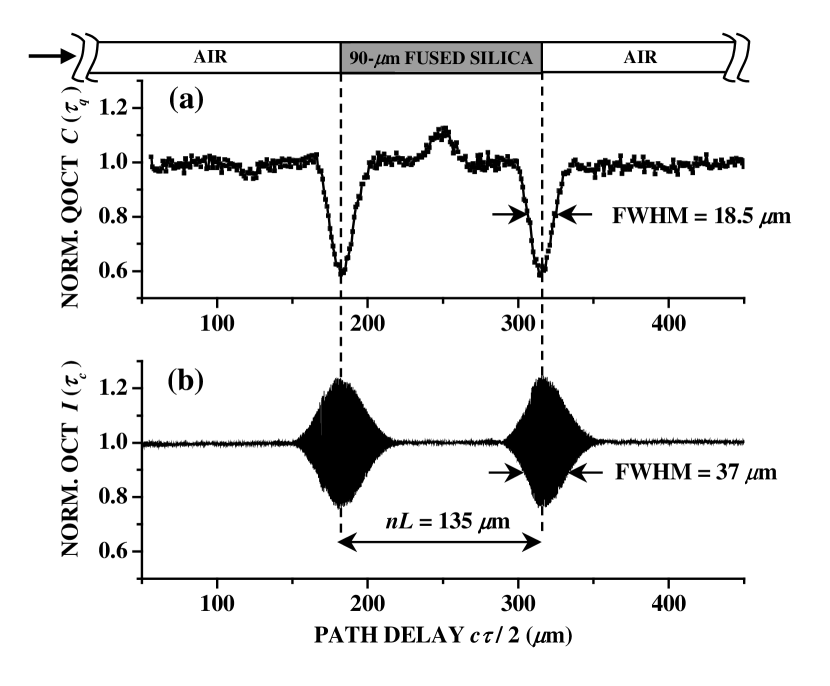
The experimental QOCT interferogram for this sample, normalized to , is plotted in Fig. 3a. The two dips, separated by the optical path length of the sample = 135 m, exhibit 45 visibility, in close agreement with the theoretically expected value of 50. The abscissa is represented in units of the scaled temporal delay , representing the physical displacement of the delay line, so that stands for and alike.
The OCT interferogram for the same sample is expected to consist of two interference-fringe envelopes, each with visibility calculated to be 30, separated by . The experimental OCT interferogram for this sample, normalized to the constant background, is shown in Fig. 3b. The centers of the envelopes, separated by = 135 m, exhibit 28 visibility.
It is apparent that the 18.5-m FWHM of the dips observed in QOCT provides a factor of 2 improvement in resolution over the 37-m FWHM of the envelopes observed in OCT. This improvement, which is in accord with theory Abouraddy , ultimately results from the entanglement inherent in the nonclassical light source used in QOCT.
To demonstrate the dispersion-cancellation capability of QOCT, we bury the sample under a highly dispersive medium and carry out a QOCT/OCT experiment, as described above. The transfer function of this composite sample is then , where the transfer function of the fused-silica window is given by Eq. (6), is the wave number in the dispersive medium, and is the thickness of the dispersive medium. We expand to second order in : , where is the inverse of the group velocity at , and represents group-velocity dispersion (GVD) SalehTeich .
Substituting into Eq. (5), the QOCT varying term for the buried sample turns out to be
| (9) |
which is simply a displaced version of the result obtained for the sample in air, as provided in Eq. (8). Neither nor the GVD parameter appear in Eq. (9); nor, in fact, do any higher even-order terms. The cancellation of GVD is an important signature of QOCT. In OCT does not cancel and the result is a degradation of depth resolution and a reduction of the signal-to-noise ratio DispersionCorrection1 .
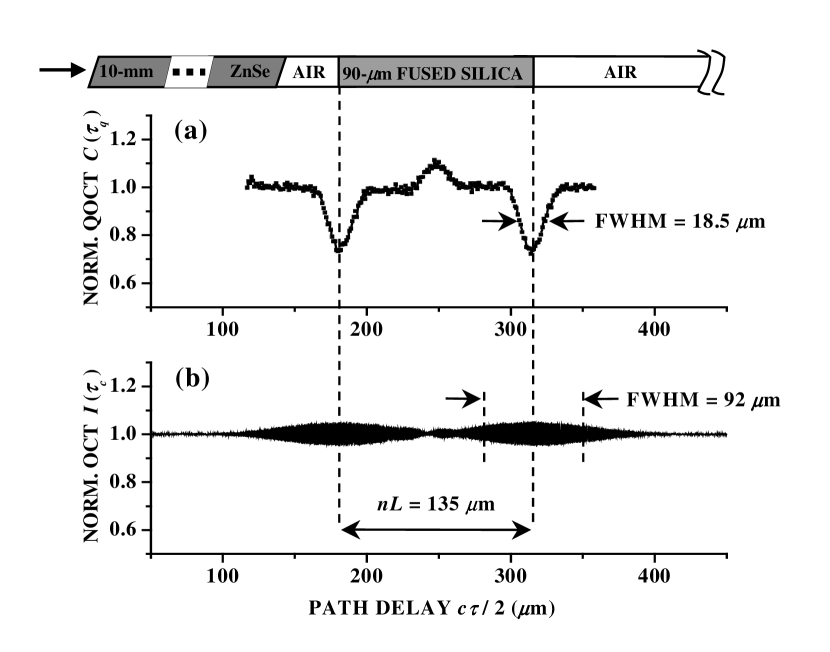
In the experimental realization, the fused-silica window is buried beneath two cascaded 5-mm-thick windows of highly dispersive ZnSe, slightly canted with respect to the incident beam to divert back-reflections, as shown at the top of Fig. 4. The GVD coefficient for ZnSe is s2m-1 at nm, which is 25 times greater than that for fused silica.
Figure 4a shows the normalized QOCT interferogram for the buried sample. As predicted in Eq. (9), the widths of the dips remain 18.5 m, just as they were in the absence of the dispersive medium (see Fig. 3a). Thus the resolution of the QOCT scan is unaffected by the presence of the dispersive medium. The hump between the two dips in the QOCT interferogram in Fig. 4a is also unaffected by the presence of the dispersive medium. This would not be the case, however, if the dispersive material were between the reflecting surfaces rather than outside of them Abouraddy . On the other hand, the interference-fringe envelopes in the normalized OCT interferogram displayed in Fig. 4b are broadened from 37 to 92 m as a result of dispersion.
It is also of interest to compare the visibility of the interferograms. Diverted reflection losses are not expected to reduce the visibility of the QOCT features, whereas this benefit does not accrue to OCT Abouraddy . The robustness of QOCT in this connection is evident in Fig. 4a, where the reduction of visibility (in comparison with Fig. 3a) arises only from misalignment. In Fig. 4b, on the other hand, the OCT interferogram suffers a substantially greater loss of visibility (in comparison with Fig. 3b), as a result of both dispersion and diverted losses from the four uncoated ZnSe surfaces.
In conclusion, we have carried out proof-of-principle experiments demonstrating the successful operation of a new axial optical sectioning technique, quantum optical coherence tomography (QOCT). We have experimentally demonstrated the two principal advantages that stem from the frequency entanglement of the twin-photon source: dispersion cancellation and resolution doubling.
This work was supported by the National Science Foundation; by the Center for Subsurface Sensing and Imaging Systems (CenSSIS), an NSF Engineering Research Center; and by the David Lucile Packard Foundation. We are grateful to G. Di Giuseppe, A. Abouraddy, and M. Hendrych for assistance with the experiments and helpful comments.
References
- (1) D. Huang, E. A. Swanson, C. P. Lin, J. S. Schuman, W. G. Stinson, W. Chang, M. R. Hee, T. Flotte, K. Gregory, C. A. Puliafito, and J. G. Fujimoto, Science 254, 1178 (1991).
- (2) J. G. Fujimoto, M. E. Brezinski, G. J. Tearney, S. A. Boppart, B. Bouma, M. R. Hee, J. F. Southern, and E. A. Swanson, Nature Med. 1, 970 (1995).
- (3) J. M. Schmitt, IEEE J. Sel. Topics Quantum Electron. 5, 1205 (1999).
- (4) M. R. Hee, J. A. Izatt, E. A. Swanson, D. Huang, J. S. Schuman, C. P. Lin, C. A. Puliafito, and J. G. Fujimoto, Arch. Ophthalmol. (Chicago) 113, 325 (1995).
- (5) M. E. Brezinski, G. J. Tearney, N. J. Weissman, S. A. Boppart, B. E. Bouma, M. R. Hee, A. E. Weyman, E. A. Swanson, J. F. Southern, and J. G. Fujimoto, Heart 77, 397 (1997).
- (6) J. Welzel, Skin Res. Technol. 7, 1 (2001).
- (7) B. E. A. Saleh and M. C. Teich, Fundamentals of Photonics (Wiley, New York, 1991).
- (8) B. Povazay, K. Bizheva, A. Unterhuber, B. Hermann, H. Sattmann, A. F. Fercher, W. Drexler, A. Apolonski, W. J. Wadsworth, J. C. Knight, P. St. J. Russell, M. Vetterlein, and E. Scherzer, Opt. Lett. 27, 1800 (2002).
- (9) C. K. Hitzenberger, A. Baumgartner, W. Drexler, and A. F. Fercher, J. Biomed. Opt. 4, 144 (1999).
- (10) A. F. Fercher, C. K. Hitzenberger, M. Sticker, R. Zawadzki, B. Karamata, and T. Lasser, Opt. Comm. 204, 67 (2002).
- (11) A. F. Abouraddy, M. B. Nasr, B. E. A. Saleh, A. V. Sergienko, and M. C. Teich, Phys. Rev. A 65, 053817 (2002).
- (12) J. D. Franson, Phys. Rev. A 45, 3126 (1992).
- (13) A. M. Steinberg, P. G. Kwiat, and R. Y. Chiao, Phys. Rev. A 45, 6659 (1992); Phys. Rev. Lett. 68, 2421 (1992).
- (14) T. S. Larchuk, M. C. Teich, and B. E. A. Saleh, Phys. Rev. A 52, 4145 (1995).
- (15) L. Mandel and E. Wolf, Optical Coherence and Quantum Optics (Cambridge, New York, 1995), ch. 22.
- (16) C. K. Hong, Z. Y. Ou, and L. Mandel, Phys. Rev. Lett. 59, 2044 (1987).