Quantum optical coherence tomography with dispersion cancellation
Abstract
We propose a new technique, called quantum optical coherence tomography (QOCT), for carrying out tomographic measurements with dispersion-cancelled resolution. The technique can also be used to extract the frequency-dependent refractive index of the medium. QOCT makes use of a two-photon interferometer in which a swept delay permits a coincidence interferogram to be traced. The technique bears a resemblance to classical optical coherence tomography (OCT). However, it makes use of a nonclassical entangled twin-photon light source that permits measurements to be made at depths greater than those accessible via OCT, which suffers from the deleterious effects of sample dispersion. Aside from the dispersion cancellation, QOCT offers higher sensitivity than OCT as well as an enhancement of resolution by a factor of 2 for the same source bandwidth. QOCT and OCT are compared using an idealized sample.
pacs:
42.50.Dv, 42.65.KyI Introduction
Optical Coherence Tomography (OCT) has become a versatile and useful tool in biophotonics [1]. It is a form of range-finding that makes use of the second-order coherence properties of a classical optical source [2] to effectively section a reflective sample with a resolution governed by the coherence length of the source. OCT therefore makes use of sources of short coherence length (and consequently broad spectrum), such as superluminous LEDs and ultrashort-pulsed lasers.
A number of non-classical (quantum) sources of light have been developed over the past several decades [3] and it is natural to inquire whether making use of any of these might be advantageous. The answer turns out to be in the affirmative. Spontaneous parametric down-conversion (SPDC) [4] is a nonlinear process that generates entangled beams of light; these have been utilized to demonstrate a number of two-photon interference effects [5] that cannot be observed using traditional light sources [6]. We demonstrate that such entangled-photon fourth-order interference effects may be used to carry out range measurements similar to those currently obtained using classical OCT, but with the added advantage of even-order dispersion cancellation [7]. This is possible by virtue of the non-classical nature of the light produced by SPDC. We refer to this new technique as quantum optical coherence tomography (QOCT).
II Classical Optical Coherence Tomography (OCT)
The sample investigated in the course of our calculations, classical and quantum alike, is represented by a transfer function . This quantity describes the overall reflection from all structures that comprise the sample. For an incident undepleted monochromatic plane wave of angular frequency ,
| (1) |
Here is the complex reflection coefficient from depth and is the phase accumulated by the wave while travelling through the sample to the depth .
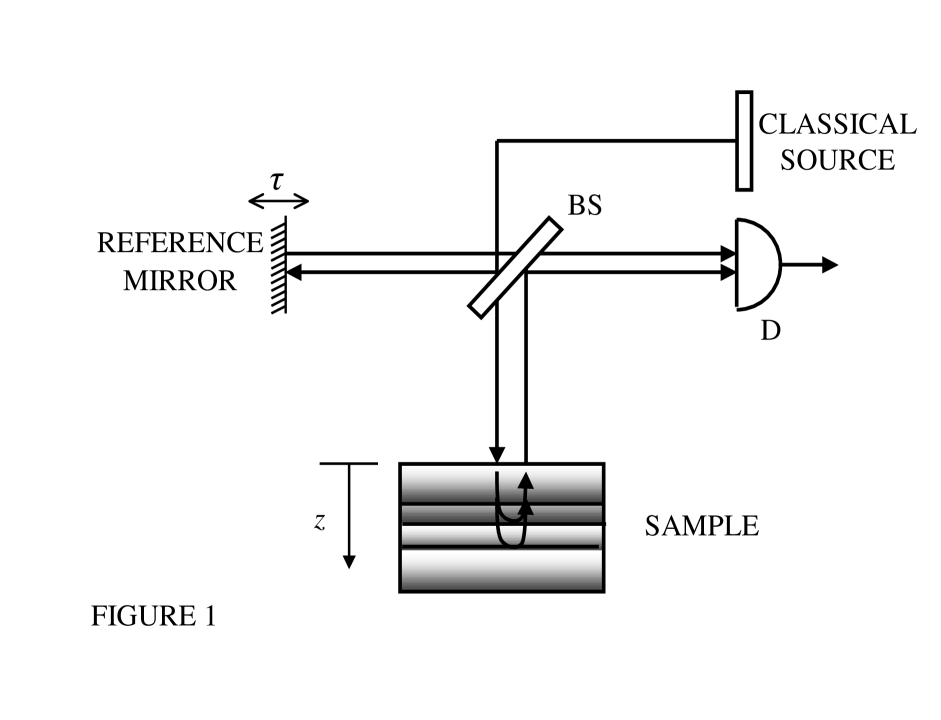
The basic scheme of OCT [1] is illustrated in Fig. 1. We assume that the classical source produces cw incoherent light with a short coherence time of the order of the inverse of its spectral width (the results also apply to the case of a pulsed source, however). We characterize the source S with a power spectral density where is its central angular frequency. The light is divided by a beam splitter into the two arms of a Michelson interferometer. A variable delay , imparted by a scanning mirror, is placed in the “reference arm” while the sample is placed in the “sample arm”. The reflected beams are recombined by the beam splitter and an interferogram is measured:
| (2) |
The self interference term and the cross-interference term are given by
| (3) |
and
| (4) |
respectively, where is the inverse Fourier transform of with respect to , and is the correlation function of the source [the inverse Fourier transform of ]. The symbol represents the convolution operation.
The physical underpinnings of this scheme may be understood by examining the interference of light propagating in the two paths created by the beam splitter (Fig. 1). A monochromatic wave of frequency emitted from S acquires a reflection coefficient in the sample arm, but only a phase factor in the reference arm. As is clear from Eq. (2), the resulting interferogram includes a self-interference contribution from the two paths (Eq. 3): a factor of unity from the reference path and a factor of from the sample path. The cross-interference contribution, which resides in Eq. (2), is the product of these two terms, and (one is conjugated, but this is of no significance in OCT). This term may also be expressed as a convolution of the sample reflection with the coherence function of the source, the temporal width of which serves to limit the resolution of OCT.
III Quantum Optical Coherence Tomography (QOCT)
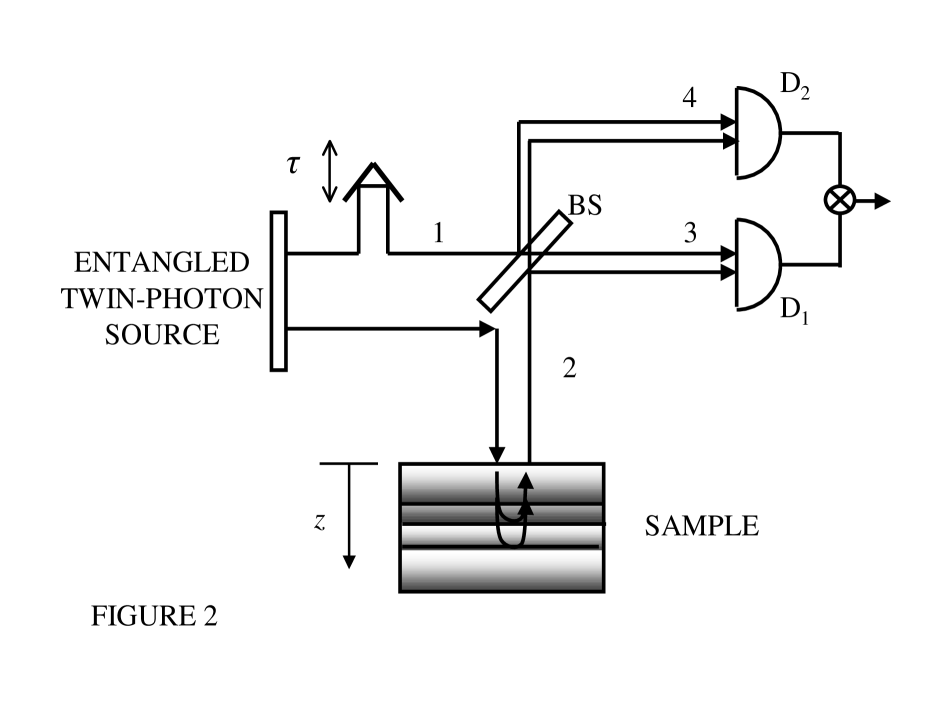
The scheme we propose for QOCT is illustrated in Fig. 2. The twin-photon source is characterized by a frequency-entangled state given by [8]
| (5) |
where is the angular frequency deviation about the central angular frequency of the twin-photon wave packet, is the spectral probability amplitude, and the spectral distribution of the wave packet is normalized such that . For simplicity, we assume is a symmetric function and that both photons reside in a common single spatial and polarization mode.
Interferometry is implemented by making use of a seminal two-photon interference experiment, that of Hong, Ou, and Mandel (HOM) [9]. The HOM beam-splitter interferometer is modified by placing a reflective sample in one of the paths in the interferometer and a temporal delay is inserted in the other path, as shown in Fig. 2. The two photons, represented by beams 1 and 2, are then directed to the two input ports of a symmetric beam splitter. Beams 3 and 4, the outputs of the beam splitter, are directed to two single-photon-counting detectors, D1 and D2. The coincidences of photons arriving at the two detectors are recorded within a time window determined by a coincidence circuit. The delay is swept and the coincidence rate is monitored. If a mirror were to replace the sample, sweeping the delay would trace out a dip in the coincidence rate whose minimum would occur at equal overall path lengths, which we define as zero delay. This dip is a result of quantum interference of the two photons within a pair.
For a sample described by , as provided in Eq. (1), the coincidence rate is given by
| (6) |
where the self-interference term and the cross-interference term are defined as follows:
| (7) |
and
| (8) |
Here is the inverse Fourier transform of with respect to .
It is important to highlight the distinctions and similarities between Eqs. (6), (7), and (8), and Eqs. (2), (3), and (4). The unity OCT background level in Eq. (3) is, fortuitously, absent in Eq. (7) for QOCT. Moreover, the QOCT cross-interference term in Eq. (8) is related to the reflection from the sample quadratically; the sample reflection is therefore simultaneously probed at two frequencies, and , in a multiplicative fashion. Finally, the factor of 2 by which the delay in the QOCT cross-interference term in Eq. (6) is scaled, in comparison to that in Eq. (2) for OCT, leads to an enhancement of resolution in the former.
A particularly convenient twin-photon source makes use of spontaneous parametric down-conversion (SPDC) [4]. This process operates as follows: a monochromatic laser beam of angular frequency , serving as the pump, is sent to a second-order nonlinear optical crystal (NLC). Some of the pump photons disintegrate into pairs of downconverted photons. We direct our attention to the case in which the photons of the pairs are emitted in selected different directions (the non-collinear configuration). Although each of the emitted photons in its own right has a broad spectrum, by virtue of energy conservation the sum of the frequencies must always equal . Because of the narrow spectral width of the sum frequency (which is the same as the pump frequency), the photons interfere in pairs. But because of the broadband nature of each of the photons individually, they serve as a distance-sensitive probe not unlike the broadband photons in conventional OCT.
IV Comparison of QOCT and OCT
The sample model presented in Eq. (1) may be idealized by representing it as a discrete summation
| (9) |
where the summation index extends over the layers that constitute the sample. This is a suitable approximation for many biological samples that are naturally layered, as well as for other samples that are artificially layered such as semiconductor devices. This approximation is not essential to the development presented in this paper, however.
We further assume, without loss of generality, that the dispersion profile of the media between all surfaces are identical, so that , where is the wave number at angular frequency , is the depth of the layer from the sample surface, is the frequency-dependent refractive index, and is the speed of light in vacuum. We expand to second order in : , where is the inverse of the group velocity at , and represents group velocity dispersion (GVD) [2].
In the case of OCT, using Eqs. (4) and (9) leads to a cross-interference term given by
| (10) |
where arises from reflection from the layer after suffering sample GVD over a distance , the subscript indicates dispersion, and the superscript indicates that dispersion is included from the surface of the sample all the way to the layer. The quantity is thus the Fresnel transformation of with dispersion coefficient [2]:
| (11) |
The effectiveness of OCT is therefore limited to samples that do not exhibit appreciable GVD over the depth of interest.
In the case of QOCT, on the other hand, Eqs. (8) and (9) result in a cross-interference term given by the sum of two contributions:
| (12) |
the first contribution represents reflections from each layer without GVD, while the second contribution represents cross-terms arising from interference between reflections from each pair of layers. The quantity is the correlation function of the source defined previously, and the quantity is the Fresnel transformation given in Eq. (11). In contrast to OCT, only dispersion between the and layers survives, as is evident by the superscript . The terms comprising the first contribution in Eq. (12) include the information that is often sought in OCT: characterization of the depth and reflectance of the layers that constitute the sample. The terms comprising the second contribution in Eq. (12) are dispersed due to propagation through the inter-layer distances ; however, they carry further information about the sample that is inaccessible via OCT. Two complementary approaches can be used to extract information from Eq. (12): 1) averaging the terms that comprise the second contribution by varying the pump frequency while registering photon coincidences such that the exponential function averages to zero, which leads to unambiguous optical sectioning information resident in the first contribution; and 2) isolating and identifying the terms of the second contribution to obtain a more detailed description of the sample than is possible with OCT. This can, in fact, be achieved by making use of the Wigner distribution as will be demonstrated at the end of this section.
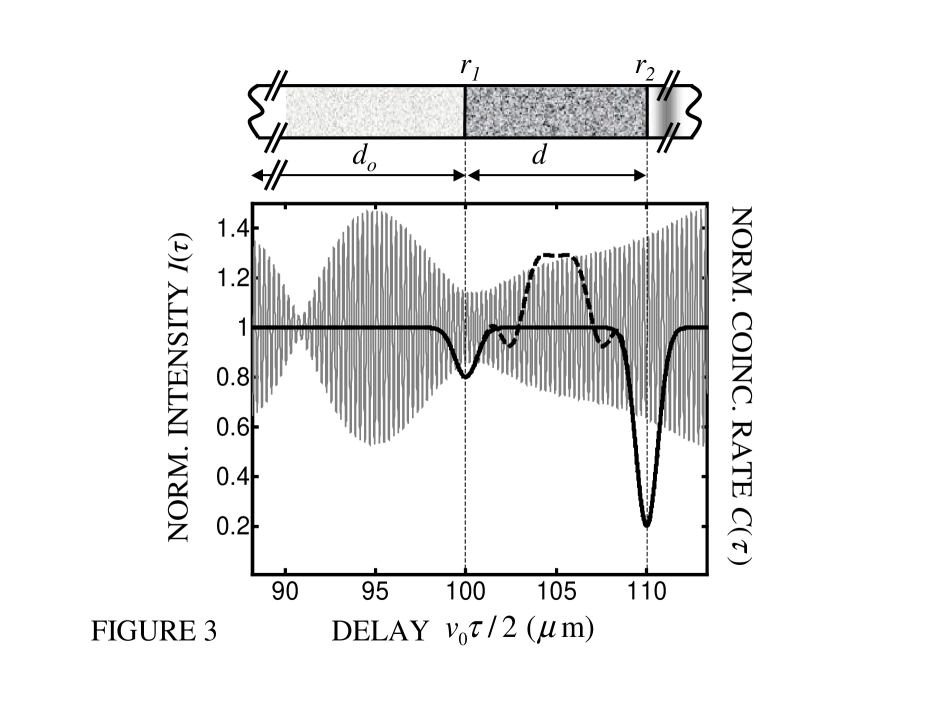
We now proceed to provide a numerical comparison between QOCT and OCT using Eqs. (10) and (12). Consider a sample comprising of two reflective layers buried at some depth below the surface of a medium, as illustrated at the very top of Fig. 3. For the purposes of our calculation, we arbitrarily choose amplitude reflection coefficients and , separation distance m, and depth below the sample surface mm. For both OCT and QOCT, calculations are carried out by assuming that the source has a central wavelength nm and a Gaussian spectral distribution with a bandwidth (full width at of maximum) of 155 nm, which corresponds to a wave packet of temporal width 14 fsec and length 4.2 m in free space. In the context of QOCT, this can be realized by means of a -barium borate NLC of thickness 1 mm pumped by a source of wavelength nm. Using type-I SPDC, a NLC cut at an angle with respect to the optic axis generates light centered about the degenerate wavelength nm. For purposes of illustration, we neglect reflection from the top surface of the sample and assume that the sample dispersion profile is characterized by: and . These correspond to a highly dispersive material; however, common materials such as “higher dispersion crown glass” [10] are an order-of-magnitude more dispersive.
The results of this calculation are displayed in Fig. 3 for OCT (thin rapidly varying gray curve) and QOCT (black broken curve representing the full signal; black solid curve representing the signal averaged over pump frequency). Because of dispersion it is clear that no useful information about the sample is available from OCT. QOCT, on the other hand, yields a pair of high-resolution dispersion-cancelled coincidence-rate dips at delays corresponding to reflections from the two surfaces. Moreover, the QOCT resolution is a factor of 2 superior to that achievable via OCT in a dispersionless medium. The peak between the two dips evidenced in the full QOCT signal (black broken curve), which could alternatively be a dip depending on the phases of the terms in the second contribution in Eq. (12), is a result of quantum interference between the probability amplitudes arising from reflection from the two different surfaces. This is in contrast to the black solid-curve dips, which are a result of quantum interference between the probability amplitudes arising from reflection from each surface independently. The breadth of the middle peak is determined only by the dispersion of the medium residing between the two reflective surfaces and not by the nature of the material under which they are buried. It is clear, therefore, that the dispersion of the region between the two surfaces may be determined by measuring the broadening of the middle peak in comparison with the two dips.
It is worthy of note that dispersion cancellation occurs for all even powers of the expansion of . Thus if the phases of reflection from the surfaces are random, which provides a model for transmission through a turbid or turbulent medium, only the middle peak will wash out, while the dips arising from reflections from the surfaces of interest are unaffected. In OCT, such random phase variations serve to deteriorate, and possibly destroy, information about the sample.
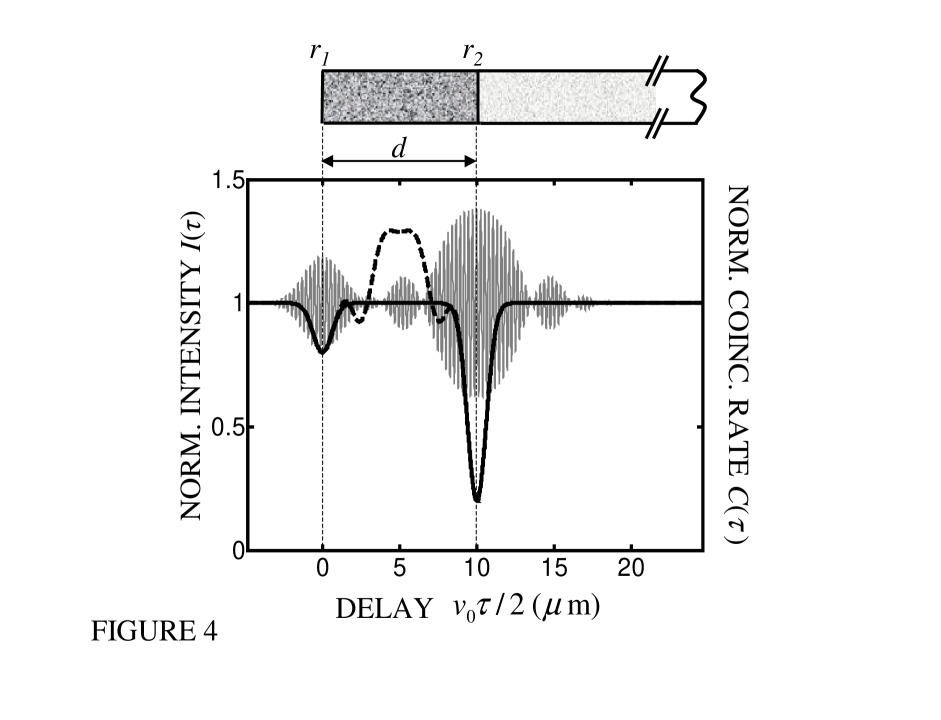
In Fig. 4 we plot results for the same example examined above, except that one of the layers of interest is situated at the surface of the sample rather than being buried beneath it. In this case OCT gives intelligible results although the return from the second layer is clearly broadened as a result of dispersion. On the other hand, the results for QOCT are identical to those shown in Fig. 3 for the same two-layer object buried under a dispersive medium. QOCT is also seen to exhibit higher sensitivity than OCT for weakly reflective samples. This is because the self-interference term in QOCT [Eq. (7)] does not include the factor of unity present in the self-interference term of OCT [Eq. (3)].
Finally, we address the use of the Wigner distribution for extracting information about the sample via the QOCT cross-interference term . Examining Eq. (8), and assuming that the bandwidth of is greater than that of , we obtain
| (13) |
This is precisely the Wigner distribution function of the function , with parameters and [11]. Knowledge of for all relevant values of and guarantees that may be reconstructed [12]. The quantity is varied by changing the delay in path 1 of the interferometer in Fig. 2. The quantity may be changed by varying the pump frequency . Although this technique might be expected to face practical difficulties because the direction of SPDC changes as the frequency is varied, this could be mitigated by adjoining a wave-guiding mechanism to the twin-photon source, as is customary when using periodically-poled NLCs, for example. Furthermore, such an approach would enable the output light to be directly coupled into an optical fiber and thus integrated into systems already familiar to the practitioners of OCT.
V Advanced-wave interpretation
The operation of QOCT may be understood in a heuristic way by considering an advanced-wave interpretation similar to that employed by Klyshko in the context of spatial interferometers [13]. In such an interpretation one of the detectors may be thought of as being replaced by a classical light source with its waves traced backward through the optical system, and the twin-photon source may be thought of as a reflector. The intensity measured at the location of the other detector then mimics the coincidence rate [13]. Applying this interpretation to QOCT, assume that D1 in Fig. 2 is replaced by a classical light source that emits a monochromatic wave of frequency . The beam splitter results in this wave being partitioned into two paths. In one of these (path 1) the wave travels backward through the delay, changes direction and flips its frequency about to at the twin-photon source, and then propagates forward through path 2. Finally, it reflects from the sample and reaches D2 having acquired a weighting factor of . The second wave (path 2 after the beam splitter) reflects from the sample, changes direction and frequency from to at the source, and then undergoes a delay in path 1 en route to D2, acquiring a weighting factor . The self-interference contribution in Eq. (7) is given by the sum of the squared amplitudes of these two terms. The cross-interference contribution to the interferogram is one of these terms multiplied by the complex conjugate of the other: . This interpretation makes clear the origin of the salutary time-scaling by a factor of 2 and the absence of interference fringes at frequency from the QOCT interferogram. Both QOCT interfering waves reflect from the sample and they do so at conjugate frequencies, whereas in OCT one of the waves reflects from a mirror, which gives rise to the deleterious unity term that is absent from QOCT. In contrast to OCT, the complex conjugate present in the cross-interference term is of central importance in QOCT.
VI Conclusion
We have presented a new technique, called quantum optical coherence tomography (QOCT), which utilizes the wave-packet nature of photons generated in pairs via spontaneous parametric down-conversion (SPDC). Each photon of the pair inherently occupies a broad spectrum even though the pump is monochromatic: the bandwidth is determined by the length of the nonlinear crystal. QOCT yields performance superior to that of a classical optical coherence tomography (OCT) on three counts: 1) the resolution is enhanced by a factor of 2 for the same source bandwidth; 2) it has greater sensitivity for weakly reflecting samples; and 3) sample group-velocity dispersion does not result in a deterioration of resolution with increasing depth into the sample. Moreover, the frequency dependent refractive index of the medium, which is inaccessible to OCT, may be extracted.
Acknowledgments.— We thank Zachary Walton for helpful discussions. This work was supported by the National Science Foundation and by the Center for Subsurface Sensing and Imaging Systems (CenSSIS), an NSF engineering research center.
REFERENCES
- [1] D. Huang, E. A. Swanson, C. P. Lin, J. S. Schuman, W. G. Stinson, W. Chang, M. R. Hee, T. Flotte, K. Gregory, C. A. Puliafito, and J. G. Fujimoto, Science, 254, 2278 (1991); J. M. Schmidt, IEEE J. Select. Topics Quantum Electron. 5, 1205 (1999).
- [2] M. Born and E. Wolf, Principles of Optics, 8th Ed. (Cambridge University Press, New York, 1999); B. E. A. Saleh and M. C. Teich, Fundamentals of Photonics (Wiley, New York, 1991).
- [3] M. C. Teich and B. E. A. Saleh, in Progress in Optics, vol. 26, edited by E. Wolf (North-Holland, Amsterdam, 1988), ch. 1, pp. 1-104; M. C. Teich and B. E. A. Saleh, Phys. Today 43(6), 26 (1990).
- [4] D. N. Klyshko, Pis’ma Zh. Eksp. Teor. Fiz. 6, 490 (1967) [translation: Sov. Phys. JETP Lett. 6, 23 (1967)]; S. E. Harris, M. K. Oshman, and R. L. Byer, Phys. Rev. Lett. 18, 732 (1967); T. G. Giallorenzi and C. L. Tang, Phys. Rev. 166, 225 (1968); D. A. Kleinman, Phys. Rev. 174, 1027 (1968); D. C. Burnham and D. L. Weinberg, Phys. Rev. Lett. 25, 84 (1970); D. N. Klyshko, Photons and Nonlinear Optics (Gordon and Breach, New York, 1988).
- [5] R. Ghosh, C. K. Hong, Z. Y. Ou, and L. Mandel, Phys. Rev. A 34, 3962 (1986); R. Ghosh and L. Mandel, Phys. Rev. Lett. 59, 1903 (1987); J. G. Rarity, P. R. Tapster, E. Jakeman, T. Larchuk, R. A. Campos, M. C. Teich, and B. E. A. Saleh, Phys. Rev. Lett. 65, 1348 (1990).
- [6] A. Zeilinger, Rev. Mod. Phys. 71, S288 (1999); E. S. Fry and T. Walther, in Advances in Atomic, Molecular, and Optical Physics, vol. 42, edited by B. Bederson and H. Walther (Academic, Boston, 2000), pp. 1-27.
- [7] J. D. Franson, Phys. Rev. A 45, 3126 (1992); A. M. Steinberg, P. G. Kwiat, and R. Y. Chiao, Phys. Rev. A 45, 6659 (1992); A. M. Steinberg, P. G. Kwiat, and R. Y. Chiao, Phys. Rev. Lett. 68, 2421 (1992); T. S. Larchuk, M. C. Teich, and B. E. A. Saleh, Phys. Rev. A 52, 4145 (1995).
- [8] R. A. Campos, B. E. A. Saleh, and M. C. Teich, Phys. Rev. A 42, 4127 (1990).
- [9] C. K. Hong, Z. Y. Ou, and L. Mandel, Phys. Rev. Lett. 59, 2044 (1987).
- [10] D. R. Lide, Ed. in Chief, CRC Handbook of Chemistry and Physics, 74th Ed. (CRC Press, Boca Raton, 1993).
- [11] E. Wigner, Phys. Rev. 40, 749 (1932).
- [12] L. Cohen, Proc. IEEE 77, 941 (1989).
- [13] D. N. Klyshko, Usp. Fiz. Nauk 154, 133 (1988) [translation: Sov. Phys. Usp. 31, 74 (1988)] .