Experimental verification of the Heisenberg uncertainty
principle
for hot fullerene molecules
Abstract
The Heisenberg uncertainty principle for material objects is an essential corner stone of quantum mechanics and clearly visualizes the wave nature of matter. Here we report a demonstration of the Heisenberg uncertainty principle for the most massive, complex and hottest single object so far, the fullerene molecule C70 at a temperature of 900 K. We find a good quantitative agreement with the theoretical expectation: , where is the width of the restricting slit, is the momentum transfer required to deflect the fullerene to the first interference minimum and h is Planck’s quantum of action.
pacs:
03.65.-w,03.65.Ta,03.75.-b,39.20.+qComplementarity is one of the essential paradigms of quantum mechanics [1]. Two quantities are mutually complementary in that complete (or partial) knowledge of one implies the complete (or partial) uncertainty about the other and vice versa. The most generally known case is the complementarity between position and momentum, as expressed quantitatively in the Heisenberg uncertainty principle . For neutrons the uncertainty relation has been demonstrated already back in 1966 by Shull [3]. Following the growing experimental efforts in atom optics during the last decade, the uncertainty principle has shown up implicitly in several experiments and has also been explicitly investigated in both the spatial [4] and in the time domain [5].
While being a physical phenomenon of interest in its own right, the complementarity between momentum and position is also an important factor for practical purposes: for example it is applied for the preparation of transverse coherence in all experiments using collimated beams, a fact that can be mathematically phrased using the van Cittert-Zernike theorem [6, 7, 8].
There are good reasons to believe that complementarity and the uncertainty relation will hold for all sufficiently well isolated objects of the physical world and that these quantum properties are generally only hidden by technical noise for larger objects. It is therefore interesting to see how far this quantum mechanical phenomenon can be experimentally extended to the macroscopic domain.
Here we report on an experiment investigating for the first time in a quantitative way the uncertainty relation upon diffraction at a single slit for a molecule as complex, massive and hot as the fullerene C70 ( amu) at an internal and translational temperature of 900 K.
It is well known that the limit of the uncertainty relation is only reached for particular wave packets, for example of the Gaussian type. Evidently, the wave packet after passage through a rectangular slit is very different from this minimal uncertainty shape. This is also reflected in the far field distribution which is described by the well known sinc-function rather than a Gaussian. It is therefore a matter of definition and convenience which quantities to take as a measure of the position and momentum uncertainty in our case. Obviously, for a wave traversing a slit, one can take the slit width to be the measure of the spatial uncertainty . The momentum uncertainty can be related to the angular spread due to diffraction at the slit. Quantitatively, we define it as the momentum required to reach the first order interference minimum, which for small angles, as used in our experiment, lies in the direction . With this definition of the uncertainty we expect the following relation
to hold for the experiment. It is this equality that we quantitatively test in the following for a beam of C70.
In the actual experiment the minima are not very well defined due to the broad de Broglie wave spectrum of our fullerene source. However, we can determine the full width at half maximum (FWHM) values of the central lobe with good precision. The far field diffraction pattern after a single slit is given by , where and is the wave vector of the incident fullerene molecule. The half width at half maximum (HWHM) for the diffraction curve is then given by the solution of , which yields
Practically, this means that we obtain the momentum uncertainty as defined above from the measured FWHM via .
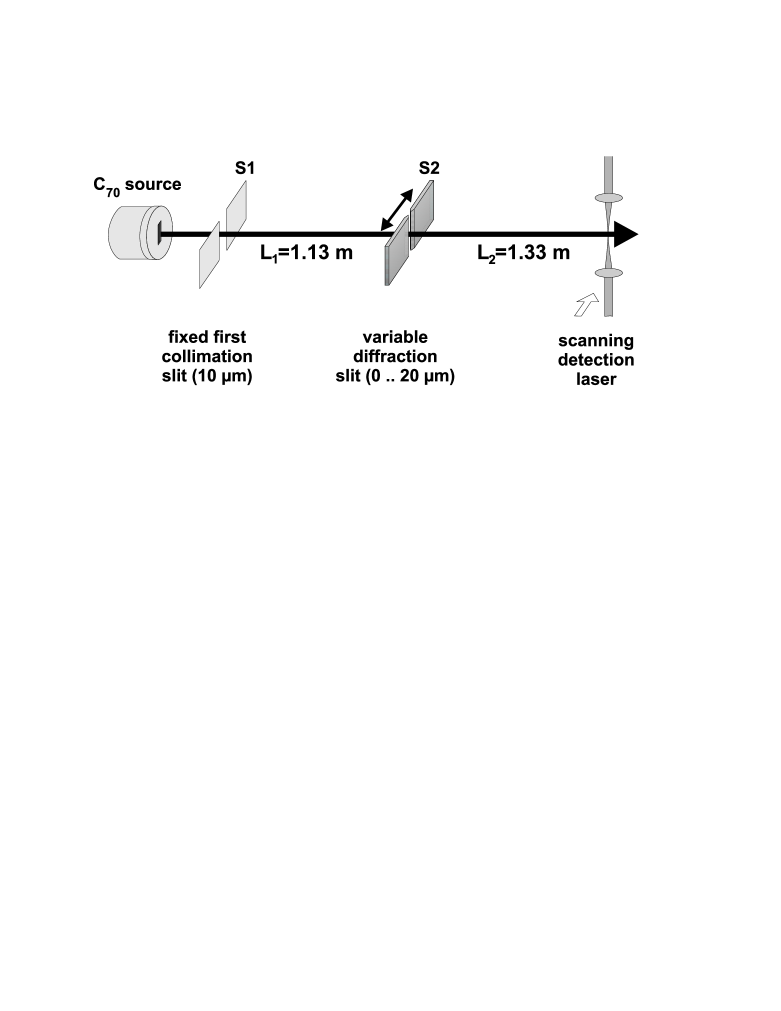
The setup of the experiment, shown in fig.1, is similar to that described in a previous publication[9]. An effusive thermal fullerene beam is produced at about 900 K. The velocity spread was as large as and was taken into account into the numerical description of the experiment.
The molecular beam is collimated by two piezo-controlled slits. The width of the first slit , is fixed at 10 m, while the width of the second slit, – which is located at the distance cm further downstream – can be varied to investigate the position-momentum uncertainty relation.
In order to also quantitatively describe the experiment the properties of the slits have to be known rather precisely. The slits (Piezosysteme Jena) are made of two silicon edges mounted on piezo-controlled flexure stages. We obtain information about the slit opening in three different ways: from the applied piezo voltage, from the reading of a strain gauge mounted to the slits and finally from the total number of molecules passing through the slit at a given opening. While the piezo voltage can be kept stable to better than it is well known that piezos show creep, hysteresis and non-linearities. However, it turned out in the experiments that the passive stability over a typical time of 1 hour was of the order of 50 nm, as can be judged from the stability of the diffraction patterns. From a calibration of the hysteresis curve we determine the change of the slit opening as a function of the piezo voltage. In order to know the absolute slit width we determined the zero position by measuring the number of molecules passing through the slit, when it was being closed. We estimate this method to be accurate to within nm.
We extract the momentum spread after from the FWHM of the detected molecular beam in the detection plane, which is separated from by the length cm. The observed distribution function is actually a convolution of the detector resolution function and the real molecular beam profile .
The scanning laser ionization detector has been characterized in depth in a previous publication [10]. For our present experiments with C70 the FWHM of the detector response was determined to be at a laser power of P=10 W. The effective FWHM detector height at this power was measured to be mm.
The second contribution, related to the measured molecular beam profile , is composed of both the classical collimation and the momentum spread due to the quantum uncertainty. In order to compare the experiment with the uncertainty relation derived before, we concentrate in the following on the half-width values of these components only. Since the classical FWHM shadow width and the quantum contribution are completely independent their influence can be added quadratically to yield the FWHM value of , which we denominate as . The classical contribution can be derived from a simple geometrical shadow model. Taking the measured and the classically expected widths we can then deduce the contribution to the beam width due to the quantum uncertainty and we finally relate this spatial information to the corresponding momentum uncertainty, which then reads:
| (1) |
where is the longitudinal momentum of the molecule.
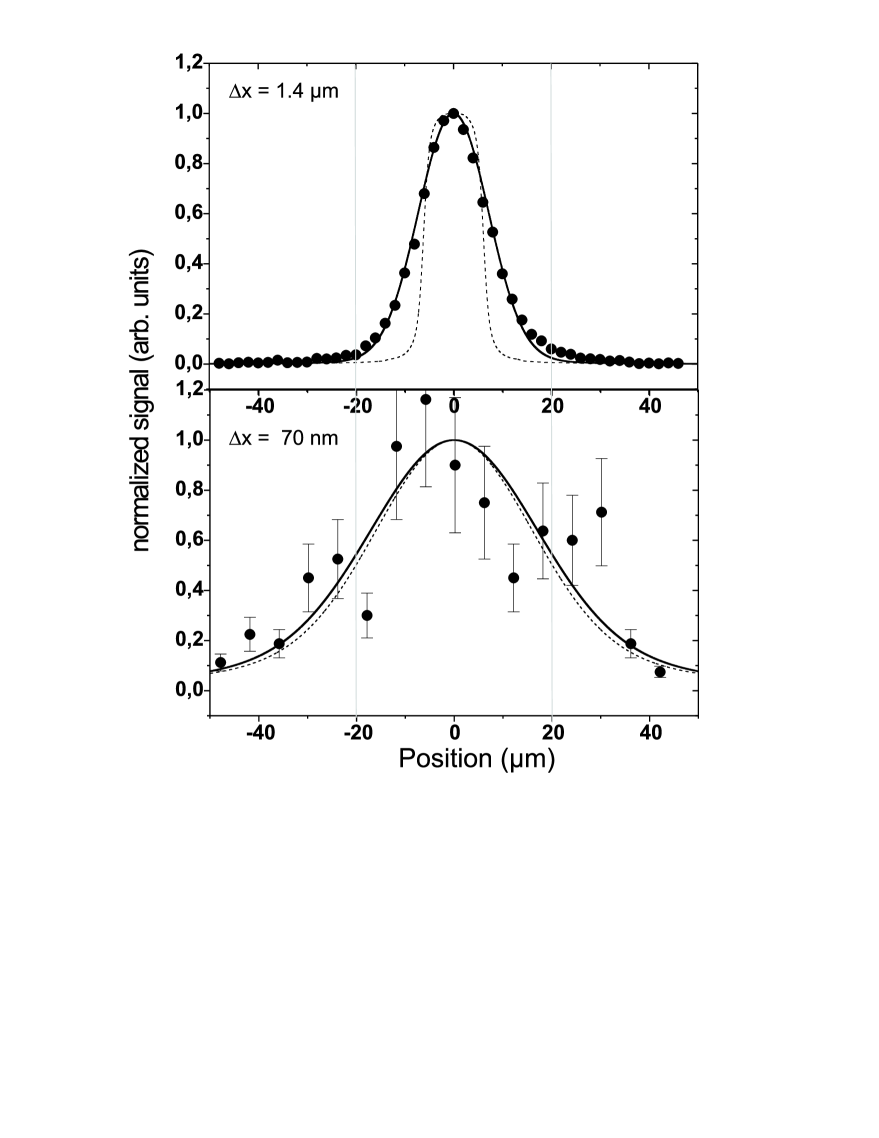
To trace out the uncertainty relation we varied the width of the second slit from about down to roughly and record the molecular beam width in the detection plane. In figure 2 we show the measured molecular beam profiles as full circles for two different widths of the second collimation slit. We see a relatively narrow beam of for the slit width m (fig 2a) and again a strong growth to for the slit width (fig 2b). The error bars in fig. 2 represent the statistical uncertainty due to the very low count rate, in particular at the smallest slit width.
The dashed line follows a full wave calculation as described below in order to show the molecular beam profile as given by diffraction alone. The continuous curves represent the same model but convoluted with the detector profile.
Close inspection of the data shows a good agreement between the convoluted wave model and the experimental data. This good agreement is the first demonstration of single slit diffraction for a molecule as heavy, complex and hot as C70.
Fig. 2b is actually an interesting complement to the high contrast interference fringes of fullerenes after diffraction at a nanofabricated grating with a grating constant of 100 nm, which we could demonstrate in a previous publication [11]. The single slit pattern shown here is the envelope of the far-field grating interference pattern. This provides a striking proof of the wave nature of the fullerene C70 because it demonstrates that the previous minima must have been due to destructive interference.
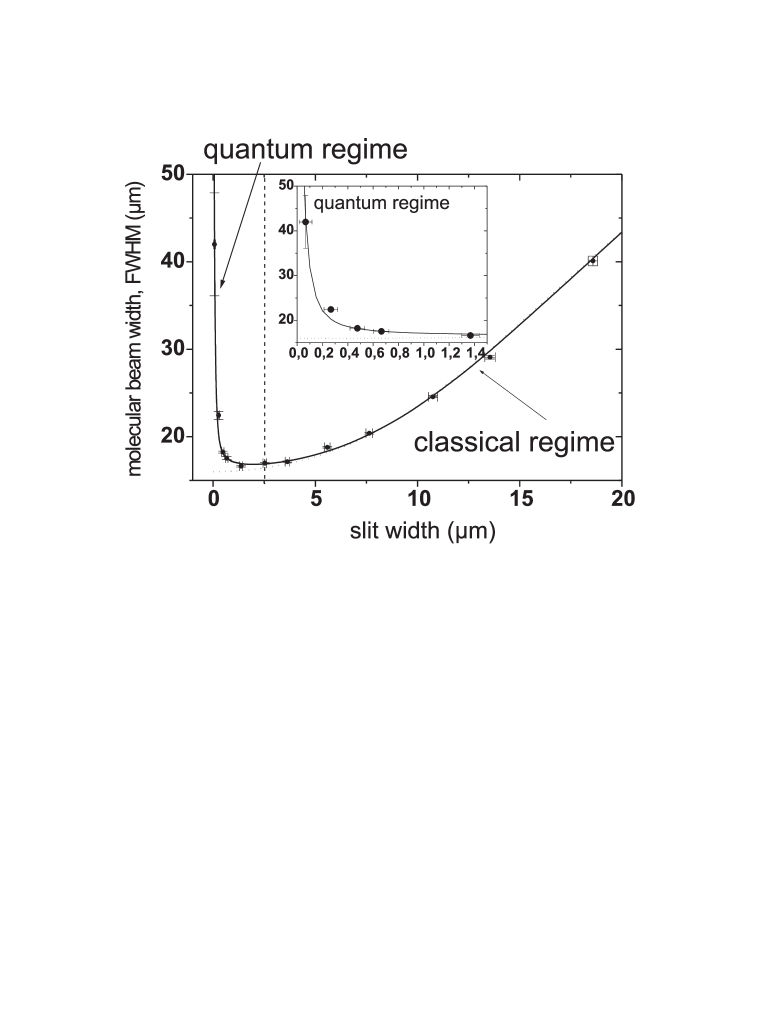
From the whole series of experiments with varying slit widths we have extracted the FWHM values from the experiment and we compare them with a quantum wave model in fig. 3. An excellent agreement between expectation and experiment is found throughout the whole range of values. We can distinguish essentially two different regimes corresponding to a pure quantum regime (left part of fig. 3) and a range which can be very well described using a classical ball model (right part of fig. 3). The continuous wave calculation curve and the dotted classical line coincide almost completely down to a slit width of about . Below this value the quantum mechanical momentum spread contributes significantly to the beam width in the detection plane. This quantum range is magnified in the inset of fig. 3.
The horizontal error bars in this picture have two components, namely the precision both of the absolute zero and of the scaling of the piezo translation as a function of the applied voltage. Both are only important for a small slit width . The absolute zero (closed) position of the piezo slits is known with an error of 30 nm, as mentioned above. The scaling with the applied piezo voltage is non-linear and follows a hysteresis curve, which has been calibrated. We estimate an uncertainty of in the calibration of the hysteresis curve.
The vertical error bars estimate the uncertainty of the measured width of the beam in the detection plane. For small slit widths these values are obtained from a least squares Gaussian fit to the detected curve. For large the marked trapezoidal shape as well as the high signal-to-noise ratio permit a direct reading of the experimental and theoretical FWHM values with very high accuracy.
The numerical simulations in fig. 3 are based on the fact that the Schrödinger equation of our time independent problem is formally equivalent to the Helmholtz equation and can therefore be treated using all the methods well known from optics. The solution is done in close analogy to the numerical approach as used in [12] for neutrons and similarly in [13, 14] for atoms. There is no free parameter in the calculation except for a broadening of the detector resolution by with respect to the best detector resolution curves recorded some time earlier [10]. This offset is most likely explained by a residual tilt of 2.7 mrad between laser and diffraction slit. This is in agreement with diffraction curves not shown here, which were recorded using the same setup but at half the width of the first collimation slit.
Since in previous papers it has been pointed out that the form factor of single slit diffraction may be influenced by the van der Waals interaction between the molecule and the slit walls [15, 9] one may wonder whether this effect may become visible in the present experiment. However, the slit widths here, except for the smallest, are much larger than in the former grating diffraction experiments, where the effective slit width was reduced by about 15 nm. Since the van der Waals potential above a surface decreases with the third power of the object-wall distance the effect becomes small for the present study although the slit thickness is bigger than that of the previously used SiNx gratings. For the smallest slit width, , a possible contribution is masked by the experimental error bar.
In the following we compare our findings with the Heisenberg uncertainty relation between position and momentum. For this we use the method as indicated further above: From the measured beam width we separate the influence of the detector resolution in a deconvolution procedure. The remaining molecular beam width is then decomposed into its classical and quantum part.
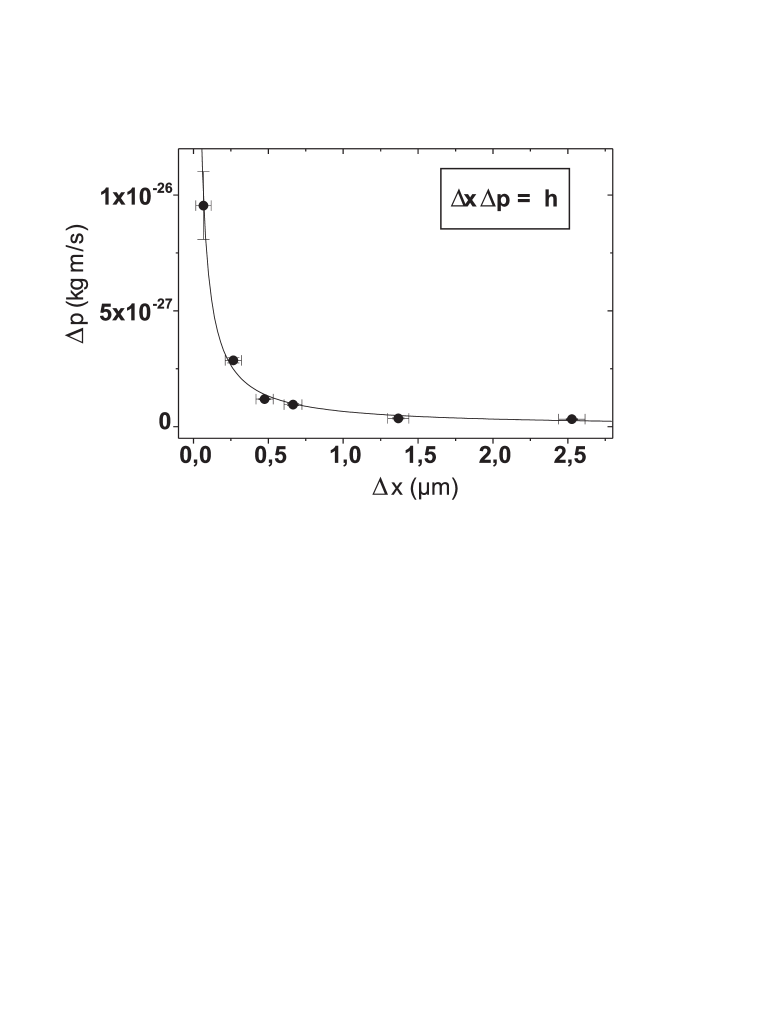
We can then plot as derived from eqn. 1 as a function of for slit openings lying well in the quantum regime and obtain fig. 4. The full circles represent the values extracted from the experiment with error bars directly related to those of the inset of fig. 3. The continuous line follows our original expectation function without any additional fit parameter. We regard the good quantitative agreement between the data points and the predicted curve as a good support for the validity of the Heisenberg uncertainty principle for the fullerene C70 - i.e. in a complexity region not studied so far.
Acknowledgements.
We acknowledge help in the setup of the experiment by Julian Voss-Andreae, Claudia Keller, Gerbrand van der Zouw and Julia Petschinka. This work has been supported by the European TMR network, contract no. ERBFMRXCT960002 and by the Austrian Science Foundation (FWF), within the project F1505. O.N. acknowledges a scholarship from the Austrian Academy of Sciences.REFERENCES
- [1] N. Bohr (1927) in P. Schilpp (ed.), Albert Einstein, Philosopher-Scientist. Tudor, New York 1949.
- [2] W. Heisenberg, Z. Phys. 43, 172 (1927).
- [3] C. Shull, Phys. Rev. 179, 752 (1969);
- [4] J. A. Leavitt, F. A. Bills, Am. J. of Phys., 37 (9), 905(1969).
- [5] P. Szriftgiser, D. Guéry-Odelin, M. Arndt, J. Dalibard, Phys.Rev.Lett. 77, 4 (1996).
- [6] P.H. van Cittert, Physica 1, 201 (1934).
- [7] F. Zernike, Physica 5, 785 (1938).
- [8] M. Born, E. Wolf, Principles of Optics, 6th ed., p.510 & 514, Pergamon Press, Oxford (1980).
- [9] M. Arndt, O. Nairz, J. Voss-Andreae, C. Keller, G. van der Zouw, A. Zeilinger, Nature, 401, 680 (1999).
- [10] O. Nairz, M. Arndt, A. Zeilinger, J. Mod. Opt. 47, 2811 (2000).
- [11] M. Arndt, O. Nairz, A. Zeilinger, C. R. Acad. Sci. Paris, t.2, Série IV, p. 1-5 (2001).
- [12] A. Zeilinger, R. Gähler, C. G. Shull, W. Treimer, W. Mampe, Rev. Mod. Phys. 60, 1067 (1988).
- [13] Q. A. Turchette, D. Pritchard, D. W. Keith, J. Opt. Soc. Am: A 1601 (1992).
- [14] O. Carnal, Q. A. Turchette, H. J. Kimble, Phys. Rev. A 51, 3079 (1995).
- [15] R. E. Grisenti, W. Schöllkopf, J. P. Toennies, G. C. Hegerfeldt, T. Köhler, Phys. Rev. Lett., 83, 1755 (1999).