Hierarchy and Feedback in the Evolution of the E. coli Transcription Network.
Abstract
The E.coli transcription network has an essentially feedforward structure, with, however, abundant feedback at the level of self-regulations. Here, we investigate how these properties emerged during evolution. An assessment of the role of gene duplication based on protein domain architecture shows that (i) transcriptional autoregulators have mostly arisen through duplication, while (ii) the expected feedback loops stemming from their initial cross-regulation are strongly selected against. This requires a divergent coevolution of the transcription factor DNA-binding sites and their respective DNA cis-regulatory regions. Moreover, we find that the network tends to grow by expansion of the existing hierarchical layers of computation, rather than by addition of new layers. We also argue that rewiring of regulatory links due to mutation/selection of novel transcription factor/DNA binding interactions appears not to significantly affect the network global hierarchy, and that horizontally transferred genes are mainly added at the bottom, as new target nodes. These findings highlight the important evolutionary roles of both duplication and selective deletion of crosstalks between autoregulators in the emergence of the hierarchical transcription network of E.coli.
The successful adaptation of microorganisms to an environment or host is determined by the correct response to external and internal stimuli through the simultaneous expression of a large set of genes. The basal mechanism that performs this task is transcriptional regulation, so that it becomes important to characterize this regulatory process from a global, or “network” viewpoint. Transcriptional regulation networks are defined starting from the basic functional elements of transcription BLA+04 . To construct the associated graph, one usually represents each operon with a node, and each regulatory interaction with a directed link between the target operon and the operon coding for a transcription factor (TF) that has at least one binding site in the cis-regulatory region of . A transcription factor regulating its own expression is called an autoregulator (AR). With this definition, the interaction graph structure is accessible by large-scale and collections of small-scale experiments SMM+02 ; SSG+06 ; LRR+02 ; HGL+04 .
Some topological and evolutionary properties of transcription networks have been elucidated MIK+04 ; WtW04 ; TB04 . In particular, they can be analyzed in terms of a hierarchy of inputs that produce output responses MBZ04 ; MKD+04 ; YG06 . Specifically, the E. coli transcription network has an essentially feedforward layered structure, where feedback is mainly limited to autoregulations MBZ04 ; MKD+04 . The abundance of the latter is, however, striking, as they concern more than half of the transcription factors THP+98 . Here, after quantifying the marginality of these properties with respect to a null network ensemble, we investigate how they could have emerged during evolution. An assessment of the role of gene duplication based on protein domain architecture shows that i) transcriptional autoregulators have mostly arisen through duplication, while ii) the expected feedback loops stemming from their initial cross-regulation. are strongly selected against. This requires a divergent coevolution of the autoregulator DNA binding sites and their respective DNA cis-regulatory regions. Moreover, we find that the network shows a tendency to grow by expansion of the existing hierarchical layers of computation, rather than by addition of new layers. We also argue that de novo rewiring of regulatory links due to mutation/selection of novel transcription factor/DNA binding interactions does not affect the hierarchy, and that horizontally transferred genes are mainly added at the bottom, as new target nodes. Our findings are consistent with a view of prokaryote evolution based on ancient duplications and conservation of stable central parts despite widespread horizontal gene transfers CD04 ; PPL05 .
Feedback and Hierarchy.
A priori, one may expect that transcription networks contain abundant feedback loops involving two or more genes Tho73 ; LJB05 . However, for the case of E. coli, the available data indicate that this is not the case MBZ04 ; MKD+04 ; YG06 . The Shen-Orr dataset SMM+02 (423 operons; 117 TFs, 578 interactions) does not contain any non-self-regulatory feedback loop for the E. coli transcription network. Such a tree-like directed graph is naturally organized in feedforward layers of computation, ending with target genes (TG) as “leaves”. The layers and their numbering can be defined by the longest chain of (different) regulators upstream of each TF or TG in each layer (Figs. 1a&d). Members of layer one are regulated by at most themselves, members of layer two are regulated by a chain of one transcription factor and possibly themselves, and so on. There are five hierarchical layers in the Shen-Orr dataset SMM+02 , which is considerably lower than for randomized null networks (see Fig. 1c). About of the nodes (TFs and TGs) lay in layer two, with of all TF nodes located in layer one. The notable exception to this general lack of feedback is the substantial presence of feedback loops involving a single node, or autoregulators (59 ARs out of 117 TFs) WHS04 ; BS00 ; ASM+03 ; THP+98 . The more recent publicly available database RegulonDB 5.5 SSG+06 includes larger datasets MBZ04 ; MKD+04 ; SSG+06 (648 operons; 147 TFs, 1170 interactions, 85 ARs, excluding Sigma-factor interactions). By contrast with Shen-Orr dataset, it contains a few (4) non-self-regulatory feedback loops and a few more (a total of 7) hierarchical layers but still considerably less than in randomized null networks (see Supplementary Note S5). Hence the same trend is seen for both Shen-Orr and RegulonDB 5.5 SSG+06 datasets.
To quantify the significance of regulatory feedback and hierarchical properties of the E. coli transcription network, we compared it for each dataset (Shen-Orr and RegulonDB 5.5) with randomized null networks with the same degree sequence, i.e. conserving the number of incoming and outgoing links for each node (Fig. 1 and Supplementary Note S1). For both data sets, the number of ARs found in the empirical network greatly exceeds the same quantity for randomized counterparts, confirming previous observations on self-regulatory feedback ASM+03 ; THP+98 ; SMM+02 . The importance of non-self-regulatory feedback was quantified by the size of the regulatory core obtained after pruning the tree-like input and output cascades using the leaf-removal algorithm (see Fig. 1b and Supplementary Notes S1 and S5). From this analysis, we conclude that the importance of transcriptional, non-self-regulatory feedback is significantly lower in both empirical networks (Shen-Orr and RegulonDB 5.5) than in their randomized network counterparts, see Fig. 1b and Fig. S5.10.
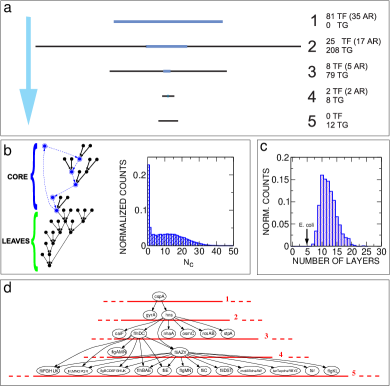
The importance of hierarchy was also quantified. As there is no straightforward definition of hierarchy in general for networks including feedback, we have used the total number of layers in the tree-like input and output branches of the network as practical definition of hierarchy. This also corresponds to the number of iterations of the leaf-removal algorithm (see, however, alternative definitions of hierarchy in Supplementary Note S5). Note, in particular, that it correctly recovers the actual number of hierarchical layers for tree-like directed graphs (overlooking possible self-regulatory links as in the case of Shen-Orr dataset). Comparisons with null models were restricted to randomized networks with the same regulatory core size. Remarkably, the number of hierarchical layers was found to be considerably lower than in typical randomized network counterparts for both Shen-Orr and RegulonDB 5.5 datasets, see Fig. 1c and Fig. S5.11 and Supplementary Note S5.
Evolutionary Drives.
What is the evolutionary origin of this peculiar structure? There are three main mechanisms for the evolution of a transcription network. (1) Gene duplication, (2) rewiring of links by mutation/selection of TF/DNA interactions (3) horizontal gene transfer. All three mechanisms, which we discuss below in the context of transcription network evolution, have been shown to play a substantial role in prokaryote evolution BLA+04 ; PPL05 ; TB04 ; CW03 ; DMA05 ; MBV05 . For clarity, the following discussion refers only to the Shen-Orr dataset, which is still to date the most widely used dataset. The same detailed analysis on the RegulonDB 5.5 dataset is discussed in a dedicated section S5 in the Supplementary Note.
Duplication.
Following previous analyses TB04 ; MBT03 , we define proteins that are likely to share a common ancestor through structural domain assignments of the SUPERFAMILY database GKH+01 . These domains allow for the definition of larger classes than sequence comparison alone TB04 . The database enables to associate an ordered sequence of domains, or “domain architecture” to each protein. We define protein homologs as proteins whose domain architectures are identical neglecting domain repeats 111This corresponds to a conservative view of homology where no domains are acquired or lost after duplication. More flexible and realistic definitions of homologs, yield essentially the same results (Supplementary Note S2). We have analyzed the distribution of regulatory links between and within classes of likely duplicate genes. The statistical significance of the analysis in terms of homology classes is established TB04 by comparison with random shufflings of genes (TFs and TGs separately) between classes.
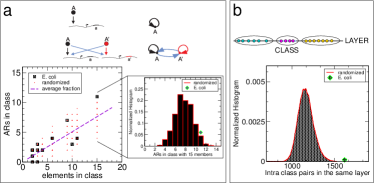
The first result, summarized in Table 1a (see also Supplementary Table S5.1a), shows that duplicates of ARs tend to retain their self-links. We quantified this using two global parameters, and . is the average fraction of ARs in classes with two or more ARs. It measures the tendency to have many ARs in one class if two are already present (the reason of the cutoff is to exclude from the count classes with two members and only one AR). is the variance across classes of the fraction of ARs within a class. This parameter measures the tendency to have classes that are more populated than average, and at the same time classes that are less populated than average, which can be observed in Fig. 2a (and Supplementary Fig. S2.5). In spite of this strong evidence for the proliferation of ARs through duplication events, we already mentioned the absence of any two-node feedback loops between homologous (or non-homologous) ARs 222This is not strictly true for the more recent RegulonDB 5.5 dataset, where a few of these two-node feedback loops are observable, though the signature for negative selection remains (see Supplementary Note S5). This requires that the initial cross-regulation between duplicated ARs (reflecting the fact that binding sites are initially identical) is systematically suppressed even if self-regulation is conserved for both TF copies (Fig. 2a). We also find that single regulatory links between any kind of TFs in the same homology class are very scarce and always involve at least one AR (see Fig. S2.7). On average, of the links within a homology class of TFs are self-links.
A simple duplication-divergence model (Fig. 2a and Supplementary Note S3) shows that the concomitant conservation of self-links and cancellation of cross-talks between duplicated ARs require a selective pressure for evolutionary decoupling. This can be achieved through divergent coevolution PKT06 ; TB04 of duplicate TF/DNA binding interactions. For instance, a straightforward analysis of the binding sites of CRP and FNR, two duplicate ARs regulating many TGs having no cross-regulation, shows that their own DNA cis-regulatory regions have higher specificities than the cis-regulatory regions of most of their TGs (See Supplementary Note S4), which suggests decoupling of their self-regulatory links.
Layer Hierarchy and Rewiring.
As shown in TB04 , a large fraction of the non-self-regulatory links of the E. coli transcription network likely originated from duplication events. Indeed, many pairs of TGs from the same homology class are regulated by a common TF; likewise, many homologous TFs regulate the same TGs, and many pairs of TFs from the same homology class regulate homologous pairs of TGs. Clearly, the likely duplication events underlying this transcription network expansion conserve the number of TFs upstream of each target, hence leaving the layer hierarchy untouched. The only duplication event that can actually add a layer is the duplication of an AR, provided that a crosstalk is conserved. A comparison of the homology classes with the populations of the network layers (Fig. 2b, Table 1b, Supplementary Table S5.1a, and Supplementary Note S2), shows that globally genes of the same homology class tend to populate the same layer.
In fact, we find only 5 non-self-regulatory links within homology classes (see Supplementary Fig. S2.7) and they all involve at least one AR, suggesting that they originated from duplication events of an AR. For example, the histone-like autoregulator H-NS, belonging to layer 2, regulates its homolog StpA, which belongs to layer 3 (Supplementary Fig. S2.7). Yet, the coincidence between the number of non-self-regulatory links within homology classes and the number of hierarchical layers in E. coli, does not allow to conclude that the layers were generated by AR duplication events. Evidence for some presumed rewiring of regulatory links also exists. For instance, the same AR H-NS (Supplementary Fig. S2.7) is also regulated by the cold shock protein CspA, which neither regulates any homologs of H-NS, nor has any homolog itself in the dataset. It is thus likely that this incoming regulatory link of H-NS does not come from duplication, but rather, from rewiring. Thus rewiring could also be a mechanism for creation of new computational layers. However, we find also indications that de novo rewiring of regulatory links is limited by the network hierarchy. With respect to randomized instances, there is smaller dispersion of TG homology classes over multiple layers of computation than observed for TF homology classes. This can be quantified for example by the Z-score of the number of gene pairs in the same layer and class; the higher this quantity, the more duplication dominates on rewiring. We find for layer one (entirely made of TFs), while for layer two (dominated by TGs). This is consistent with an evolutionary scenario leading to an early structuration of the transcriptional network into a few hierarchical layers of computation (from duplication of ARs and limited rewiring as well) followed by a primarily lateral expansion of TGs (mostly by duplication).
Altogether, these observations lead us to conclude that maintaining a “shallow” layer structure, where most of the computation is performed at the single layer level, seems to be important for the E. coli transcription network. A possible rationale for this fact is that the time taken by a computational cascade involving multiple layers is expected to be roughly proportional to the number of layers REA02 . Thus, since the network has to react to a particular stimulus or environment by “switching on” the proper genes without unnecessary delays, having many layers might be disadvantageous. For this reason, it could be interesting to target studies to the sub-systems that make use of multi-layer computation (Fig. 1d).
![[Uncaptioned image]](/html/q-bio/0701035/assets/x3.png)
Horizontal Gene Transfer.
Finally, let us focus on horizontal gene transfer. We investigated the role of transferred genes with respect to their position in the network and in the homology classes (Table 1c, Supplementary Table S5.1b). For this purpose, we used lists of genes likely to be transferred in E. coli from ref. PPL05 . These lists were obtained by a phylogenetic tree reconstruction based on 51 bacterial species. With a gain/loss penalty of two, of the genes in the network are classified as gene gains. We find that most of the gene gains are target genes. Comparison with a simple binomial null model shows that most TFs are not likely to have been horizontally transferred, while transferred TGs are abundant. Hence, one can conclude that in analogy with E. coli metabolic network PPL05 , imported genes are mainly found at the “periphery” of the network. Furthermore, transferred TGs are not found in large homology classes, defining instead mostly single-gene classes, suggesting that gene duplications preceded many horizontal gene transfers. Overall, this is consistent with a view of prokaryote evolution based on ancient duplications and conservation of a “stable genetic core” despite widespread horizontal gene transfers CD04 ; PPL05 .
In conclusion, our findings confirm the importance of (probably ancient) duplications for the evolution of this network, and pinpoint to some important trends due to selective pressure and evolutionary dynamics, namely, preservation of ARs and cancellation of crosstalks, as well as a propensity for a feedforward structure with a small number of computational layers. The layered hierarchy of E. coli transcription network appears to have first emerged and laterally expanded from duplication of a few ARs. Overall, this supports an evolutionary scenario based on duplication TB04 (with duplicates occupying the same layer) and selective deletion of crosstalks between autoregulators (which would otherwise increase the number of hierarchical layers). Further duplication-driven lateral expansions of TG homology classes have then taken place together with widespread horizontal gene transfers of new TGs.
METHODS
Datasets.
We used the Shen-Orr and RegulonDB 5.5 datasets for the transcription network SMM+02 ; SSG+06 . Domain architecture data were taken from the SUPERFAMILY database GKH+01 , version 1.61, as in the datasets of ref. TB04 . More recent versions of SUPERFAMILY (we tested 1.69) or the transcription network SSG+06 do not change the conclusions. The dataset of likely horizontally transferred genes was generously provided by the authors of ref. PPL05 . Finally, the binding sites for the clustering analysis FNR and CRP (see Supplementary Note S4) were taken from the regulonDB SSG+06 dataset.
Network Analysis.
We used Fortran 77 implementations of different variants (see Supplementary Note S1) of the leaf-removal algorithms on the Shen-orr data-set (including ARs) and its randomized counterparts, which were obtained using a standard Markov Chain Monte Carlo (MCMC) algorithm that preserves the degree sequence (marginals of the adjacency matrix) RJB96 . This algorithm is best formulated for the adjacency matrix of the graph, i.e. the matrix such as if , and 0 otherwise. We considered unstructured counterparts of . Randomizations with no self-links or structurally zero diagonal of , lead to different results. For all the tree-like instances, the number of layers correspond to the (whole-graph) iterations that are necessary for the leaf-removal algorithm to remove the entire graph. In order to consider a significant sample, the number of MCMC iterations was calibrated according to the number of accepted MCMC moves RJB96 . Specifically, we stopped the algorithm after accepted moves, where is the number of nonzero elements of , and .
Evaluation of Duplications.
We constructed classes of homologous genes using similarity criteria of the SUPERFAMILY domain architecture. Results given in the body of the paper refer to the case where two genes are considered homologs if they share the same domains in the same order, neglecting domain repeats. A gap is considered a domain. Different choices lead to very similar results (see Supplementary Note S2). For this analysis, proteins coded by the same operon were considered as separate entities. Many classes generated this way, such as , are supported by evidence based on protein sequence comparison. The classes of proteins obtained this way were compared with TF-TG links in the transcription network data-set. Observations related to these classes were compared to randomizations that shuffle domain associations to gene names, separately for TFs and TGs TB04 . The data given in the body of the paper correspond to randomizations.
Graph Growth Model.
A simple model of duplication-divergence was considered, where at each time step duplication of the graph is followed by cancellation of links with prescribed probabilities (Supplementary Note S3). We analyzed the evolution equations for the fraction of ARs and of intra-class links, in the different scenarios of symmetric and asymmetric divergence, presence or absence of selective conservation of ARs, presence or absence of constant inflow of ARs. The results were compared with the observed trends in the data.
Analysis of Horizontal Gene Transfers.
We used lists of imported genes obtained by a phylogenetic tree reconstruction based on 51 bacterial species PPL05 . We presented results obtained with a gain/loss penalty of two and the hypothesis of retarded transfer, or “DELTRANS” assumption. Different choices lead to similar results (data not shown). To evaluate the partition of transferred genes between TFs and TGs, we compared with a simple binomial model where the probability of import is given by the total fraction of imported genes. As a null model for the number of imported genes that appear in homology classes, we considered classes generated by shuffling associations of genes with domain architectures as above.
Specificity of TF Binding Sites.
Binding sites of two duplicate TFs were scored against their logos Sch02 , obtained with the list of all available binding sites from RegulonDB. The specificity was defined as the difference between the scores of the same binding sites on two different logos. To improve the sensitivity, logos were computed keeping into account reverse-complement sequences and the entropy of mixing of the sets of binding sites of the two TFs under exam (see Supplementary Note S4).
Acknowledgements.
We thank M. Lercher for generously providing and illustrating data from ref. PPL05 , H. Salgado for help with the regulonDB dataset, B. Vischioni, U. Alon, F. Poelwijk, P. ten Wolde, J. Widom, M. Vergassola and F. Kepes for stimulating discussions.References
- (1) Babu, M.M., Luscombe, N.M., Aravind, L., Gerstein, M. & Teichmann, S.A. (2004) Curr Opin Struct Biol 14, 283–91.
- (2) Shen-Orr, S.S., Milo, R., Mangan, S. & Alon, U. (2002) Nat Genet 31, 64–8.
- (3) Salgado, H., Santos-Zavaleta, A., Gama-Castro, S., Peralta-Gil, M., Penaloza-Spinola, M.I., Martinez-Antonio, A., Karp, P.D. & Collado-Vides, J. (2006) BMC Bioinformatics 7, 5.
- (4) Lee, T.I., Rinaldi, N.J., Robert, F., Odom, D.T., Bar-Joseph, Z., Gerber, G.K., Hannett, N.M., Harbison, C.T., Thompson, C.M., Simon, I., Zeitlinger, J., Jennings, E.G., Murray, H.L., Gordon, D.B., Ren, B., Wyrick, J.J., Tagne, J.B., Volkert, T.L., Fraenkel, E., Gifford, D.K. & Young, R.A. (2002) Science 298, 799–804.
- (5) Harbison, C.T., Gordon, D.B., Lee, T.I., Rinaldi, N.J., Macisaac, K.D., Danford, T.W., Hannett, N.M., Tagne, J.B., Reynolds, D.B., Yoo, J., Jennings, E.G., Zeitlinger, J., Pokholok, D.K., Kellis, M., Rolfe, P.A., Takusagawa, K.T., Lander, E.S., Gifford, D.K., Fraenkel, E. & Young, R.A. (2004) Nature 431, 99–104.
- (6) Milo, R., Itzkovitz, S., Kashtan, N., Levitt, R., Shen-Orr, S., Ayzenshtat, I., Sheffer, M. & Alon, U. (2004) Science 303, 1538–42.
- (7) Warren, P.B. & tenWolde, P.R. (2004) J Mol Biol 342, 1379–90.
- (8) Teichmann, S.A. & Babu, M.M. (2004) Nat Genet 36, 492–6.
- (9) Ma, H.W., Buer, J. & Zeng, A.P. (2004) BMC Bioinformatics 5, 199.
- (10) Ma, H.W., Kumar, B., Ditges, U., Gunzer, F., Buer, J. & Zeng, A.P. (2004) Nucleic Acids Res 32, 6643–9.
- (11) Yu, H. & Gerstein, M. (2006) Proc Natl Acad Sci U S A 103, 14724–31.
- (12) Thieffry, D., Huerta, A.M., Perez-Rueda, E. & Collado-Vides, J. (1998) Bioessays 20, 433–40.
- (13) Charlebois, R.L. & Doolittle, W.F. (2004) Genome Res 14, 2469–77.
- (14) Pal, C., Papp, B. & Lercher, M.J. (2005) Nat Genet 37, 1372–5.
- (15) Thomas, R. (1973) J Theor Biol 42, 563–85.
- (16) Cosentino Lagomarsino, M., Jona, P. & Bassetti, B. (2005) Phys Rev Lett 95, 158701.
- (17) Wall, M.E., Hlavacek, W.S. & Savageau, M.A. (2004) Nat Rev Genet 5, 34–42.
- (18) Becskei, A. & Serrano, L. (2000) Nature 405, 590–3.
- (19) Atkinson, M.R., Savageau, M.A., Myers, J.T. & Ninfa, A.J. (2003) Cell 113, 597–607.
- (20) Conant, G.C. & Wagner, A. (2003) Nat Genet 34, 264–6.
- (21) Dekel, E., Mangan, S. & Alon, U. (2005) Phys Biol 2, 81–8.
- (22) Mazurie, A., Bottani, S. & Vergassola, M. (2005) Genome Biol 6, R35.
- (23) Madan Babu, M. & Teichmann, S.A. (2003) Nucleic Acids Res 31, 1234–44.
- (24) Gough, J., Karplus, K., Hughey, R. & Chothia, C. (2001) J Mol Biol 313, 903–19.
- (25) Poelwijk, F.J., Kiviet, D.J. & Tans, S. (2006) PLoS Comput Biol 2, 0467.
- (26) Rosenfeld, N., Elowitz, M.B. & Alon, U. (2002) J Mol Biol 323, 785–93.
- (27) Rao, A.R., Jana, R. & Bandyopadhyay, S. (1996) Indian J. Stat. 58(A), 225–242.
- (28) Schneider, T.D. (2002) Appl Bioinformatics 1, 111–9.