]
Phase transition in the collective migration of tissue cells: experiment and model
Abstract
We have recorded the swarming-like collective migration of a large number of keratocytes (tissue cells obtained from the scales of goldfish) using long-term videomicroscopy. By increasing the overall density of the migrating cells, we have been able to demonstrate experimentally a kinetic phase transition from a disordered into an ordered state. Near the critical density a complex picture emerges with interacting clusters of cells moving in groups. Motivated by these experiments we have constructed a flocking model that exhibits a continuous transition to the ordered phase, while assuming only short-range interactions and no explicit information about the knowledge of the directions of motion of neighbors. Placing cells in microfabricated arenas we found spectacular whirling behavior which we could also reproduce in simulations.
pacs:
87.17.Aa, 87.17.Jj, 87.64.RrI Introduction
The collective motion of organisms is a spectacular phenomenon sometimes involving huge schools of fish, thousands of birds exhibiting complex aerial displays parrish , herds of quadrupeds and even bacteria producing fractal colonies czirokpre or amoeba assembling into rotating aggregateslevine_1999 . Recently, sperm cells were also demonstrated to form self-organized vortices collective_sperms . In addition to being a common mechanism by which organisms self-organize, a deeper understanding of the simultaneous adjustment of the velocities of many moving objects has important potential applications ranging from the swarming of distributed robots exploring new territories jadbabaie to the healing of wounds related to the coherent migration of epithelial cells collective_epithelial_cells_on_collagen .
Although widely observed in nature, collective motion is less accessible for experimental investigations under laboratory conditions. Becco et al. fish have presented interesting but only qualitative results. A well controlled series of experiments aimed at characterizing the nature of the transition from a disordered to an ordered phase in velocity space is so far lacking, even though such experiments would be useful both in providing a quantitative reference for further experimental studies and in prompting more realistic models for group behavior. While laboratory observations have been scarce, a number of models based on self-propelled particles have been developed recently (see, e.g., Refs. vicsek ; toner ; gregoire ; shimoyama ; mikhailov ; levine_2000 ; erdmann ) to describe collective motion. In broad terms these models fall into two categories, those which describe the onset of collective motion as a transition to an ordered state in a large noisy system with simple interactions between the particles vicsek ; gregoire ; toner , and those which employ more complicated – consequently more realistic – interactions and focus on the emergent collective dynamics of groups of finite size shimoyama ; mikhailov ; levine_2000 ; erdmann . A model, however, that combines simple short-ranged interactions, detailed realistic dynamics and a well defined kinetic transition in a large noisy system has not been described so far.
In this paper we present experimental results concerning the collective migration of a large number of tissue cells (keratocytes) using long-term videomicroscopy. As the overall density of the migrating cells is increased, we observe a kinetic phase transition from a disordered (low density) state into an ordered (high density) state, in which most of the cells move in a direction approximately agreeing with their average direction of motion. Just below the transition a complex picture emerges with interacting groups of cells moving in random directions. Motivated by these experimental results we develop a flocking model, which, in contrast to previous models, considers a minimal realistic interaction that assumes no explicit averaging of the directions of motion, while also exhibiting a transition to the ordered phase. Numerical studies indicate that this transition is continuous and belongs to the same universality class as the model of Vicsek et al. vicsek . These results compel us to imply that the experimental transition described is continuous as well.
II Experimental Setup and Results
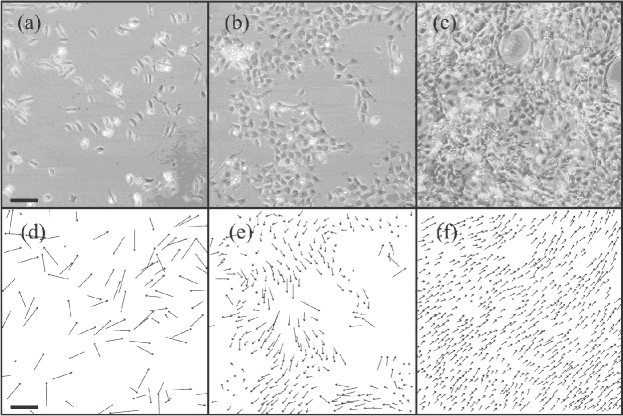
Our experimental setup, consisting of a home developed fully computer-controlled time-lapse microscope jojo and a custom made room temperature mini-incubator allowed us to carry out long-term videomicroscopy of keratocytes together with a quantitative analysis of their motion. We collected 2–4 fish scales from living goldfish (Carassius auratus) with tweezers, and placed them external side up in a 35-mm circular Petri dish similarly to Ref. Borisy_keratocytes . Scales were kept in the incubator overnight to allow epidermal keratocyte cells to migrate out from the scales. Before time-lapse microscopy scales were removed, and the cells remaining in the Petri dish were treated with phosphate saline buffer and/or trypsin to obtain cultures of varying density (both compounds reversibly weaken cell-cell and cell-substrate connections, allowing the removal of a controllable percentage of the cells). During the subsequent typically 24–h long time-lapse microscopy experiments we monitored the motion of live keratocyte cells (taking pictures in several fields of view at frequency of 1 shot per minute) in cultures of varying density ranging from sparse ones with very low cell densities to confluent ones with nearly complete coverage. We observed a relatively sharp transition from random motility to an ordered collective migration of dense islands of cells as the density was increased. Fig. 1 shows the typical behavior of cells for three different densities. The technical details of the experiment are described in the online supplemental material online .
In order to quantify the level of coherence of the migration pattern of cells –the individual motion of which are usually described as a persistent random walk Selmeczi – we calculated the velocity of 20-30 cells in each experiment from their displacement between frames. This process yielded the velocity vectors of cells, where is the index of the cell, is the time elapsed from the start of the cell’s trajectory and denotes the time difference between frames. We define as the measure of coherence of motion an order parameter equal to the time average of the sum of the normalized velocities divided by the number of cells measured. Thus, the order parameter is
| (1) |
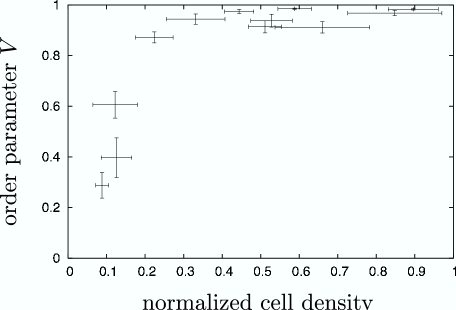
where is the number of evaluated cells. Fig. 2 displays the order parameter as a function of cell density. Our measurements were carried out after the cells had had sufficient time to migrate out of the scales and achieve a quasi-stationary migration. was calculated by averaging over the observation time and its standard error was calculated by dividing the standard deviation by , where is the number of analyzed snapshots. We attempted to survey the extent of finite size effects, by calculating the order parameter and its error, while considering only half the number of available cells. We found no significant deviation. Cell density was measured locally, i.e. in the field of view, every 30 minutes. Both its mean value and the standard error of the mean is presented in Fig. 2. A sharp increase can be observed around 5 10-4 cells/m2.
We conclude that a kinetic phase transition takes place from a disordered into an ordered state as cell density exceeds a relatively well-defined critical value. Our experiments suggest that short-range attractive–repulsive intercellular forces alone are sufficient to organize motile keratocyte cells into coherent groups.
III Model Description and Results
To interpret the above phase transition-like ordering phenomenon we constructed a model that takes into account the specific features of the experimental system and is able to reproduce experiential behavior. In our model individual model cells (self-propelled particles) move forward in a well defined direction with constant speeds. The noisy nature of the processes which generate cell locomotion is taken into account by considering the direction of self-propulsion of model cells to be noisy. Intercellular forces through which model cells interact are considered to be short-ranged, as between keratocytes they are the result of direct physical contact. Further, regarding interactions between keratocyte cells, it is obvious that explicit averaging of the directions of motion employed in previous models is not realistic. Tissue cells forming coherently migrating groups are unable to explicitly adjust their direction of motion to the average velocity of their neighbors, collective motion must emerge solely as a result of direct cell to cell interactions (forces). To model the emergence of collective motion without such explicit averaging, we consider self-propelled particles (model cells) that attempt to adjust their direction of motion toward the direction of the net-force acting on them.
The 2-dimensional motion of model cell with position is described by the overdamped dynamics:
| (2) |
Thus, each cell with mobility attempts to maintain a self-propelling velocity of magnitude in the direction of the unit vector and experiences intercellular forces . The direction of the self-propelling velocity , described by the angle , attempts to relax to with a relaxation time , while also experiencing angular noise :
| (3) |
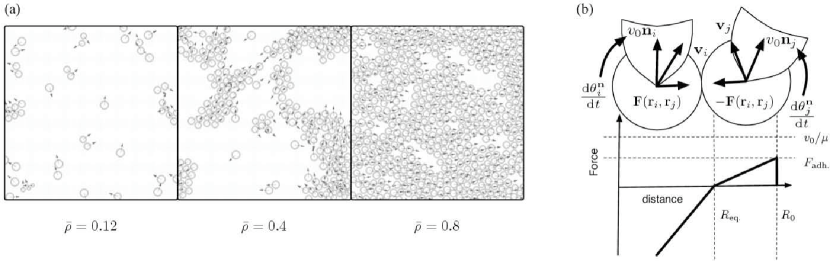
where is a unit vector orthogonal to the plane of motion (see Fig. 3b) and is a delta correlated Gaussian white noise term with zero mean, ie. and . We consider pairwise inter-cellular forces whose magnitude is a function of the distance between the two centers of mass only. Aiming for simplicity we present results obtained by using a piecewise linear force function, the existence of the transition we describe, however, does not depend on the specific form of the function employed. The piecewise linear force function we considered was repulsive for distances smaller then , attractive for distances and zero for cells farther apart, i.e.
| (4) |
where , , is the value of the maximum repulsive force at and is the maximum attractive force (resulting from adhesive interactions between cells) at (see Fig. 3b). The values , , , , , and were used, the results obtained, however, were not sensitive to the particular choice for the parameter values. The parameters of the function (4), the slope of the two linear segments ( and ) and the equilibrium distance , were adjusted while observing the simulations and comparing them with experimental videos (cf. online supplemental material), in order to achevie best possible agreement with the experiments. The two main criteria were: i.) the reproduction of the 2-dimensional sheet-like motion, wherein individual cells only interact with their nearest neighbors – i.e. cells have a well defined volume and ii) the ability of cells to “break free” from each other. The first was readily achievable by setting the slope of the repulsive force segment to be sufficiently larger than the that of the attractive segment and the value of sufficiently larger than , while the second necessitated that the maximal value of the attractive segment be set smaller then .
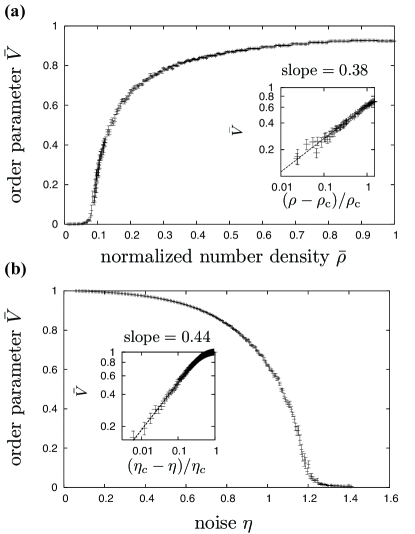
We carried out simulations (Fig. 3a) by solving the system of differential equations (2) and (3) with periodic boundary conditions in systems of size using a fixed time step of . The angular noise term was modeled by choosing its magnitude uniformly from the interval . In good agreement with experiments, running our model resulted in a continuous transition to the ordered phase (where all cells move in a common direction) as the number density of cells was increased for a fixed value of the noise (Fig. 4). While varying the value of was not experimentally feasible, simulations show that a continuous transition to the ordered phase also takes place as is decreased while is held fixed (data not shown, see online supplemental material online ). In both cases we calculated the order parameter (1) using the velocities obtained from the numerical solution of (2) and (3). and its standard error were calculated by averaging over at least independent simulation runs each at least an order of magnitude longer than the typical velocity autocorrelation time (which was found to be in the range of ). The values and were found for the critical density and noise from simulations of systems with and at fixed values of and respectively. Based on the assumption that our model exhibits a kinetic phase transition in the thermodynamic limit analogous to the continuous phase transition in equilibrium systems, we proceeded to study it’s critical behavior, that is,
| (5) |
where and are the critical exponents and and are the critical noise and density. Analysis of the data yielded the values and , strongly suggesting that our model belongs to the same universality class as the angular noise model of Vicsek et al. vicsek , for which and .
When two cells approach each other close enough, equation (3) leads to a gradual alignment of their direction of motion. Our model is in this sense similar to other models of systems of self-driven particles exhibiting emergent collective motion – i.e. flocking –, with the very important difference that the particles – the cells – do not directly use information on the movement of others around them to determine their own movement. Also, while several other models include self-propelling particles, which interact through various forces (and the seminal work of Shimoyama et al. shimoyama has alignment dynamics similar to ours), they all rely on either long-range forces shimoyama ; erdmann , explicit averaging vicsek or both levine_2000 . The model presented above, on the other hand, combines an experimentally motivated minimal dynamics with short-range adhesive and repulsive forces, while also displaying a continuous kinetic transition to the ordered state.
IV Effects of boundary conditions
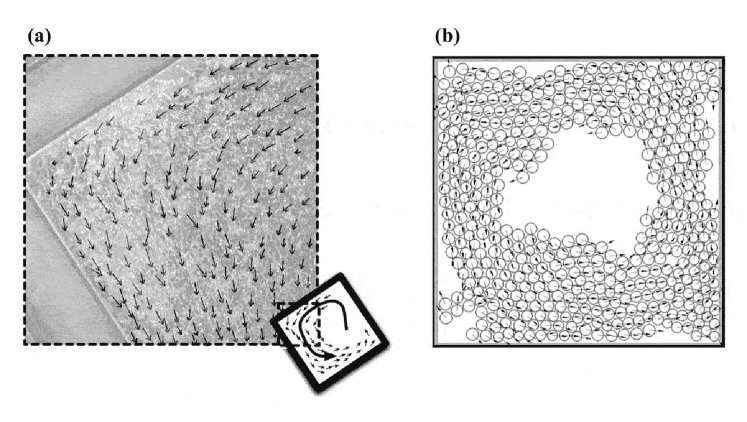
To investigate the effects of boundary conditions on collective cell motility, we used square as well as more complex shaped microfabricated arenas, which kept cells in a well defined area. Microstructures were fabricated by UV-curing Norland optical adhesive (NOA63) on the surface of glass cover slips using UV lithography. The typical diameter of the structures was 2 mm with 0.8 mm high walls. In closed 2D square shaped arenas we observed the roundabout motion of large cell groups. Fig. 5 shows an experimental snapshot of the circular motion with the instantaneous velocities of cells in the corner of a square shaped arena. A spectacular sustained whirling motion of the cells can be seen in the corresponding supplemental video online .
We were also able to reproduce the above effects of boundary conditions on cell motion in simulations similar to those described in the previous section. Placing model cells in a square box with repulsive walls implemented through adding a repulsive force with an exponential falloff and finite a cutoff to the right side of equation (3) corresponding to each of the four walls
| (6) |
where is the distance between cell and any of the four walls with unit normal vector and . In simulations cells circulated in an organized fashion under a wide range of noise and density values as well as for different system sizes. The online supplemental material online contains a simulation videos showing the emergence of organized circular motion of model cells confined to a square box.
V Discussion
In summary, we have presented evidence that purely short-range forces and simple experimentally motivated dynamics can be equivalent to an effective alignment term. Drawing an analogy between our experimental and model results, we imply that the emergence of collective motion among keratocytes is an example of a continuous kinetic phase transition. Our results are also relevant in the broader context of recent work by Grégorie and Chaté gregoirechate questioning the continuous nature of the transition in the angular noise model. Our present numerical results (exponents being similar to the ones determined for the original Vicsek et al. model vicsek ) support the view mate that, in contrast with Ref. gregoirechate , angular noise models define a universality class with a corresponding continuous phase transition in the ordering of the velocities. We expect that our and similar experiments as well as the quantitative model of the observations we have provided for the collective motion of tissue cells will lead to a better understanding of such vital phenomena as wound healing or embryogenesis.
Acknowledgments
We are grateful to Dr. Gábor Csúcs for his instructive help in setting up a fish keratocyte lab in our institute. We thank Dr. Zsuzsanna Környei for her advice in cell culturing and Prof. Pál Ormos for the construction of the microfabricated structures. This study was supported by Hungarian Science Research Funds: NKFP 3A/0005/2002 and OTKA Nos. F49795, T049674 .
References
- (1) J. K. Parrish, and W. H. Hapner (eds.) Animal Groups in Three Dimensions (Cambridge University Press, New York, 1997).
- (2) A. Czirók, E. Ben-Jacob, I. Cohen and T. Vicsek: Phys. Rev. E, 54, 1791 (1996)
- (3) W.-J. Rappel, A. Nicol, A. Sarkissian, H. Levine, and W. F. Loomis Phys. Rev. Lett. 83, 1247 (1999)
- (4) I. H. Riedel, K. Kruse, J. Howard, Science, 309, 300-3 (2005)
- (5) A. Jadbabaie, J. Lin, and A. S. Morse IEEE Transactions on Automatic Control, 48 988 (2003)
- (6) H. Haga, C. Irahara, R. Kobayashi, T. Nakagaski, K. Kawabata, Biophys. J. 88, 2250-56 (2005)
- (7) Ch. Becco, N. Vandewalle, J. Delcourt, P. Poncin, Physica A 367, 487 (2006)
- (8) T. Vicsek, A. Czirók, E. Ben-Jacob, I. Cohen and O. Shochet, Phys. Rev. Lett. 75, 1226 (1995)
- (9) J. Toner and Y. Tu, Phys. Rev. Lett. 75, 4326 (1995)
- (10) G. Grégoire, H. Chaté, and Y. Tu Physica D 181, 157 (2003)
- (11) N. Shimoyama, K. Sugawara, T. Mizuguchi, Y. Hayakawa and M. Sano, Phys. Rev. Lett. 76, 3870 (1996)
- (12) A. S. Mikhailov and D. H. Zanette, Phys. Rev. E 60, 4571 (1999)
- (13) H. Levine, W.-J. Rappel and I. Cohen, Phys. Rev. E 63, 017101 (2000)
- (14) U. Erdmann, W. Ebeling and A. S. Mikhailov, Phys. Rev. E 71, 051904 (2005)
- (15) B. Szabó, Zs. Környei, J. Zách, D. Selmeczi, G. Csúcs, A. Czirók and T. Vicsek, Cell Motil. Cytoskel. 59 (1), 38 -49 (2004)
- (16) T. M. Svitkina, A. B. Verkhovsky, K. M. McQuade, G. M. Borisy, J. Cell Biol. 139 (2), 397-415 (1997)
- (17) Supplemental material including experimental and simulation videos as well as technical details of the experimental setup is available at: http://angel.elte.hu/~bszabo/collectivecells
- (18) D. Selmeczi, S. Mosler, P. H. Hagedorn, N. B. Larsen, H. Flyvbjerg, Biophys. J. 89 (2), 912-31 (2005)
- (19) G. Grégoire and H. Chaté Phys. Rev. Lett. 92, 025702 (2004)
- (20) M. Nagy, I. Daruka, T. Vicsek Physica A accepted for publication