Networks from gene expression time series: characterization of correlation patterns
Abstract
We address the problem of finding large-scale functional and structural relationships between genes, given a time series of gene expression data, namely mRNA concentration values measured from genetically engineered rat fibroblasts cell lines responding to conditional cMyc proto-oncogene activation. We show how it is possible to retrieve suitable information about molecular mechanisms governing the cell response to conditional perturbations. This task is complex because typical high-throughput genomics experiments are performed with high number of probesets ( genes) and a limited number of observations ( time points). In this paper we develop a deepest analysis of our previous work [Remondini et al.,, 2005] in which we characterized some of the main features of a gene-gene interaction network reconstructed from temporal correlation of gene expression time series. One first advancement is based on the comparison of the reconstructed network with networks obtained from randomly generated data, in order to characterize which features retrieve real biological information, and which are instead due to the characteristics of the network reconstruction method. The second and perhaps more relevant advancement is the characterization of the global change in co-expression pattern following cMyc activation as compared to a basal unperturbed state. We propose an analogy with a physical system in a critical state close to a phase transition (e.g. Potts ferromagnet), since the cell responds to the stimulus with high susceptibility, such that a single gene activation propagates to almost the entire genome. Our result is relative to temporal properties of gene network dynamics, and there are experimental evidence that this can be related to spatial properties regarding the global organization of chromatine structure [Knoepfler et al.,, 2006].
1 Introduction
Complex network theory has been used to characterize topological features of many biological systems such as metabolic pathways, protein-protein interactions, and neural networks [Jeong et al.,, 2000; Maslov & Sneppen,, 2002; Barabasi & Oltvai,, 2004; Boccaletti et al.,, 2006]. The application of network theory to gene expression data has been not fully investigated, particularly regarding the relationships between genes occurring while their expression level changes in time. Gene expression measurements have allowed an unbiased search at the genome level but the large amount of experimental data that they generate (e.g. probesets for human microarrays), as well as their complexity, has slowed down reliable modelling. An emerging and powerful approach to tackle the complexity in functional genomics experiments, is the so called perturbation method, that consists in perturbing the system with external tunable stimuli and following the changes in the gene interaction-network properties as a function of time and perturbation magnitude [Remondini et al.,, 2005; Ideker et al.,, 2001]. An experimental example of this strategy is the dataset obtained from measurements in which a single, but very important gene was conditionally switched on or off. To do this, two cell lines were genetically engineered so that one has served as a negative control (the gene was absent) and the other was provided of a reconstituted c-Myc that allowed the conditional activation by tamoxifen [O’Connell et al.,, 2003]. In this experiments, the expression level (mRNA concentration) of about 9000 genes was observed at different times, generating two time series (the basal-control and the activated-perturbed) of 5 points with 3 replicates each.
One of the key points for the application of network methodologies to genomics data is the definition of the links between elements (nodes), namely, the gene interactions from which all network properties are obtained. Several methods for links assessment have been proposed for gene expression data, such as Linear Markov Model-based methods [Holter et al.,, 2001; Dewey & Galas,, 2001] or correlation-based methods [Butte et al.,, 2000; Eisen et al.,, 1998]. We define links on the basis of the time correlation properties of gene expression measurements, as described in [Remondini et al.,, 2005].
We analyze the distributions of the most typical network parameters, like connectivity degree, clustering coefficient, betweenness centrality, and the degree-degree correlation feature. The features that characterize a specific network are those that significantly differ from a ”reference”, unstructured network model: typically the Erdös-Renyi (ER) random network is considered for such scope [Newman,, 2003]. In our case, the step of calculating the correlation matrix is a processing that introduces some structures not found in the ER ”null” hypothesis, thus we will consider as a reference the network which is obtained from the correlation matrix of randomly generated vectors of the same size than the real dataset.
We also show that correlation properties of gene expression time series measurements reflect very broad changes in genomic activity. The network features observed with real data can be explained by a model in which correlation propagates into a large portion of the genome, as should be expected in proximity of a phase transition when referring to the ”correlation length” of fluctuations.
We show that it is possible, using appropriate experimental condition, the detection, as well as the modelling of global changes in selected group of genes, such as temporal synchronization of gene expression dynamics.
A mechanism that is emerging as a possible explanation for such synchronization is a global change in chromatin structure elicited by transcription factors activity whose targets are responsible for histon modification (acetylation and methylation state) [Knoepfler et al.,, 2006].
2 Network Construction
Our network approach [Remondini et al.,, 2005] aims at characterizing the relations among the elements of a complex system (the genome and its mutual interactions). We consider the genes as the nodes of the network and, given the expression profile of gene i in time , a link exists between genes i and j if the absolute value of the correlation coefficient
| (1) |
exceeds a defined threshold. Only high values of correlation are considered, in order to reduce spurious correlations due to noise. We considered , because this is, in absolute value, higher than those requested for the statistical significance of the correlation coefficients (). We remark that similar results are obtained for values in the range [0.95:0.98]. The result is an undirected topological network specified by its adjacency matrix , from which the self links are removed (self-correlation is not relevant).
Three datasets are considered for network reconstruction: the expression time series of the genes that significantly responded to cMyc activation, referred to as the T dataset (1191 genes observed at 5 time points); the expression time series of the same genes in ”nonperturbed” state (N dataset, same size as T); a matrix of numbers sampled from the Standardized Normal Distribution (0 mean, unit variance) of the same size (R dataset). This allows to compare the perturbed state to a basal cellular state, but also to discriminate between features specific to real biological data and other due to the network construction procedure. Another way to remove network structure is achieved through random rewiring of the links, in a way to preserve single node connectivity degree (both incoming and outgoing) but removing the specificity of the connections (referred to as MS rewiring [Maslov & Sneppen,, 2002]). For some analyses we will consider also an ER network of the same size (1191x1191), with an average connectivity degree that produces a giant component, as observed in N and T datasets.
3 Modeling the Phase Transition
In response to c-Myc perturbation, gene expression profile exhibits a strong degree of temporal correlation. The time correlation matrix can be put into analogy with the correlation matrix of spin states in a disordered Potts ferromagnet [Wu,, 1982; Domany,, 1999]. In the basal state (N dataset), the spins are poorly aligned: in terms of gene expression, gene activity is organized in small modules and a global synchronization is not present. In the T case, spin alignment increases dramatically: gene activities tend to correlate (or anticorrelate) in response to a perturbation, represented in our case by artificially induced activation of a single gene.
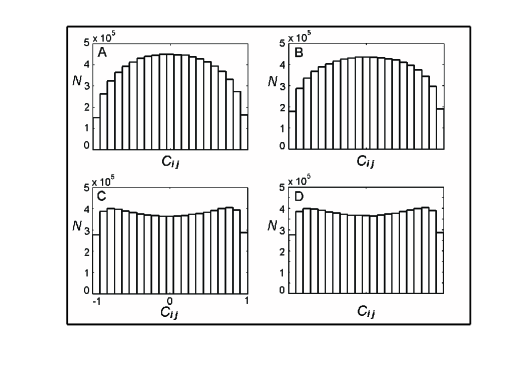
In order to quantify the perturbation extent, we generate a randomly distributed dataset of the same size of the original cMyc dataset (2976 5-dimensional random vectors sampled from a Standardized Gaussian Distribution with 0 mean and unit variance). Global correlation is introduced to various degrees by multiplying different portions of the dataset (from 0% to 100%) by the matrix of the singular values extracted from the T dataset (we define this procedure as rescaling).
A distribution of the correlation coefficients, very similar to that observed for the T dataset, is obtained when at least 90% of the data are rescaled (see Fig. 1). No such distribution for the correlation coefficients is obtained if rescaling is applied up to 50-60% of the data. Thus the cell perturbation induced by c-Myc activation produces a synchronization of gene activity that spans a large portion of the genome at various degrees. Moreover, we emphasize the fact that such a large-scale response of the genome is obtained through the perturbation (activation) of a single element (cMyc gene). This resembles the high susceptibility of a spin system when it is in a critical state close to a phase transition, in which the correlation length is of the order of magnitude of the whole system. In our case the analogy is with a paramagnetic or antiferromagnetic system, since the ”average alignment” is very close to zero, due to an identical amount of correlated and anticorrelated gene expression profiles (see Fig 1C, or figures in [Remondini et al.,, 2005])
4 Network Properties
As shown in [Remondini et al.,, 2005], connectivity degree distribution p(k) strongly reflects global changes in genome activity. Since this feature was shown to depend on the exact time series sequence, being disrupted by time shuffling, we argued that it was retrieving information embedded in real data.
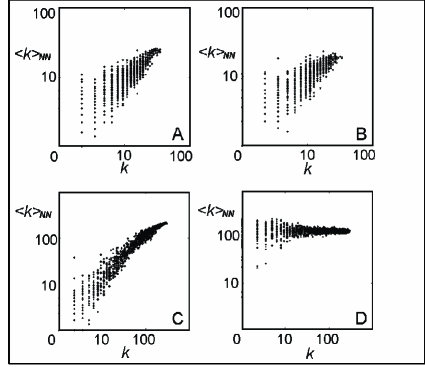
In the present work we show that some features, on the contrary, seem to be introduced by the processing for network construction. For example, the clustering coefficient C calculated for the N and T networks is much higher than compared to a random network of the same size (, , whereas ) but the R network also has . Another feature that is shared among the N, T, and R datasets is the assortative property (see Fig. 2), which means that nodes are likely to be directly connected with nodes of similar degree. Therefore also this feature is not reflecting properties of real data, but seems related to the thresholding procedure. We give the following interpretation for these observations. The high correlation relationship () can be seen as very close to an identity relationship, and a sort of transitive property is verified: if gene A is highly correlated to gene B, and B to C, very likely A will be highly correlated to C. This leads to a high density of triangles in the network (fully connected 3-node subgraphs), that justifies the unusually high clustering coefficient. Another effect of this transitive property is the stratification of connectivity leading to assortativity: if a node is highly correlated to many nodes (and thus has a high connectivity degree k), very likely these nodes will all be correlated to each other (thus they will all have similar connectivity degree). This feature is completely absent for a ER network (data not shown) and also for MS rewiring of N and T networks.
Nodes can be characterized not only by the numbers of links they have, but also by more complex features, like betweenness centrality b, that characterizes the relevance for communication between nodes in the network. Betweenness centrality distribution for the T network is much more skewed as compared to the N and R networks (data not shown). The joint distribution of b vs. k (Fig. 3) for the T network appears very different from the R and N cases. In particular, a group of genes presents a high level of b and low k.
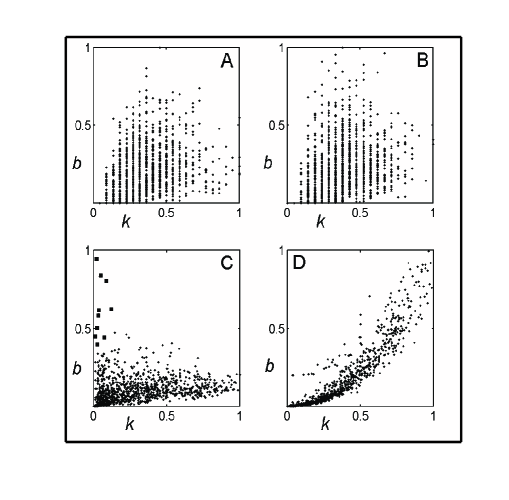
We can argue that the expression profile of these genes is thus quite different from the others (implied by the low connectivity degree), but a lot of genes are related each other through them (high betweenness): an hypothesis is that these are genes that respond early to the perturbation (and thus their profile in time is relatively unique) and guide the following gene activation cascade (thus many genes show combinations of their time profile). In the highest ranking genes (reported in Tab. 1) with respect to ratio we find genes involved in early gene transcription events and known direct (early) targets of c-Myc also involved in tumorigenesis.
| B/K | Gene | Description |
|---|---|---|
| 0.88 | Mxd3 | Max dimerization protein 3 |
| 0.70 | MGC72561 | Similar to mannosidase 2, B1 |
| 0.63 | Top2a | Topoisomerase (DNA) 2 |
| 0.47 | Lgals7 | Galectin-7 |
| 0.39 | Cdc25b | Cell division cycle 25B |
| 0.37 | Nr5a2 | Nuclear receptor subf. 5 gr. A, m. 2 |
| 0.33 | RT1-Ba | RT1 class II, locus Ba |
| 0.29 | Btnl2 | butyrophilin-like 2 (MHC class II associated) |
| 0.19 | Prkag1 | Protein kinase, AMP-activated, 1 non-catalytic subunit |
| 0.11 | Ctsd | Cathepsin D |
5 Conclusions
A contemporary challenge is to extract as much information as possible from high-throughput genomic and proteomic data. These data are usually very noisy, due to experimental techniques and the high variability intrinsic to biological organisms. Moreover, this problem is very often ill-posed, in the sense that the relationships about a very high number of elements ( genes) must be retrieved from a very small number of samples ( experiments). It is very important thus to consider methods able to reliably recover informations from this kind of data.
We shown previously that it is possible to extract information about gene-gene interaction network from a time series of gene expression measurements, both on a global scale and with respect to single gene roles and functions. In this paper we better characterized the most relevant features of the networks obtained with such method. Some features, like high clustering coefficient or the assortativity property, appear to be dependent on the network construction procedure (namely calculating the correlation matrix from the data), independently of the real data characteristics. We also show that there are relationships between network parameters (e.g. considering betweenness centrality and connectivity degree joint distribution) that are not found in ”null” network models. These relationships are significantly different also when a real dataset is considered, comparing a ”basal” and a highly ”perturbed” cell state. Considering the ratio between betweenness centrality and connectivity degree of each gene , we obtain a ranking of the genes that seems to reflect early response to the perturbation, and thus characterizes the initiation of the gene activation cascade observed experimentally.
If the correlation matrix of gene expressions is seen as the correlation of spin states of a paramagnetic/antiferromegnetic system, the perturbation induced by a single element in the genome (in our case cMyc proto-oncogene activation) propagates through almost the whole system. Continuing with the analogy, such high ”susceptibility” may suggest that the genome is behaving as in the proximity of a critical state, in which the correlation length is of a size comparable to the entire system.
Acknowledgments
D.R. and G.C. thank Italian MURST FIRB Grant, INFN FB11 Grant. and RFO (ex 60%) Grant. J.M.S. acknowledges NIH grant R01 GM41690 for support of this project
References
- Barabasi & Oltvai, [2004] Barabasi, A.L. & Oltvai, Z.N. [2004], “Network biology: understanding the cell’s functional organization”, Nat. Rev. Genet. 5, 101-113.
- Boccaletti et al., [2006] Boccaletti, S., Latora, V., Moreno, Y., Chavez, M., Hwang, D.-U. [2006], “Complex networks: Structure and dynamics”, Phys. Rep. 424(4), 175-308.
- Butte et al., [2000] Butte, A.J., Tamayo, P., Slonim, D., Golub, T.R., Kohane, I.S. [2000], “Discovering functional relationships between RNA expression and chemotherapeutic susceptibility using relevance networks”, PNAS 97(22), 12182-12186.
- Dewey & Galas, [2001] Dewey, T.G. & Galas, D.J. [2001], “Dynamic models of gene expression and classification”, Funct. Integr. Genomics 1, 269-278.
- Domany, [1999] Domany, E. [1999], “Superparamagnetic Clustering of Data”, Physica A 263, 158-169.
- Eisen et al., [1998] Eisen, M.B., Spellman, P.T., Brown, P.O., Botstein, D. [1998], “Cluster analysis and display of genome-wide expression patterns” PNAS 95, 14863-14868.
- Holter et al., [2001] Holter, N. S., Maritan, A., Cieplak, M., Fedoroff, N.V., Banavar, J. R. [2001], “Dynamic modeling of gene expression data”, PNAS 98(4), 1693-1698.
- Ideker et al., [2001] Ideker, T., Thorsson, V., Ranish, J.A., Christmas, R., Buhler, J., Eng, J.K., Bumgarner, R., Goodlett, D.R., Aebersold, R., Hood, L. [2001], “Integrated genomic and proteomic analyses of a systematically perturbed metabolic network”, Science 292(5518), 929-34.
- Jeong et al., [2000] Jeong, H., Tombor, B., Albert, R., Oltvai, Z.N., Barabasi, A.L. [2000], “The large-scale organization of metabolic networks”, Nature —bf 407, 651-654.
- Knoepfler et al., [2006] Knoepfler, P.S., Zhang, X.Y., Cheng, P.F., Gafken, P.R., McMahon, S.B., Eisenman, R.N. [2006], “Myc influences global chromatin structure”, EMBO J. 25(12), 2723-2734.
- Maslov & Sneppen, [2002] Maslov, S., Sneppen, K. [2002], “Specificity and stability in topology of protein networks”, Science 296, 910-913.
- Newman, [2003] Newman, M.E.J. [2003], “The structure and function of complex networks”, SIREV 45(2), 167-256.
- O’Connell et al., [2003] O’Connell, B., Cheung, A.F., Simkevich, C.P., Tam, W., Ren, X., Mateyak, M.K., Sedivy, J.M. [2003], “A Large Scale Genetic Analysis of c-Myc-regulated Gene Expression Patterns”, J. Biol. Chem. 278(14), 12563-12573.
- Remondini et al., [2005] Remondini, D., O’Connell, B., Intrator, N., Sedivy, J.M., Neretti, N., Castellani, G.C., Cooper, L.N. [2005], “Targeting c-Myc-activated genes with a correlation method: Detection of global changes in large gene expression network dynamics”, PNAS 102(19), 6902-6906.
- Wu, [1982] Wu, F.Y. [1982], “The Potts model”, Rev. Mod. Phys 54(1), 235-268.