The role of cell-cell adhesion in wound healing
Abstract
We present a stochastic model which describes fronts of cells invading a wound. In the model cells can move, proliferate, and experience cell-cell adhesion. We find several qualitatively different regimes of front motion and analyze the transitions between them. Above a critical value of adhesion and for small proliferation large isolated clusters are formed ahead of the front. This is mapped onto the well-known ferromagnetic phase transition in the Ising model. For large adhesion, and larger proliferation the clusters become connected (at some fixed time). For adhesion below the critical value the results are similar to our previous work which neglected adhesion. The results are compared with experiments, and possible directions of future work are proposed.
1 Introduction
When a wound heals, surrounding cells fill the wounded area by enhanced motility (i.e. diffusion) and enhanced proliferation (see Ref. [16] for a recent review). Most theoretical treatments of this process [8, 10, 14, 15] employ a reaction-diffusion equation for the cell density, equivalent to the Fisher-Kolmogorov (FK) equation [3, 7]. Another approach was taken in [1, 6], where a very simple discrete model was formulated for the similar problem of flame-front propagation. Recently, this model was applied to wound healing [2]. The model takes into account proliferation and diffusion, and for small proliferation it reduces to the FK equation. Biologically reasonable proliferation rates are small compared to rates of diffusion [13], so the front velocity is in a good agreement with experimental findings both for continuum and discrete models. However, the theoretically predicted width of the front is much larger than the one measured experimentally (see, for example, Ref. [17]).
Walker et al. [17, 18] have proposed that the answer to the paradox lies in the inclusion of cell-cell adhesion. They investigated an agent based model and observed qualitatively different regimes of cell organization for low and high values of adhesion. In order to investigate this idea further, we consider a simple discrete model which describes the phenomenon of wound healing, focusing on the key processes: cell-cell adhesion, diffusion, proliferation. Simulations of our model show two qualitatively different regimes depending on the adhesion strength, , similarly to the results of Walker et al. [17, 18]. We found that the transition between these regimes is very sharp, and related to the phase transition in the Ising model (see below). Another regime of cell organization was found, depending on the proliferation rate, . Here we report preliminary results of our study and analyze the transitions between the regimes. Finally we discuss the biological applications of our work and compare the results with experiments.
2 Formulation of the model
We will formulate our model in a way which is reminiscent of the standard ‘scratch assay’ experiment in wound healing studies [15]. Consider a square two-dimensional lattice in a channel geometry. Each lattice site can be empty or once occupied by a cell. We assume the lattice distance to be equal to cell diameter (of the order of ), taking into account hard-core exclusion. Thus, a fully occupied region of the lattice represents a confluent monolayer, that is, unwounded or healed tissue.
Initially, we put cells into the left part of the channel. We take to measure distance along the channel. In the initial state all sites with are occupied and the rest empty. Thus is the edge of the wound. For cells diffuse and proliferate along the channel. The dynamical rules which define the model are as follows: A cell is picked at random, and one of the four neighboring sites is also picked at random. If this site is empty, the cell can proliferate to this site (so a new cell is born there), or migrate there. The probability for proliferation is . The probability for migration decreases with the number of nearest neighbors so that , where is the adhesion parameter, and is the number of nearest neighbors. The case means no adhesion and brings us back to the simple model [1, 2, 6]. For nonzero , it is much harder to a cell to diffuse if it has many neighbors. After each step time is advanced by , where is the current number of cells.
As healing proceeds there is a zone in front of the healed tissue which is partly filled with cells. We call this the invasive region. We have done extensive simulations of this model. We report the results in the following sections.
3 Structure of the invasive region
Our simulations show that the dynamics and structure of the invasive zone is qualitatively different depending on the two parameters of the model: and . Figure 1 shows the phase plane and points out three different regions of parameters.
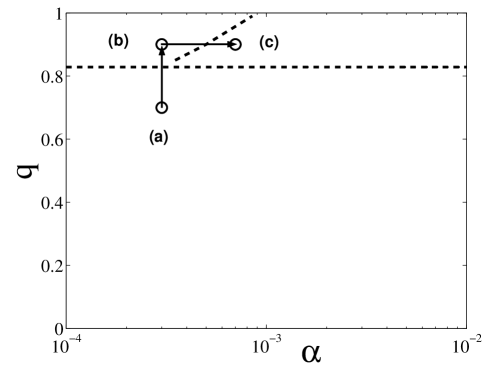
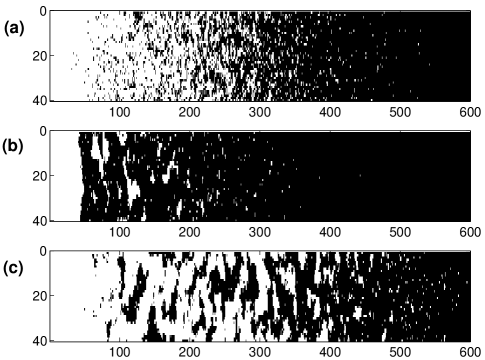
The different types of behavior are shown in Figure 2 by means of three snapshots of the system which correspond to points (a), (b), and (c) in Figure 1. Figure 2a shows the system for small proliferation and small (subcritical, see below) adhesion, region (a) in Fig. 1. Here, a front of cells propagates along the channel, both front velocity and front width are well-defined (and can be calculated as in [2]). Figure 2b shows a snapshot for the same proliferation rate and large (supercritical, see below) adhesion strength, region (b) in Fig. 1. In contrast to the propagating fronts shown in Fig. 2a, one can see a number of isolated clusters that are formed in the invasive region. However, as we increase proliferation (for the fixed adhesion parameter), another interesting transition occurs. For moderate proliferation, large clusters in the invasive zone become connected to each other and to the initial dense front, as can be seen in Figure 2c, region (c) in Fig. 1.
We can qualitatively analyze the two transitions which are shown by arrows in Fig. 1. First we focus on the transition from (a) to (b) which occurs at a fixed (and sufficiently small, see below) proliferation, when the adhesion parameter crosses critical value.
We point out that our model without proliferation can be mapped into the Ising model in statistical physics. In this mapping, an empty site corresponds to spin ”down”, an occupied site corresponds to spin ”up”, so that there is a simple relation between the average density, , and the average magnetization, , in the Ising model: . The adhesion parameter is related to the ratio of magnetic coupling and the temperature by . The mapping is possible because our dynamical rules satisfy detailed balance. Therefore, the statics of our model is the same as in the Ising model. By statics, we mean a phase diagram (or in our case) which has stable and unstable regions. In the stable region, a homogenous state (with uniformly distributed cells) remains homogenous; in contrast, in the unstable region phase separation occurs and large clusters are formed.
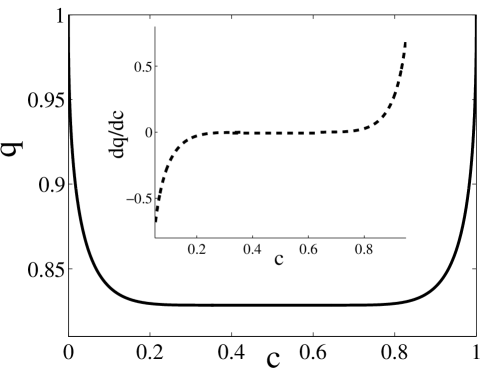
The two-dimensional Ising model was solved by Onsager [11], and the curve , which separates the stable and unstable regions, is known. In terms of average density and the critical adhesion parameter , we have:
| (1) |
The unstable region corresponds to , so for supercritical adhesion large clusters are formed. Of course, our system is not homogenous. However the density dependence of is rather slow in a wide range of intermediate densities, see Figure 3. Therefore, we can roughly estimate the critical adhesion as . This is the horizontal dashed line in Figure 1. This observation explains the different structures observed in the invasive zones of Figs. 2a and 2b (the transition from region (a) to region (b), Figure 1).
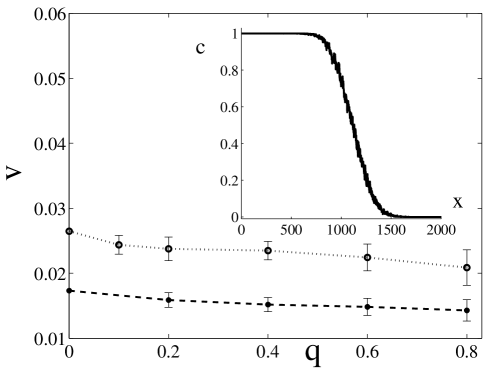
The propagation of fronts is a very important topic in statistical mechanics. It turns out that there are propagating fronts in region (a), similar to those of the FK equation [3, 7]. We averaged over a series of simulations (and over the channel width) to obtain smooth density profiles in different parameter regions. Figure 4 shows an example of such a front and a velocity of the fronts as a function of adhesion parameter for different values of proliferation. Note a rather slow velocity dependence on the adhesion parameter . Clearly, as goes to zero, the front velocity approaches its theoretical value from the FK equation, which is given in our notations by . Another important issue is the scaling properties of the front. For example, it would be interesting to analyze whether there is a KPZ roughening as in the case of zero adhesion [9]. Unfortunately, it is extremely difficult to investigate fronts roughening in this problem, because the proliferation is very small, so an intrinsic front width is quite large (see Figure 4).
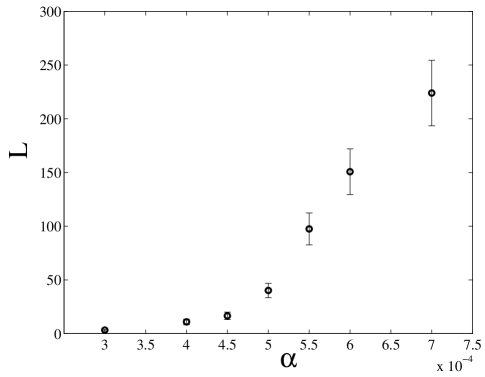
Now we turn to the transition from region (b) to region (c), see Fig. 1. We increase the proliferation parameter , keeping the adhesion parameter constant. In order to compare the results for different values of proliferation, we fix the total time of the simulations, , and measure the maximum distance (in direction) one can move through occupied sites. In other words, consider a path that passes only through occupied sites. is just the component of the longest path along the channel. Figure 5 shows the dependence of on . For small proliferation rate, is small (as the clusters in the invasive zone are not connected to each other and to initial dense region ) and it slowly increases with up to a transition point. But then a small increase in is followed by a rapid increase in as large clusters become connected, see Figs. 2c. Note that the proliferation threshold depends on time: larger proliferations are needed to get this percolation-like transition at smaller times. Therefore, the diagonal dashed line in Fig. 1, which determines the transition, is not fixed and moves to the right (to larger proliferations) for smaller times. This indicates that region (b) is a transient region. For any (biologically reasonable) proliferation and for supercritical adhesion the system is in region (b) at early times. However, at very late times there are propagating fronts with some defined width and velocity. The fronts develop well inside region (c), much later than the transition from (b) to (c) occurs. So, the transition from (b) to (c) is sharp but occurs in a transient regime. The connection to percolation problem would be an interesting direction of future research.
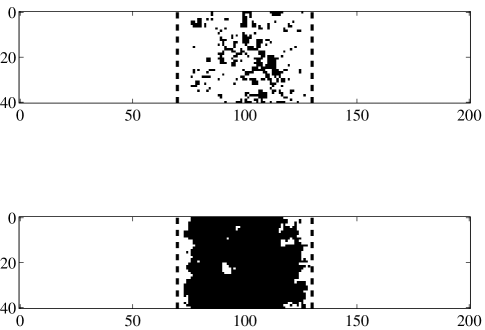
To emphasize the effect of cell-cell adhesion, we performed simulations in the geometry of a scratch assay experiment [17]. (Up until now we have considered only one side of the wound.) For the type of cells used by Walker et al. [17, 18] adhesion is controlled by the concentration of Ca++ in the system. Lower concentrations of calcium suppress adhesion, while higher concentrations promote it.
In the experiments [17] an initial width of a scratch made in a monolayer of epithelial cells was about width, which roughly corresponds to cell diameters. Since the characteristic proliferation time (of the order of day) is much larger than the characteristic hopping time (of the order of minutes), the basic time unit in our model approximately equals the hopping time. Therefore we ran our model out to a time of , which corresponds to about hours in the experiment [17]. Figure 6 shows the results of simulations both for small adhesion strength (upper panel) and large adhesion strength (lower panel) for the same value of proliferation rate. For small adhesion the front is wide and wound closure is almost complete, whereas for large adhesion there is a very sharp and slowly moving front, in a good agreement with the experiments (Figs. 7 and 8 in Ref. [17]) both for high and low adhesion. There is another point that we would like to clarify. Figure 2c shows clusters of cells separated by cell-free patches, while Figure 6 (lower panel) does not. This is due to the fact that one should consider a much larger system (by factor of ) and wait for a much longer time (by factor of ) to get the structure shown in Figure 2c.
4 Summary and discussion
In this work we presented a stochastic discrete model of wound healing. In contrast to previous modeling attempts, both discrete and continuum, we took into account the phenomenon of cell-cell adhesion. Large adhesion gives rise to sharp wound healing fronts even for very low proliferation, see Fig. 6. In general, depending on the two parameters of the model, the adhesion and the proliferation , a completely different behavior in the invasive zone can be observed.
Certainly, our model oversimplifies a complex biological process of wound repair. There are many complex biochemical processes such as calcium waves, apoptosis, etc. which we do not attempt to treat. One feature which we can treat is the fact that the model does not take into account a real biological cell cycle which may influence the dynamics. A cell cycle can be incorporated into the model in the following way which is based on the work of Walker et al. [17, 18]. Each cell is treated as an agent with its own internal time. A cell moves and adheres according to the rules described above. Additionally, its internal clock advances when it is sampled. When a cell reaches the end of the cell cycle length, mitosis occurs and the cell ceases to move for a small fraction of the cycle time. It then proliferates in a random direction with a given probability. In the limit of long times, the parameter used in the simple model corresponds to the product of the division probability and the cycle frequency. With randomized initial internal times, this model behaves very similarly to the purely probabilistic approach which we have discussed above.
Now we would like to emphasize our main new results, comparing to Refs. [17, 18]. One important new finding, resulting from our theoretical analysis, is the existence of a sharp transition between qualitatively different types of behavior in cell cultures when an adhesion parameter passes a certain value. Though qualitatively different structures for low and high adhesion were observed earlier (Refs. [17, 18]), the fact that a very small change in adhesion parameter may give a qualitatively different behavior was unknown. This result shows a deep and surprising analogy between ferromagnetic phase transition in statistical physics and transition to clustering in ensemble of cells. This analogy had not also been found prior to our work.
Another new result is the transition from region (b) to region (c), which occurs when increasing proliferation for supercritical adhesion. This transition and the detailed clusters structure for supercritical adhesion had not been investigated in Refs. [17, 18]. Finally, there is another new result, showing a typical front profile of cells density and the front velocity as a function of adhesion parameter for different values of proliferation. That possibly gives a way to theoretical treatment of the problem of cell invasion into a wound in terms of a modified Cahn-Hilliard equation.
Indeed, a promising direction of future work is continuum modeling of front propagation, both for subcritical and supercritical adhesion. A proper candidate here is Cahn-Hilliard equation, which describes the dynamics of phase separation below the critical temperature [4, 5, 12]. In our system this corresponds to supercritical adhesion and zero proliferation. Indeed, one can show [5, 12] that a variant of Cahn-Hilliard equation can be derived from discrete lattice gas model with nearest neighbors interaction. This equation applies to models with conserved order parameter (in our case, the model without proliferation). One can also try to take into account proliferation similarly to the FK equation, adding term to the Cahn-Hilliard equation. This work is in progress.
Acknowledgements
Supported by NSF grant DMS-0244419 and NIH grant CA085139-01A2.
References
- [1] M. Bramson, P. Calderoni, A. Demasi, P. Ferrari, J. Lebowitz, and R. H. Schonmann, Microscopic selection principle for a diffusion-reaction equation. Journal of Statistical Physics, 45(5-6): 905–920, (1986).
- [2] T. Callaghan, E. Khain, L. M. Sander, and R. M. Ziff, A stochastic model for wound healing. Journal of Statistical Physics, 122(5): 909–924, (2006).
- [3] R. A. Fisher, The wave of advance of advantageous genes. Annual Eugenics, 7: 355 -369, (1937).
- [4] J. S. Langer, in Solids far from equilibrium (ed. C. Godreche) 297–364 Cambridge, New York, Cambridge University Press (1992).
- [5] J. F. Gouyet, M. Plapp, W. Dieterich, and P. Maass, Description of far-from-equilibrium processes by mean-field lattice gas models. Advances in Physics, 52: 523–638, (2003).
- [6] A. R. Kerstein, Computational study of propagating fronts in a lattice-gas model. Journal of Statistical Physics, 45(5-6): 921–931, (1986).
- [7] A. Kolmogorov, I. Petrovsky, and N. Piscounov, Etude de l equation de la diffusion avec croissance de la quantite de matiere et son application a un probleme biologique. Moscow Univ. Bull. Math., 1: 1–25, (1937).
- [8] P. K. Maini, D. L. S. McElwain, and D. Leavesley, Travelling waves in a wound healing assay. Applied Mathematics Letters, 17(5): 575–580, (2004).
- [9] E. Moro, Internal fluctuations effects on Fisher waves. Physical Review Letters, 87(23): 238303, (2001).
- [10] J. D. Murray, Mathematical Biology. Springer, New York (2002).
- [11] L. Onsager, Crystal statistics. I. A two-dimensional model with an order-disorder transition. Physical Review, 65: 117–149, (1944).
- [12] M. Plapp and J. F. Gouyet, Interface dynamics in a mean-field lattice gas model: Solute trapping, kinetic coefficient, and interface mobility. Physical Review E, 55(5): 5321–5337, (1997).
- [13] We consider as an example the experiment of Sheardown and Cheng [14] on the wounding of rabbit corneas. It was shown in Ref. [2] that the typical ratio of proliferation rate and basic diffusion rate is of the order of .
- [14] H. Sheardown and Y. L. Cheng, Mechanisms of corneal epithelial wound healing. Chemical Engineering Science, 51(19): 4517–4529, (1996).
- [15] J. A. Sherratt and J. D. Murray, Models of epidermal wound-healing. Proceedings of the Royal Society of London series B - Biological Sciences, 241(1300): 29–36, (1990).
- [16] J. A. Sherratt and J. C. Dallon, Theoretical models of wound healing: past successes and future challenges. Comptes Rendus Biologies, 325(5): 557–564, (2002).
- [17] D. C. Walker, G. Hill, S. M. Wood, R. H. Smallwood, and J. Southgate, Agent-based computational modeling of wounded epithelial cell monolayers. IEEE Transactions on Nanobioscience, 3(3): 153–163, (2004).
- [18] D. C. Walker, J. Southgate, G. Hill, A. Holcombe, D. R. Hose, S. M. Wood, S. Mac Neil, and R. H. Smallwood, The epitheliome: agent-based modelling of the social behaviour of cells. Biosystems, 76(1-3): 89–100, (2004).