Reconsidering the significance of genomic word frequency
Determining what constitutes unusually frequent and rare in a genome is a fundamental and ongoing issue in genomics [6]. Sequence motifs may be frequent because they appear in mobile, structural or regulatory elements. It has been suggested that some recurrent sequence motifs indicate hitherto unknown or poorly understood biological phenomena [17]. We propose that the distribution of DNA words in genomic sequences can be primarily characterized by a double Pareto-lognormal distribution, which explains lognormal and power-law features found across all known genomes. Such a distribution may be the result of completely random sequence evolution by duplication processes. The parametrization of genomic word frequencies allows for an assessment of significance for frequent or rare sequence motifs.
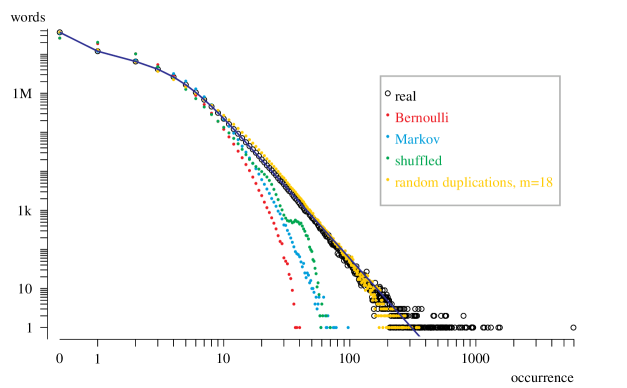
The simplest type of sequence motif is a DNA word of a fixed length , called an -mer. The number of occurrences of a word is denoted by , and the distribution of across all -mers is called the word frequency distribution or spectrum. The statistical significance of a word’s unusual abundance (or rarity) is assessed by referring to a null model of random sequences. Standard null models include sequences of independent and identically distributed letters (Bernoulli model) and low-order Markov models [16]. In such random text models, over- and underrepresentation of short words (typically, ) are evaluated by using Poisson or Gaussian approximations, implying a rapidly decreasing tail in the spectrum. It is also customary to use localized random shuffling of the studied genome sequence in order to preserve large-scale compositional heterogeneity. Empirical word frequency distributions in shuffled sequences also have a light tail.
In reality, genomic word frequency distributions have a prominent heavy tail, which is not captured by random text models (Fig. 1). Depending on the genome length and its relative size with respect to the number of -mers , the spectrum may show a power-law decrease on the left or right, or have a lognormal shape. The heavy tail on the right cannot be entirely attributed to mobile elements, as it is present even in repeat-masked vertebrate and many smaller genomes (Figures 2 and 3). Consequently, random text models and shuffling tend to underestimate the probability of frequent words in long sequences.
To this day, there has been no exact characterization of genomic spectra, aside from the observation of power-law behavior for certain word sizes [8, 9, 10] in the right-hand tail. This note aims to point out that a parametric distribution describes word frequencies extremely well in prokaryotic and eukaryotic genome sequences. The distribution in question is the so-called double Pareto-lognormal (DPL) distribution [15]. It fits many real-life size distributions, including that of wealth in society, human settlement sizes, and file sizes on the Internet. The distribution has four parameters: , , and ; it has a power-law (Pareto) tail to the left and to the right, with slopes characterized by the parameters and , respectively; in the middle, its shape is dominated by a lognormal distribution with parameters and .
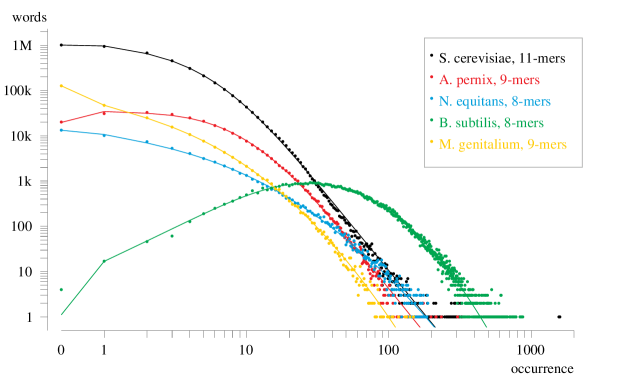
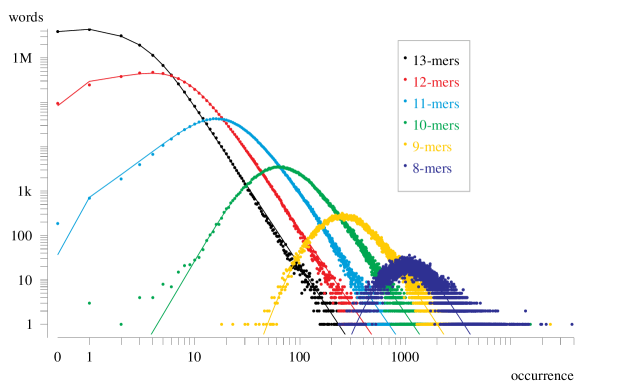
Figure 2 illustrates that a single DPL distribution’s four parameters can be adjusted to describe spectra across hundreds or thousands of word frequencies in non-vertebrate genomes. (More examples for different spectra are shown on the web site http://www.iro.umontreal.ca/~csuros/spectrum/.) For very short words with respect to the genome length (about ), the spectrum has mainly a lognormal shape. As increases, the mode of the lognormal component shifts downwards and the lower power-law tail becomes more and more discernible, followed by the appearance of the upper power-law tail. For long words (from around ), the upper power-law tail dominates the spectrum. Given that compact genomes are mostly composed of coding sequences, the upper power-law tail is another manifestation of the power law for protein domain occurrences [8].
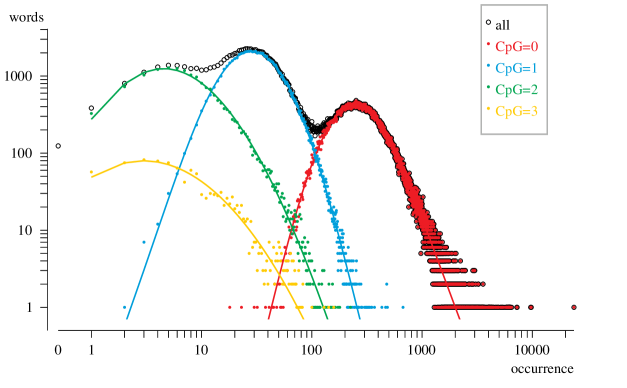
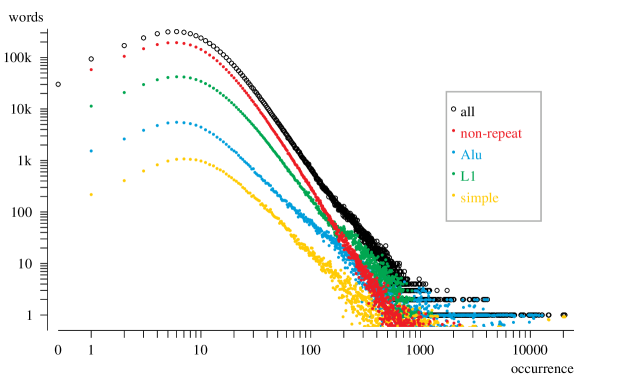
In organisms with strong dinucleotide bias, such as for CpG in vertebrates or for ApT in honey bee [2], the spectrum can be decomposed into multiple DPL distributions by dinucleotide content (Figure 4). Spectra for words without CpG dinucleotides in repeat-masked vertebrate sequences have a marked DPL shape (Fig. 3). We illustrate the analysis of a large genomic spectrum with the example of human chromosome 12, which is typical of the human genome with respect to repeat element distribution and cytosine-guanine content [19]. Abundant repeat elements may cause deviations from the DPL distribution, which may be the basis of their identification using a DPL null model, but often they are absorbed in the fundamental DPL curve (Figure 5). Table 1 analyzes the composition of the spectrum’s tail in human chromosome 12. The contribution of non-repeat sequences in the tail decreases when moving toward higher word frequencies, but it levels off at about 25%.
| 12-mers (a) | sequence (b) | non-repeat (c) | SINE (d) | LINE (e) | LTR (f) | other (g) | |
|---|---|---|---|---|---|---|---|
| 12 | 19.61 | 69.6 | 47.2 | 16.7 | 21.4 | 8.4 | 6.3 |
| 25 | 5.34 | 39.7 | 41.5 | 21.3 | 22.6 | 7.6 | 7.0 |
| 30 | 3.67 | 33.9 | 39.6 | 23.1 | 22.9 | 7.3 | 7.2 |
| 50 | 1.30 | 22.6 | 34.0 | 28.8 | 23.2 | 6.5 | 7.5 |
| 60 | 0.91 | 19.9 | 32.1 | 31.0 | 23.1 | 6.2 | 7.5 |
| 100 | 0.37 | 14.7 | 27.9 | 36.7 | 22.6 | 5.4 | 7.4 |
| 120 | 0.28 | 13.4 | 26.8 | 38.5 | 22.3 | 5.1 | 7.3 |
| 200 | 0.14 | 10.6 | 24.6 | 43.0 | 20.7 | 4.7 | 7.0 |
| 240 | 0.10 | 9.7 | 24.2 | 44.9 | 19.4 | 4.6 | 6.9 |
The power-law tail of gene family size distributions [8] can be explained by birth and death processes [5, 14]. Similar arguments apply to genomic spectra. Consider the occurrences of a particular word along the genome as a “population.” The population size is affected by mutational events, including duplications, insertions, deletions and point mutations. The population can increase by any copying mechanism, including segmental duplication and retrotranscription. The population decreases if an occurrence is destroyed by some mutation. Point mutations can create new populations, but so can insertion (at the insertion boundaries) and deletion (by bringing two halves of a word together). It is thus conceivable that a birth and death model appropriately models the spectrum’s evolution. In order to illustrate this point, we carried out a simulation experiment in which a DNA sequence evolved solely by copying. We iteratively expanded an initial random DNA sequence by selecting a contiguous piece of a fixed length in each iteration, and copying it back into the sequence at a random position. The resulting sequence exhibits the same heavy tail as the real-life sequences do (Figure 1). The parameters of the fitted DPL distribution are affected by the copy size , and further vary with the introduction of a point mutation process. It is thus likely that the DPL distribution of genomic spectra is yet another sign of ceaseless “tinkering” [4] within the genome.
Heavy-tail distributions are signs of self-similarity, or long-range autocorrelation, which has been observed before in DNA sequences [7, 12], and studied thoroughly in telecommunications engineering [18]. Long-range autocorrelation at the single nucleotide level can result from so-called expansion-randomization processes [11], which model sequence evolution by deletions, mutations and duplications.
The birth and death model implies that some words occur often simply by chance, and not because of their functionality. Words that are abundant at an early point of evolution tend to preserve their relative abundance in the course of random copy events, in accordance with the principle of “rich get richer” underlying power-law distributions. Therefore, even the high frequency of a particular word across many related species does not imply functionality on its own, as the word may have been frequent by chance in a common ancestor already. Association with genes is not necessarily a sign of functionality either, since transcribed regions that harbor a frequent word can help its propagation throughout the genome by retrotranscription.
Our investigations show that the distribution of word frequencies can be well approximated by a parametric model, the double Pareto-lognormal distribution. Such a distribution may result from a long history of evolutionary tinkering: copying, rearranging, deleting, and changing different parts of the genome. The heavy tail of word frequency distributions means that findings of frequent motifs need to be assessed with extreme care, especially if their overrepresentation is related to word occurrences in random texts.
Methods
Words were counted only on one strand of the DNA sequences (the ‘plus’ strand of the sequence file), with the exception of the 16-mers in the human genome, where both strands were scanned. We counted the occurrence of a word if it appeared in a given sequence at some position , without ambiguous nucleotides. The DPL distribution was fitted using its cumulative distribution function (cdf), which is
for and for , where denotes the cdf of the standard normal distribution. The spectrum consists of the numbers of -mers occurring exactly times for all In order to fit the distribution’s parameters, the spectrum was considered as a set of binned values for independently drawn samples from a continuous DPL distribution: was compared to the predicted value . We used custom-made programs to carry out the parameter fitting, using the Levenberg-Marquardt algorithm [13], a nonlinear least-squares method, for which the starting parameter values were set by likelihood maximization [15].
We defined CpG content of a word (Fig. 4) as the number of non-overlapping CG and GC dinucleotides in . The contribution of different annotations (Fig. 5) were computed by multiplying each value in the spectrum by the fraction of occurrences within the annotated regions for words appearing times in the entire sequence. For the random shuffling of Fig. 1, we partitioned the sequence into contiguous segments containing exactly 1000 non-ambiguous nucleotides. Non-ambiguous nucleotides were garbled in each segment by generating a uniform random permutation.
Human sequences (original and repeat-masked) and repeat annotations (Figures 1, 3,4 and 5) were obtained from the UCSC genome browser [3] gateway’s FTP server (ftp://hgdownload.cse.ucsc.edu/), for version hg18 (NCBI Build 36.1). (The repeat annotations were generated by the programs RepeatMasker [20] and Tandem Repeats Finder [1].) Other sequences (Fig. 2) were downloaded from the NCBI FTP server (ftp://ftp.ncbi.nlm.nih.gov/genomes/).
References
- [1] G. Benson. Tandem repeats finder: a program to analyze DNA sequences. Nucleic Acids Research, 27(2):573–580, 1999.
- [2] The Honey Bee Genome Sequencing Consortium. The genome of a highly social species, the honey bee Apis mellifera. 2006. Under revision.
- [3] A. S. Hinrichs, D. Karolchik, R. Baertsch, G. P. Barber, G. Bejerano, H. Clawson, M. Diekhans, T. S. Furey, R. A. Harte, F. Hsu, J. Hillman-Jackson, R. M. Kuhn, J. S. Pedersen, A. Pohl, B. J. Raney, K. R. Rosenbloom, A. Siepel, K. E. Smith, C. W. Sugnet, A. Sultan-Qurraie, D. J. Thomas, H. Trumbower, R. J. Weber, M. Weirauch, A. S. Zweig, D. Haussler, and W. J. Kent. The UCSC genome browser database: update 2006. Nucleic Acids Research, 34:D590–598, 2006.
- [4] F. Jacob. Evolution and tinkering. Science, 196(4295):1161–1166, 1977.
- [5] G. P. Karev, Y. I. Wolf, A. Y. Rzhetsky, F. S. Berezovskaya, and E. V. Koonin. Birth and death of protein domains: a simple model of evolution explains power law behavior. BMC Evolutionary Biology, 2:18, 2002.
- [6] S. Karlin. Statistical signals in bioinformatics. Proceedings of the National Academy of Sciences of the USA, 102(38):13355–13362, 2005.
- [7] W. Li and K. Kaneko. Long-range correlation and partial spectrum in a noncoding DNA sequence. Europhysics Letters, 17:655–660, 1992.
- [8] N. M. Luscombe, J. Qian, Z. Zhang, T. Johnson, and M. Gerstein. The dominance of the population by a selected few: power-law behavior applies to a wide variety of genomic properties. Genome Biology, 3(8):research0040.1 0040.7, 2002.
- [9] R. N. Mantegna, S. V. Buldyrev, A. L. Goldberger, S. Havlin, C.-K. Peng, M. Simons, and H. E. Stanley. Systematic anaysis of coding and noncoding DNA sequences using methods of statistical lingustics. Physical Review E, 52(3):2939–2950, 1995.
- [10] C. Martindale and A. K. Konopka. Oligonucleotide frequencies in DNA follow a Yule distribution. Computers & Chemistry, 20(1):35–38, 1996.
- [11] P. W. Messer, M. Lässig, and P. F. Arndt. Universality of long-range correlations in expansion-randomization systems. Journal of Statistical Mechanics, 2005. P10004.
- [12] C. K. Peng, S. V. Buldyrev, A. L. Goldberger, S. Havlin, F. Sciortino, M. Simons, and H. E. Stanley. Long-range correlations in nucleotide sequences. Nature, 356:168–170, 1992.
- [13] W. H. Press, S. A. Teukolsky, W. V. Vetterling, and B. P. Flannery. Numerical Recipes in C: The Art of Scientific Computing. Cambridge UniversIty Press, second edition, 1997.
- [14] W. J. Reed and B. D. Hughes. A model explaining the size distribution of gene families. Mathematical Biosciences, 189:97–102, 2004.
- [15] W. J. Reed and M. Jorgensen. The double Pareto-lognormal distribution — a new parametric model for size distributions. Communications in Statistics: Theory and Methods, 33(8):1733–1753, 2004.
- [16] G. Reinert, S. Schbath, and M. S. Waterman. Probabilistic and statistical properties of words: An overview. Journal of Computational Biology, 7(1/2):1–46, 2000.
- [17] I. Rigoutsos, T. Huynh, K. Miranda, A. Tsirigos, A. McHardy, and D. Platt. Short blocks from the noncoding parts of the human genome have instances within nearly all known genes and relate to biological processes. Proceedings of the National Academy of Sciences of the USA, 103(17):6605–6610, 2006.
- [18] Z. Sahinoglu and S. Tekinay. On multimedia networks: self-similar traffic and network performance. IEEE Communications Magazine, 37(1):48–52, 1999.
- [19] S. E. Scherer et al. The finished DNA sequence of human chromosome 12. Nature, 440(7082):346–351, 2006.
- [20] A. F. A. Smit, R. Hubley, and P. Green. Repeatmasker open-3.0, 1996–2004. http://www.repeatmasker.org.
Correspondence
Correspondence should be addressed to M.Cs. (www: http://www.iro.umontreal.ca/~csuros/).