Synergy from Silence in a Combinatorial Neural Code
Abstract
The manner in which groups of neurons represent events in the external world is fundamental to neuroscience. Here, we analyze the population code of the retina during naturalistic stimulation and show that the information conveyed by specific multi-neuronal firing patterns can be very different from the sum of the pattern s parts. Synchronous spikes convey more information than either of the participating cells, but almost always less than their sum, making them redundant coding symbols. Surprisingly, patterns of spiking and silence are mostly synergistic carrying information that is accessible only by observing the whole pattern of activity, rather than its components, and signifying unique features in the stimulus. These results demonstrate that the retina uses a combinatorial code and that the brain can benefit significantly from recognizing multi-neuronal firing patterns.
While much of our understanding of the brain is derived from studies of single neurons, it is clear that neural systems generally rely on populations of neurons to represent stimuli and to direct motor outputs. In particular, concerted firing among groups of neurons has been observed in many different neural systems, often occurring more frequently than would be expected if neurons were acting independently Perkel+al_67 ; meister+al_95 ; Vaadia+al_95 . However, many different views of how concerted firing patterns represent information collectively have been proposed, even within the same brain region meister+al_95 ; Vaadia+al_95 ; Abbott+Dayan_99 ; Zohary+al_94 ; dan+al_98 ; Shamir+Sompolinsky_04 ; Nirenberg+al_01 ; Schneidman+al_03b ; Puchalla+al_05 . In one view, the unreliability of single neurons requires that many neurons encode the same information, and only by averaging over large groups can encoded information be extracted reliably Shadlen+Newsome_94 . Another hypothesis is that the information conveyed by multi-neuronal spiking patterns is simply the sum of information that each of the cells conveys on its own; this view is related to ideas of redundancy reduction Barlow_61 , decorrelation Atick_92 and independent component analysis Bell+Sejnowski_97 ; vanHateren+vanderScaaf_98 , which have been suggested as design principles for efficient coding. Finally, there is the possibility of concerted coding Meister_96 , in which synchronous multi-neuronal activity patterns can be synergistic, conveying more information than the sum of contributions from the individual neurons. Such a coding scheme has the capacity to multiplex many distinct messages onto the axons of a small number of neurons.
To assess these different coding schemes, the average amount of information that small groups of cells convey about natural and artificial stimuli has been compared to the sum of single cell contributions. This analysis has been carried out in many systems vertebrate retina Puchalla+al_05 , primary visual cortex Gawne+Richmond_93 ; Reich+al_01 , primary somatosensory cortex Petersen+al_01 , the auditory pathway Chechik+al_01 and motor cortex Gat+Tishby_99 ; Narayanan+al_05 . Typically, the deviation from independence has been small, and redundancy is most common. However, synergistic response patterns may simply be rare events that have only a small effect on the average mutual information. In particular, synchronized spiking has been shown to be correlated with specific stimulus features or motor outputs meister+al_95 ; Vaadia+al_95 ; Abeles_91 ; Riehle+al_97 ; hatsopolous+al_98 , and has therefore been suggested as a special symbol in the population code of many neural circuits.
These issues can be addressed by focusing on the information conveyed by specific multi-cell activity patterns Brenner+al_00 rather than estimating the mutual information between stimuli and responses, which is an average over all multi-cell patterns Schneidman+al_03b . This is a natural framework in which to analyze a population code, because specific firing patterns are the actual neural symbols that downstream circuits encounter in real time. Using this analysis, we find significant synergy and redundancy in different patterns of ganglion cell firing. Averaged over patterns, these contributions often partially cancel, explaining the relatively low values commonly observed in previous studies. We study the stimulus features that correspond to multi-neuronal firing patterns and relate synergy to the functional properties of individual neurons. Finally, we show that similar properties emerge from a generic model of neural responses, suggesting that combinatorial coding may exist in other neural circuits, too.
Results
Simultaneous recordings were made from many ganglion cells in the salamander and guinea pig retinas using a multi-electrode array, while artificial and natural movies were presented on a computer monitor (see Methods). Movie clips 20-30 s long were repeated many times (100-150) in order to sample both the diversity and variability of ganglion cell firing patterns. An example of the spike trains recorded from two cells is shown in Fig. 1A.
Individual Neural Symbols
The amount of information that the arrival time of a neural symbol such as a spike or any other specific pattern of neuronal activity in an ensemble (see below) conveys about a complex, time-varying stimulus S is given by Brenner+al_00 :
| (1) |
where is the neural symbol, is the time dependent rate of the symbol s occurrence, and is the time average of over the entire duration of the stimulus . The symbol rate measures the probability per unit time of the symbol occurring, and is estimated in the same way as we estimate time-dependent spike rates, by forming a peri-stimulus time histogram (PSTH) using repeated trials of the stimulus. As with the conventional time-dependent firing rate for single spikes, modulations in this symbol rate reflect reproducible locking of the events to dynamic features in the stimulus. Neuronal symbols that occur with a rate that is strongly modulated by the stimulus convey more information per symbol than those with a weakly modulated rate. Notice that equation 1 depends only on the variation in the time-varying symbol rate, , compared with the average symbol rate, . Using this relationship, we estimated the information carried by different ganglion cell firing patterns (see Methods).
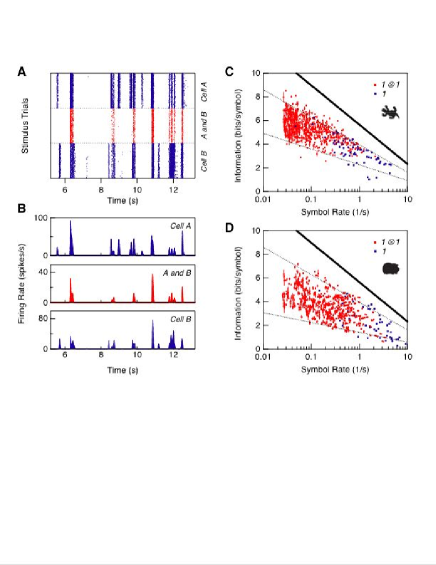
The simplest neural symbol is the single spike, denoted as . Over the whole set of natural movies, the average information conveyed by a single spike in the salamander was bits (mean standard deviation across the population; n = 204 cells) and in the guinea pig was 2.2 1.2 bits (n=59 cells). No clear dependence on the particular movie clip was observed.
For synchronous spiking among pairs of neurons, we defined the compound symbol denoting all the spikes of cell A that had a spike of cell B within 10 ms (see Fig. 1A). This narrow temporal window for synchrony matches the time scale over which excess synchronous pairs have been observed meister+al_95 and also corresponds with the typical duration of excitatory post-synaptic currents evoked by AMPA receptors Pouille+Scanziani_04 .
The information that synchronous spiking conveyed about natural movies was significantly higher than for single spikes, bits (Fig 1C; n=2887 pairs). In particular, for all cell pairs the symbol was at least as informative, and usually much more informative than either or alone (data not shown). Changing the temporal window used to define synchrony between 5 ms and 50 ms had a negligible effect on the symbol s information. Interestingly, the symbols obeyed a similar relation to that of the single spikes: given our time resolution of 20 ms, nearly all symbols conveyed an information between 40 and 70 of the maximum possible information determined by that symbol s average event rate (Fig. 1C) spikes . Similar behavior was found for the guinea pig (Fig. 1D), but with somewhat higher firing rates (4.2 1.2 Hz vs. 1.2 0.8 Hz) and lower coding efficiency ( vs. ).
Combinatorial Codes
To analyze the existence and nature of combinatorial codes in the retina, we compared the information transmitted by a compound symbol a multi neuronal firing pattern to the sum of information values conveyed by the components of the compound symbol. In the case of two neurons, we define:
| (2) |
If is zero, then the components of the compound symbol contribute independent (additive) information about the visual stimulus. Otherwise, a combinatorial code exists, and downstream circuits can benefit by interpreting multi-neuronal firing patterns as distinct coding symbols. In particular, synergy implies that the compound symbol encodes information that is not available at the level of single neuron events.
Synchronous Spiking
For natural movies, we found that synchronous spikes were significantly less informative than expected from summing the information contributed by each individual spike. The redundancy of synchronous spikes ranged up to bits in salamander (-47 of the constituent symbol information) and -2.7 bits in guinea pig (-22). For cells spaced less than 200 apart, which have overlapping receptive field centers, bits (n=2887 pairs) for salamander and -0.41 0.72 bits (n=766 pairs) for guinea pig. No clear differences were found between movie clips (n=9 clips). Synchronized firing tended to produce more negative values between nearby cells than faraway cells (Fig 2A). We found a small fraction of cell pairs with synergy for synchronous spike pairs; in almost all cases, one cell was ON-type and the other was OFF-type (data not shown).
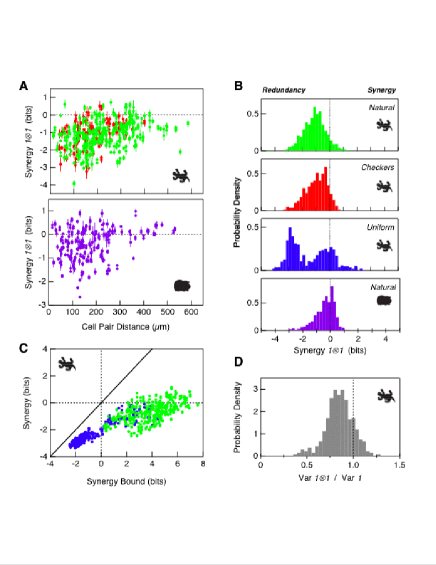
To further interpret these results, we carried out a similar analysis for artificial stimuli. In spatially uniform flicker, where all ganglion cells see the same input, the largest values of redundancy were similar to those found with naturalistic stimulation, but many more cell pairs had high values of redundancy (Fig. 2B). This makes sense because the strong spatial correlations in natural images will cause ganglion cells with highly overlapping receptive fields to experience roughly, but not exactly, the same visual input. In checkerboard flicker, where spatial correlations only extend up to the size of square regions (55 ), synchronous spike pairs were less redundant, bits for cells spaced by less than 200 (Fig. 2B, n=567 pairs). Together these results suggest that the degree of redundancy for synchronous spike pairs is largely determined by the properties of the stimulus.
The simple correlation structure of artificial movies also allows us to relate neural events to the visual stimulus dRvS+Bialek_88 . Using spatially uniform flicker, we typically found that the symbol-triggered average stimulus (STA) for symbols was intermediate between the STAs of its component spikes. However, the stimuli preceding a synchronous spike pair clustered more tightly around the STA than for single spikes. Figure 2D shows that the variance along the direction in stimulus space defined by the STA was consistently smaller for symbols than for single spikes (see Methods). These results indicate that the extra information conveyed by symbols compared to single spikes is due, in part, to increased certainty that the stimulus is similar to the STA.
The fact that most of the symbols were less informative than their sum needs to be put in context: how much information can a synchronous spike pair possibly convey? Intuitively, if two neurons each are very precisely locked to the stimulus, then there is little scope for synchronous spikes to say anything different from that said by the single neurons. We explored the potential for synergy between two neurons by using an iterative algorithm for finding the most informative synchronous spike train given the firing rate of each individual neuron (see Methods). Fig. 2C compares the potential synergy for symbols with their actual value. Under naturalistic stimulation, cell pairs had considerable room for synergy but instead were mostly redundant (green). Under spatially uniform flicker, we could not always find a possible combination of spikes into synchronous pairs that was synergistic (blue), but all synchronous spike pairs we significantly more redundant than they could have been.
Spiking and Silence
In a combinatorial code, the combination of spiking in some neurons and silence (non-spiking) in other neurons can also be an important event. Silence alone is not highly informative: the information content of the symbol 0 is 0.011 0.015 bits for 20 ms of silence and 0.074 0.079 bits for 100 ms of silence (natural movies, salamander, n=204 cells). However, the symbol , where cell A fires a spike and cell B does not spike within 50 ms of cell A s spike, often was found to be synergistic both for natural and for artificial movies (Fig. 3A). Importantly, for every ganglion cell, there is another cell whose silence adds synergistically to the spiking cell (Fig. 3A). Synergy from silence tended to increase when the temporal window used to define silence increased; we chose 50 ms because this corresponds to the typical duration of ISPSs Pouille+Scanziani_04 ; Gibson+al_99 , consistent with a likely mechanism for detecting combinations of spiking and silence (see below, Fig. 6).
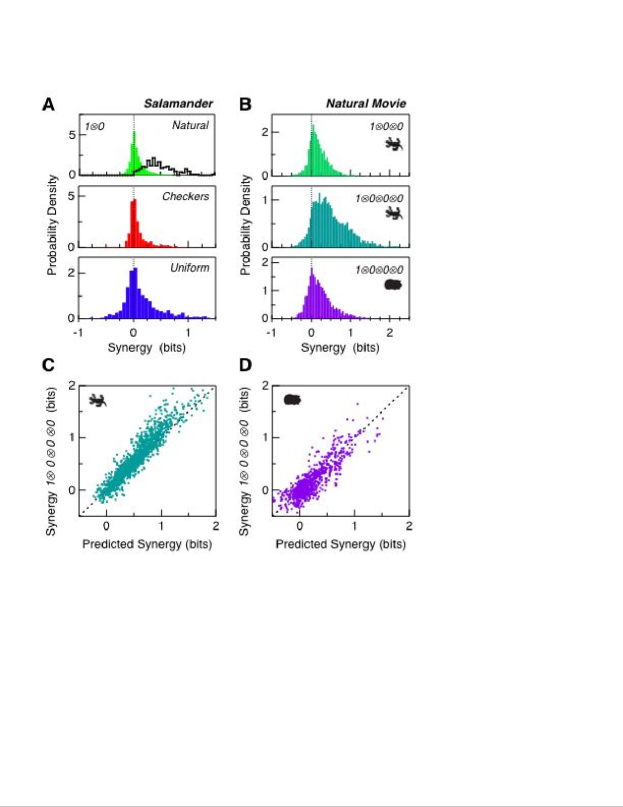
Synergy from silence becomes even more apparent for firing patterns with one spiking cell and several silent cells: for natural movies, symbols were more synergistic than , and symbols were even more so, with synergy exceeding 2 bits in some cases (Fig 3B). Here, synergy from silence is a generalization of Eqn. 2: for instance, . The synergy for symbols was 0.50 0.46 bits (n=6438 quadruplets) for salamander and 0.23 0.33 bits (n=2455 quadruplets) for guinea pig. The synergistic contribution from the silence of 3 neurons is roughly equal to the sum of the synergies from the silence of each neuron combined pairwise with the spiking neuron (Figs. 3C,D).
To understand why the combination of spiking and silence can be synergistic, it is instructive to look at examples of such coding symbols under random flicker stimulation. Synergy results when the requirement of silence from the second neuron (cell B) effectively vetoes a subset of the firing events produced by the spiking cell (cell A), while leaving other events essentially unchanged (Fig. 4A). Because this vetoing operation is stimulus specific, the STA of the symbol is qualitatively different from the STA of cell A alone (Fig. 4B). In fact, the visual message represented by a symbol was often different from any of the STAs of individual neurons (Fig. 4B). Thus, many distinct visual messages are represented by combinations of spiking and silence in the population of retinal ganglion cells.
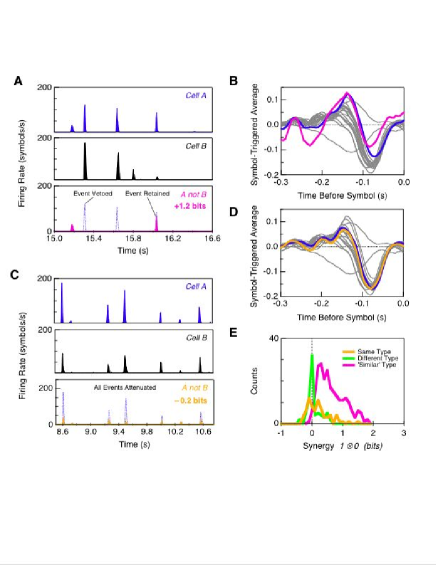
Synergy from silence depends critically on the identity of the two neurons: if they are functionally very similar, then the requirement of silence from cell B indiscriminately attenuates all of the firing events produced by cell A (Fig. 4C). Now, the symbol encodes the same visual message as the single spike (Fig. 4D), but this compound symbol has many fewer events than either individual spike. In fact, this combination can even result in a loss of information relative to that conveyed by a single spike (Fig. 4C). Information loss occurs when the difference between the most sharply-locked firing events and the typical events decreases, as can be seen in Fig. 4C. These results demonstrate that synergy from silence is not a generic consequence of the decreased event rate for symbols relative to single spikes, but instead depends on the detailed pattern of firing exhibited by the compound symbol.
The lack of synergy from silence for functionally similar neurons was found to be systematic: the values of for cells of the same functional subtype (see Methods) were found to be scattered close to zero (Fig. 4E, orange). Interestingly, the symbol-triggered stimulus variance for symbols formed from cells of the same functional type was slightly but significantly greater than the stimulus variance for single spikes: variance ratio = 1.06 0.018 (S.E.M., n=71 pairs). This result is the opposite of what was found for synchronous spike and indicates the information loss here results, in part, from decreased certainty that the stimulus is similar to the STA. We found also that symbols formed from cells with very different function, such as pairs of ON and OFF cells, were not synergistic (Fig. 4E, green). This is expected, because such cells have no signal correlation and no noise correlation Puchalla+al_05 ; Segev+al_06 . Instead, symbols formed from similar but different neurons same broad functional type (e.g., fast OFF) but different subtype Schneidman+al_03a usually were synergistic under spatially uniform stimulation (Fig. 4E, pink).
Model of a Combinatorial Code
To better understand the origin of combinatorial coding, we constructed a simple model of retinal processing. We assumed that ganglion cell light responses were described by what is called the LN model, where the visual stimulus is first filtered by the classical receptive field and then passed through a sigmoidal threshold function that truncates negative values to produce a time-varying firing rate (see Methods). Multiple ganglion cells had different receptive fields and were assumed to be correlated only through their receptive field overlap (also known as conditional independence or lack of noise correlation).
For this model of ganglion cell light responses, the classical receptive field can be thought of as a vector in the high dimensional space of all possible visual stimuli (Fig. 5A). The firing rate of each neuron depends only on the overlap between the stimulus and its receptive field, which can be described by an angle between the stimulus and the neuron s preferred direction in stimulus space (Fig. 5B). This overlap angle summarizes both the spatial and temporal integration of the classical receptive field. We choose the simple case of a uniform distribution of overlap angles for the population of ganglion cells, allowing us to calculate the information that single cells, pairs and triplets convey about the visual stimulus.
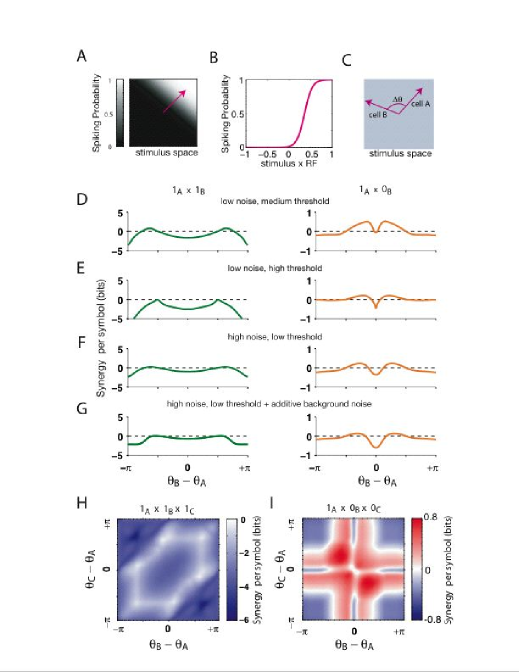
Similar to our experimental results, we found that symbols tend to be either redundant or nearly independent (Fig. 5D, left). On the other hand, symbols had many synergistic combinations and some weakly redundant ones (Fig. 5D, right). This results closely resembles the pattern of synergy from silence for different cell types: cells with nearly identical function were weakly redundant, ON/OFF pairs (large ) were independent, and cells that were similar but different (intermediate ) almost all exhibited synergy from silence. Changing the neurons selectivity or noise level (see Methods) gave qualitatively similar results (Fig. 5E-G). For triplets, we found that synchronized spiking was always redundant, whereas patterns demonstrated strong synergistic combinations and some weakly redundant ones (Fig. 5H,I) in striking resemblance to the results for real ganglion cells. We emphasize that this model does not include stimulus dependent correlations between cells (also called noise correlations ), showing that the combinatorial coding can result from stimulus-induced correlations alone.
Discussion
A combinatorial retinal code that relies on synergy from silence has great flexibility. Because most ganglion cells respond sparsely to natural stimuli, synchronous spike pairs are relatively rare (Fig. 1C,D), but combinations of spiking and silence are quite common. Because the receptive fields of ganglion cells overlap extensively covering visual space 60 times over Segev+al_04 a single neuron can form combinatorial firing patterns with many nearby ganglion cells. How can the brain select interesting population symbols to recognize? Since almost all symbols are synergistic, such symbols could simply be chosen at random. However, if combinations of spiking and silence from ganglion cells of the same functional type were avoided, the brain could significantly enhance the chance that remaining combinations were highly synergistic. Generic learning rules, such as spike-timing dependent plasticity, may also allow the brain to focus in further on the most informative retinal firing patterns.
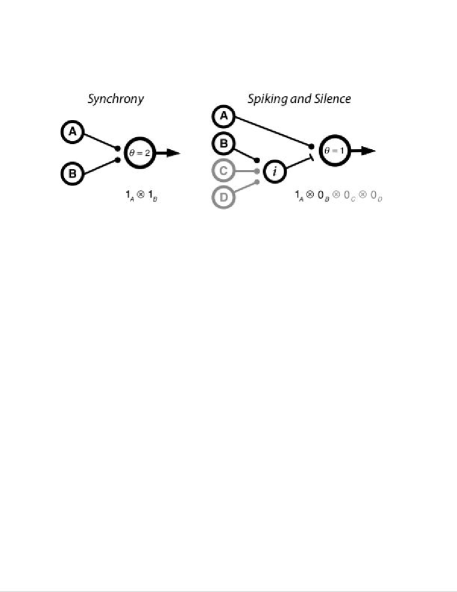
How might the central brain recognize combinations of spiking and silence? We propose that they are detected by a simple circuit involving feedforward inhibition along with monosynaptic excitation (Fig. 6). Networks of inhibitory interneurons clearly allow cortical circuits to synchronize and oscillate Beierlein+al_00 ; Traub+al_98 , but interneurons possess extreme functional diversity Gupta+al_00 ; Parra+al_98 suggesting more detailed roles in information processing than currently appreciated Beierlein+al_03 ; Miles_00 . In particular, many subtypes exhibit very fast and reliable transmission with relatively little spike frequency adaptation or synaptic depression Gibson+al_99 ; Martina+al_00 . These properties are ideal for vetoing excitation Swadlow_03 ; Gabernet+al_05 , thereby detecting combinations of spiking and silence in the input to a cortical circuit.
The combinatorial code of the retina combines elements of all three hypotheses about population codes, but in ways that are different than previously thought Meister_96 . Redundancy was found in the synchronous events. At the same time, synchronous spikes encoded more information than either constituent spike alone. Some of this additional information resulted from increased certainty about the visual stimulus dRvS+Bialek_88 ; Gabbiani+al_96 a form of averaging over spikes to achieve higher fidelity. Ganglion cells of different broad functional types were found to be largely independent. Synergy was found in combinations of spiking and silence, rather than in synchronous spikes. Why might the retina s population code be structured in this complex fashion? Redundancy can benefit a neural code by increasing the robustness of representation and by tagging patterns of neural activity to be learned Barlow_01 . At the same time, synergistic compound symbols constitute a huge vocabulary of different visual features multiplexed onto optic nerve fibers and represented at the fastest response time of the circuit.
The simple model we presented suggests that combinatorial coding does not require elaborate circuit mechanisms or strong noise correlations, nor is it highly specific to the processing carried out in the retina. This implies that similar results may be found in other neural circuits. Furthermore, average synergy and redundancy have been reported for cortical neurons Petersen+al_01 ; Gat+Tishby_99 ; Narayanan+al_05 , suggesting that these circuits can also signal with synergistic and redundant ensemble firing patterns. Because the same neurons can participate in both synergistic and redundant firing patterns whose contributions largely cancel, even the observation of average independence Gawne+Richmond_93 ; Reich+al_01 does not preclude combinatorial coding. Similar results have been found for spike patterns produced by a single neuron, where spike pairs separated by short time intervals were synergistic but pairs separated by longer time intervals were redundant Brenner+al_00 . As the methods we have used to analyze the retinal code can readily be extended to other neural systems, this approach promises to yield new insights into the nature of population neural codes throughout the brain.
Methods
Electrophysiological Recording. Eyes were dissected from the salamander or guinea pig and cut into pieces that left the retina and pigment epithelium intact. These pieces were placed with the ganglion cells facing a multi-electrode array and were perfused with oxygenated Ringer s at room temperature (salamander) or Ames medium at C (guinea pig). Stable recordings of over 12 hours were achieved under these conditions. Extracellular voltages were recorded by a MultiChannel Systems MEA 60 microelectrode array and streamed to disk for offline analysis. Spike waveforms were sorted using the spike size and shape in a 2.5 ms window. Only well isolated spike waveforms were used: we required that spike trains had fewer than 0.5 of the inter-spike interval less than 2 ms and that fewer than 1 of the spikes were found within 0.2 ms of spikes from other cells. This study is based on measurements of 8210 (902) cell pairs between 369 (61) cells recorded from 5 (4) retinas in the salamander (guinea pig) with multiple movie clips. There were between 9 and 40 cells recorded per movie clip; some of the same cells were recorded during multiple clips.
Visual Stimulation. Natural movie clips were acquired using a Canon Optura Pi video camera at 30 frames per second. Movies were taken of woodland scenes and included several qualitatively different kinds of motion: objects moving in a scene, optic flow, and simulated saccades. Checkerboard flicker consisted of 55 square regions on the retina that were randomly chosen to be either black or white every 33 ms. In spatially uniform flicker, light intensities were chosen randomly every 33 ms from a Gaussian distribution with a standard deviation equal to 18 of the mean. All visual stimuli were displayed on an NEC FP1370 monitor and projected onto the retina using standard optics. The mean light level was at the retina.
Functional classification. Salamander ganglion cells were divided into 3 broad classes using the time course of their spike-triggered average (STA) as well as their responses to diffuse steps of light. Fast OFF cells ( 75 of population) had short latency responses to both the onset and offset of light. Slow OFF cells ( 10 ) had longer latency responses and only responded at the offset of light. ON cells (15) only responded at the onset of light. These definitions correspond to those previously made using random flicker stimulation fast OFF , weak OFF , ON Schnitzer-Meister_03 as well as using flashes ON/OFF , OFF , ON Burkhardt +al_98 . Fast OFF cells were resolved into 6 subtypes using an information theoretic method of functional classification Schneidman+al_03a ; this method is sensitive to the entire response function of a neuron, rather than just its spike-triggered average. Cells of the same subtype had nearly identical STAs; different subtypes had characteristic shifts in their response latency as well as the degree to which their STAs were biphasic versus monophasic.
Information carried by a neural symbol. We first estimated the time-dependent rate at which each neural symbol occurs, , by binning the spike train in time windows and counting the number of spikes in each window across all stimulus trials. We then used Eqn. 1 to estimate the information that symbol conveys about the stimulus with as a free parameter. We extrapolated to the limit , giving a bin-free estimate of the information Brenner+al_00 . To correct for undersampling and bias, a jackknife approach was used, in which we estimated the information in subsets of the data and extrapolated to an infinite number of repeats strong+al_98 . We have omitted information values of symbols when the symbol rate was too low to give a reliable estimate of the information. An alternative approach measures the information conveyed by individual occurrences of an event DeWeese+Meister_99 . Our definition instead measures the average information conveyed by the specific time at which a single event occurs. As discussed in Brenner+al_00 , these two measures are consistent, and Eqn. 1 can be derived in many ways, including as a limit of the information per event defined in DeWeese+Meister_99 . We emphasize that Eqn. 1 is an exact measure of the information carried by the arrival time of a single event and makes no assumptions about the correlations between events. In Fig 2, we defined stimulus certainty by convolving the stimulus with the symbol-triggered average, compiling the distribution of such values whenever the symbol occurred, and calculating the variance of that distribution.
Potential for synergy. We estimated how synergistic the joint spiking symbol could have been, given the firing rates of its constituent cells, and . At every time point, the symbol rate could have been anywhere between the minimal value , where is size of the time bin, and the maximal value . Because information per symbol is higher for larger modulations of the symbol rate, the maximum information will be obtained if at each time the rate takes either its maximal or minimal value; different mean symbol rates can be obtained by distributing different time points between their maximal and minimal symbol rates. We start from and add to the rate of one of the time bins (where is number of repeated presentation of the stimulus), which corresponds to adding one synchronous spike pair during all stimulus trials. We choose the time bin such that this addition results in the largest increase in information that would be carried by the symbol. Then, we seek pairs of bins for which raising the rate in one bin and reducing the rate in the other bin by the same amount (i.e. keeping constant) would further increase the information. We stop when no such pair is found, thus achieving a locally optimal solution for distributing synchronous spike pairs across time to achieve the maximal possible information. We repeat this procedure for each possible value of (in steps of ) and find the largest information over all the possible values of . The potential for synergy in the symbol is given by the difference between this maximum possible information for the symbol and each cell s individual information. We note that our greedy algorithm gives a lower bound on the synergy that the two cell s firing rates could achieve.
Model of ganglion cell light responses. Each ganglion cell has a receptive field given by a unit vector in the space of all visual stimuli. This preferred direction has an overlap with all stimuli defined by the angle . The spiking probability of each cell in response to a stimulus, , is given by a sigmoidal function , where is a bias term, controlling the threshold of the neuron, and is the slope of the sigmoid, controlling how deterministic the cell s response is (the firing probability will be either zero or one with a very sharp threshold). We added more noise in the form of a background firing rate, implemented by adding to the spiking probability (and truncating to the range ). To estimate the synergy or redundancy of pairs and triplets of cells, we averaged responses over a uniformly distributed stimulus ensemble (randomly sampled with 50,000 stimuli) and a set of 100 neurons with preferred directions in stimulus space ranging from 0 to in equal jumps. The joint spiking probability of cells A and B is equal to . The information per symbol values and synergy values were calculated as for the retinal ganglion cells.
Acknowledgements.
We thank Markus Meister and Adrienne Fairhall for critical discussions of the manuscript, and Nadiya Tkachuk for her help with the guinea pig retina experiments. This work was supported a grant from the National Eye Institute (EY-014196) and a Pew Scholarship (M.J.B.). Correspondence and requests for materials should be addressed to ES or MJB: {elads,berry}@princeton.edu.References
- (1) Perkel, D. H., Gerstein, G. L. & Moore G. P. Neuronal spike trains and stochastic point processes. II. Simultaneous spike trains. Biophys J 7, 419–440 (1967).
- (2) Meister, M., Lagnado, L. & Baylor, D. A. Concerted signaling by retinal ganglion cells. Science 270, 1207–1210 (1995).
- (3) Vaadia, E., Haalman, I., Abeles, M., Bergman, H., Prut, Y., Slovin, H. & Aertsen, A. Dynamics of neuronal interactions in monkey cortex in relation to behavioural events. Nature 373, 515–518 (1995).
- (4) Abbott, L. F. & Dayan, P. The effect of correlated variability on the accuracy of a population code. Neural Comput 11, 91–101 (1999).
- (5) Zohary, E., Shadlen, M. N. & Newsome, W. T. Correlated neuronal discharge rate and its implications for psychophysical performance. Nature 370, 140–143 (1994).
- (6) Dan, Y., Alonso, J. M., Usrey, W. M. & Reid, R. C. Coding of visual information by precisely correlated spikes in the lateral geniculate nucleus. Nat Neurosci. 1, 501–507 (1998).
- (7) Shamir, M. & Sompolinsky, H. Nonlinear population codes. Neural Comput 16, 1105–1136 (2004).
- (8) Nirenberg, S., Carcieri, S.M., Jacobs, A.L. & Latham, P.E. Retinal ganglion cells act largely as independent encoders. Nature, 411, 698–701 (2001).
- (9) Schneidman, E,. Bialek, W. & Berry, 2nd, M.J. Synergy, redundancy, and independence in population codes. J. Neurosci., 23, 11539–53 (2003).
- (10) Puchalla, J. L., Schneidman, E., Harris, R. A. & Berry II, M. J. Redundancy in the population code of the retina. Neuron 46, 492–504 (2005).
- (11) Shadlen, M.N.& Newsome, W.T. Noise, neural codes and cortical organization. Curr. Opin. Neurobiol., 4, 569–79 (1994).
- (12) Barlow, H.B., Possible principles underlying the transformation of sensory messages, in Sensory Communication, Rosenblith, W.A., Ed., 217–234 (1961), MIT Press: Cambridge, MA.
- (13) Atick, J.J., Could information theory provide an ecological theory of sensory processing? Network, 3, 213–251 (1992).
- (14) Bell, A.J. & Sejnowski, T.J. The ”independent components” of natural scenes are edge filters. Vision Res.,37, 3327–38 (1997).
- (15) van Hateren, J.H. & van der Schaaf, A. Independent component filters of natural images compared with simple cells in primary visual cortex. Proc. R. Soc. Lond .B Biol. Sci., 265, 359–66 (1998).
- (16) Meister, M., Multineuronal codes in retinal signaling. Proc. Natl. Acad. Sci. USA, 93, 609–14 (1996).
- (17) Gawne, T.J. & Richmond, B.J. How independent are the messages carried by adjacent inferior temporal cortical neurons? J. Neurosci., 13, 2758–71 (1993).
- (18) Reich, D.S., Mechler,F. & Victor, J.D. Independent and redundant information in nearby cortical neurons. Science, 294, 2566–8 (2001).
- (19) Petersen, R.S., Panzeri, S. & Diamond, M.E. Population coding of stimulus location in rat somatosensory cortex. Neuron, 32, 503–14 (2001).
- (20) Gat, I. & Tishby, N. Synergy and redundancy among brain cells of behaving monkeys, in Advances in Neural Information Processing Systems 11 , Kearns, M. & Solla S. Eds., 465–471 (1999), MIT Press: Cambridge, MA.
- (21) Chechik, G., et al. Group redundancy measures reveal redundancy reduction along the auditory pathway. in Advances in Neural Information Processing Systems 14. (2002): MIT Press, Cambridge, MA.
- (22) Narayanan, N.S., Kimchi, E.Y. & Laubach, M. Redundancy and synergy of neuronal ensembles in motor cortex. J. Neurosci., 25, 4207–16 (2005).
- (23) Abeles, M. Corticonics: Neural Circuits of the Cerebral Cortex (1991). Cambridge University Press.
- (24) Riehle, A., Grun, S., Diesmann, M. & Aertsen, A. Spike synchronization and rate modulation differentially involved in motor cortical function. Science 278, 1950–1953 (1997).
- (25) Hatsopoulos, N., Ojakangas, C., Paninski, L. & Donoghue, J. Information about movement direction obtained from synchronous activity of motor cortical neurons. Proc Nat’l Acad Sci (USA) 95, 15706–15711 (1998).
- (26) Schnitzer, M. J. & Meister, M. Multineuronal firing patterns in the signal from eye to brain. Neuron 37, 499–511 (2003).
- (27) Brenner, N., Strong, S.P., Koberle, R., Bialek, W. & de Ruyter van Steveninck, R.R. Synergy in a neural code. Neural Comput., 12, 1531–52 (2000).
- (28) Pouille, F. & Scanziani, M. Routing of spike series by dynamic circuits in the hippocampus. Nature, 429, 717–23 (2004).
- (29) Rieke, F., Warland, D., de Ruyter van Steveninck, R. & Bialek, W. Spikes: Exploring the Neural Code (MIT Press, Cambridge, 1997).
- (30) de Ruyter van Steveninck, R. & Bialek, W. Real-Time Performance of a Movement-Snesitive Neuron in the Blowfly Visual System: Coding and Information Transfer in Short Spike Sequences. Proc. Royal Soc. Lond. B., 234, 379–414 (1988).
- (31) Gibson, J.R., Beierlein, M., & Connors, B.W. Two networks of electrically coupled inhibitory neurons in neocortex. Nature, 402, 75–9 (1999).
- (32) Segev, R., Puchalla, J. & Berry, 2nd, M.J. Functional organization of ganglion cells in the salamander retina. J. Neurophysiol., 95, 2277–92 (2006).
- (33) Schneidman, E,. Bialek, W. & Berry, 2nd, M.J. An Information Theoretic Approach to the Functional Classification of Neurons. in Advances in Neural Information Processing Systems 15, MIT Press, Cambridge, MA, 2002.
- (34) Segev, R., Goodhouse, J., Puchalla, j. & Berry II, M.J. Recording from all of the ganglion cells in a patch of the retina. Nat. Neurosci., 7, 1154–1161 (2004).
- (35) Beierlein, M., Gibson, J.R. & Connors, B.W. A network of electrically coupled interneurons drives synchronized inhibition in neocortex. Nat. Neurosci., 3, 904–10 (2000).
- (36) Traub, R.D., et al., Gamma-frequency oscillations: a neuronal population phenomenon, regulated by synaptic and intrinsic cellular processes, and inducing synaptic plasticity. Prog. Neurobiol., 55, 563–75 (1998).
- (37) Gupta, A., Wang, Y., & Markram, H. Organizing principles for a diversity of GABAergic interneurons and synapses in the neocortex. Science,. 287, 273–8 (2000).
- (38) Parra, P., Gulyas, A.I. & Miles, R. How many subtypes of inhibitory cells in the hippocampus? Neuron, 20, 983–93 (1998).
- (39) Beierlein, M., Gibson, J.R. & Connors, B.W. Two dynamically distinct inhibitory networks in layer 4 of the neocortex. J. Neurophysiol., 90, 2987–3000 (2003).
- (40) Miles, R. Perspectives: Neurobiology. Diversity in inhibition. Science, 287, 244–6 (2000).
- (41) Martina, M., Vida, I. & Jonas, P. Distal initiation and active propagation of action potentials in interneuron dendrites. Science, 287, 295–300 (2000).
- (42) Swadlow, H.A. Fast-spike interneurons and feedforward inhibition in awake sensory neocortex. Cereb. Cortex, 13, 25–32 (2003).
- (43) Gabernet, L., et al. Somatosensory integration controlled by dynamic thalamocortical feed-forward inhibition. Neuron, 48, 315–27 (2005).
- (44) Gabbiani, F., et al. From stimulus encoding to feature extraction in weakly electric fish. Nature, 384, 564–7 (1996).
- (45) Barlow, H.B. Redundancy reduction revisited. Network, 12, 241–53 (2001).
- (46) Burkhardt, D.A., Fahey, P.K. & Sikora, M. Responses of ganglion cells to contrast steps in the light-adapted retina of the tiger salamander. Vis. Neurosci., 15, 219–29 (1998).
- (47) Strong, S. P., Koberle, R., de Ruyter van Steveninck, R. R. & Bialek, W. Entropy and information in neural spike trains, Phys Rev Lett 80, 197–200 (1998).
- (48) DeWeese, M.R. & Meister, M. How to measure the information gained from one symbol. Network, 10, 325–40 (1999).