Impact of observational incompleteness
on the structural properties
of protein interaction networks
Abstract
The observed structure of protein interaction networks is corrupted by many false positive/negative links. This observational incompleteness is abstracted as random link removal and a specific, experimentally motivated (spoke) link rearrangement. Their impact on the structural properties of gene-duplication-and-mutation network models is studied. For the degree distribution a curve collapse is found, showing no sensitive dependence on the link removal/rearrangement strengths and disallowing a quantitative extraction of model parameters. The spoke link rearrangement process moves other structural observables, like degree correlations, cluster coefficient and motif frequencies, closer to their counterparts extracted from the yeast data. This underlines the importance to take a precise modeling of the observational incompleteness into account when network structure models are to be quantitatively compared to data.
keywords:
complex networks , protein-protein-interaction networks , network structure , noisePACS:
89.75.Fb , 89.75.Hc , 87.15.Kg , 05.40.Ca1 Introduction
Recent advances in the identification of protein interactions [1, 2, 3] have greatly extended their number in actual datasets [4, 5, 6, 7]. The accumulated knowledge about these complex mutual interactions of single proteins is represented in protein interaction networks where proteins are represented by nodes and interactions by links between respective nodes. Investigations on the topological structure of the network graphs contribute significantly to the understanding of the organizational principles and evolutionary strategies behind such complex interaction networks.
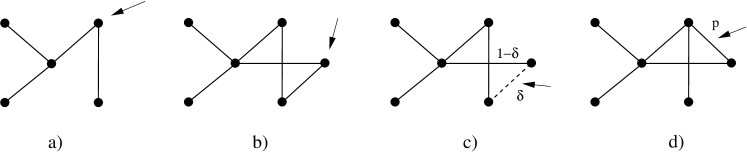
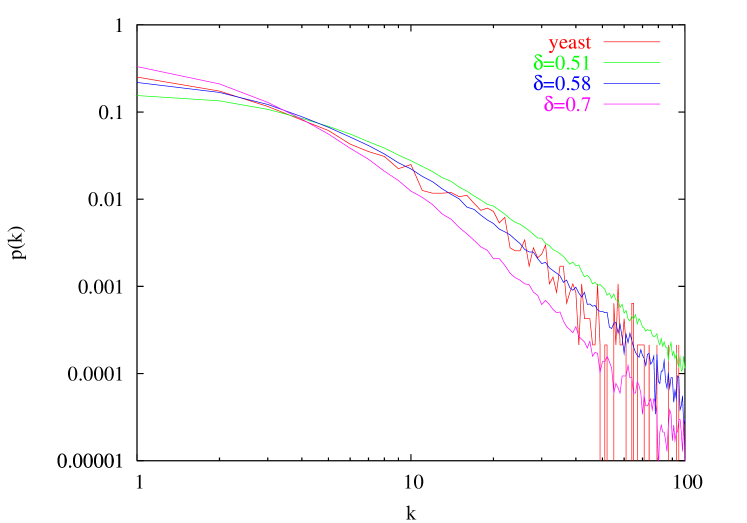
Several models have been proposed for the modeling of the structural evolution of protein interaction networks [8, 9, 10, 11, 12]. All of them are based on the idea of gene duplication and mutation to be the responsible mechanism for the evolution from a small number of proteins up to several thousands known today. This mechanism, where links of highly connected nodes are more likely to be duplicated, is a biological representation of network growth with preferential attachment [13]. The model described in [12] fits best to observed properties of real yeast interaction networks, extracted for example from the DIP database [4]. During one evolutionary step of this model (see Fig. 1) a randomly selected node is copied with all its links. With probability each of the copied links is then subject to removal, and with probability a new (homodimer) link is established between original and copied node. If after the probabilistic link removals and addition the copied node is left without any link, it is deleted. Fig. 2 illustrates the dependence of the degree distribution on the model parameter . As for the giant component of real yeast data [4], the number of nodes has been set to . The parameter has been estimated according to the number of homodimers in real yeast datasets. It has no significant influence on the degree distribution. For the degree distribution matches its data counterpart. Other network properties, like degree correlation, cluster coefficient and selected motifs, also agree with data to some extend (see Fig. 4).
Although the simple gene-duplication-and-mutation mechanism disregards any selection process and does not take further regulatory mechanisms into account, it gives us a principle understanding of how evolution went to work. However, caution should be taken when it comes to a biological interpretation of the fitted model parameter values. One has to take into account that the actual data of protein interactions contains a large number of false links. In Refs. [14, 15, 16] different methods are applied to provide an estimate about the amount of links which are set in the real yeast datasets but do not exist (false positives), and those which exist but are not contained in the dataset (false negatives). Mostly by comparing high confidential with high throughput datasets, current estimates are that the total number of interactions is up to 30,000 compared to about 15,000 known today [14, 16] and that within these 15,000 interactions 50% of the links are wrongly assigned [15, 16].
Given this amount of observational incompleteness, two driving questions emerge: can we compare a model like [12] ”as is” with data, and how relevant are fitted model parameters? The aim of this Paper is to analyze how much and in what directions various forms of observational incompleteness modify extracted structural properties of protein interaction networks, like degree distribution, degree correlations, cluster coefficient and motifs.
In abstracted form, the observational incompleteness leading to the occurrence of false negative / positive links can be modeled as link removal / rearrangement applied to an initial “true” network. The simplest variant is completely random removal / rearrangement of links. Its effect on scale-free networks has already been discussed [17]. Another form of link removal is subnetwork sampling, like snowball sampling [18, 19], truncated random walk sampling or traceroute exploration [20].
Throughout this Paper we will make use of the network model of Ref. [12]. It serves to synthetically generate “true” protein interaction networks. Sect. 2 discusses completely random deletion of links. Sect. 3 introduces a very specific random link rearrangement, which is directly motivated from the experimentally applied complex purification methods [1, 2]. A conclusion and an outlook is given in Sect. 4.
2 Random link removal
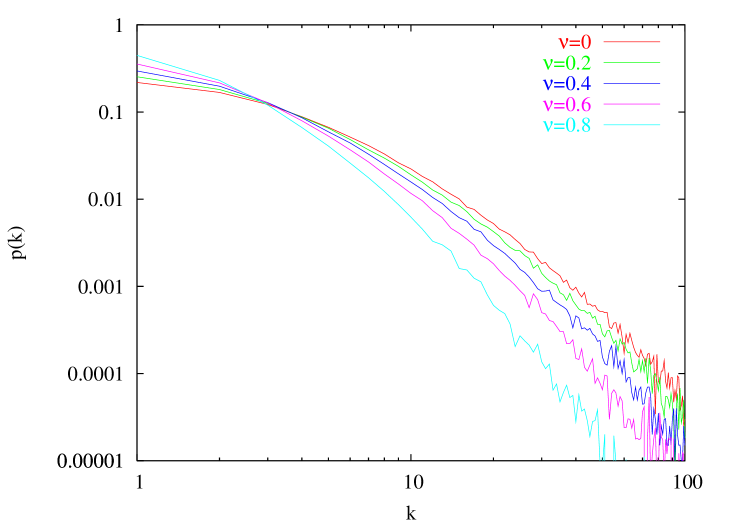
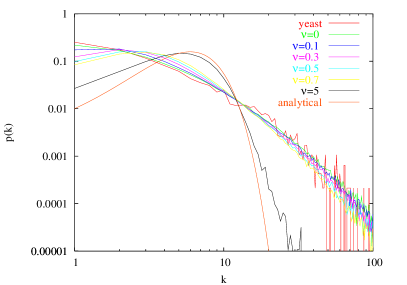
Random link removal represents the simplest modeling to introduce false negative links. A network with nodes and links is considered to be the initial “true” network. One after the other a link is selected randomly and then removed from the network. The removal strength counts the relative number of deleted, i.e. false negative links. The impact of this random link removal on the degree distribution of the gene-duplication-and-mutation network of Ref. [12] is shown in Fig. 3a. With increasing removal strength the resulting degree distribution deviates more and more from its initial counterpart.
Admittedly, the degree distributions of Fig. 3a with and resemble those of Fig. 2 with and . In fact, the shown degree distributions with , , , match those resulting from , , , , respectively. By looking at the degree distribution only, a network with specific , but subject to random link removal, appears like a network corresponding to a larger .
Note however, that this comparison is not mature. With the size of the giant network component, from which all degree distributions of Fig. 3a have been sampled, is reduced. For and , , , it results in , , , , respectively. By model construction the initial size is independent of the parameter . Consequently, the number of nodes contained in the giant component does not agree between the link-removed model network and the reparametrized initial model network, although their degree distributions match.
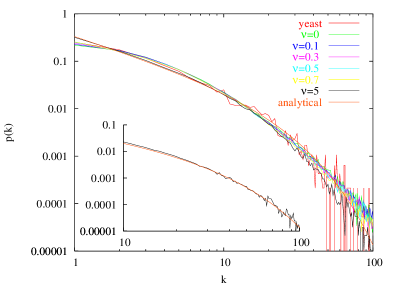
For a proper comparison the model network reduced by random link removal should end up with the same average degree and the same size for the giant component as the reparametrized initial network model. For reference, we choose and as observed in the yeast data [4]. This requires the model network to have initially more nodes and links before random link removal sets in. Initial numbers of nodes and links are not independent of each other and require a careful tuning, so that after random link removal a precision landing is made at the targeted and . For example, for removal strengths , , the rescaled parameters are , , . The remaining parameter has been kept fixed. Note, that even larger removal strengths are not feasible for the chosen network model. It would require . In this regime the model is not self-averaging any longer [11].
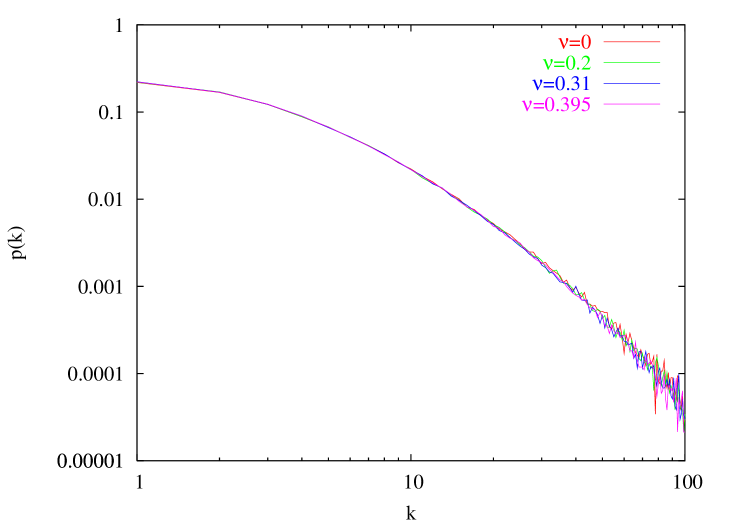
Fig. 3b illustrates the degree distributions obtained after random link removal has been applied to the parameter-rescaled model realizations. All distributions corresponding to different removal strengths collapse to one single curve. This curve collapse is somewhat surprising, because by construction only the size of the resulting giant network component and the resulting average degree have been set the same. Each curve results from the interplay of two effects: initially, i.e. before random link removal sets in, a smaller leads to a flatter degree distribution (see again Fig. 2), which is then, once random link removal sets in, turned into a steeper distribution (see again Fig. 3a).
If the resulting degree distributions had all been Poissonians, then the curve collapse would have been straightforward to understand. The rate equation for random link removal [17]
| (1) |
is solved by with . A Poissonian degree distribution remains Poissonian, although with rescaled parameter . Hence, a Poissonian network constructed with can also be obtained by first constructing a denser Poissonian network with , which is then subject to random link removal of strength .
Also for scale-free distributions the curve collapse can be constructed with a rescaling of model parameters. In case of a growth process with preferential attachment , the model parameters are the number of open links, with which a new node enters the network, and the attractiveness [21]. They determine the scale-free exponent . Now, Ref. [17] has shown that during the preferential-detachment-like random link removal, where the initial average degree is reduced, the scale-free exponent is conserved in the large- regime. This implies that after random link removal with strength the resulting network appears like one which has been grown with rescaled model parameters and .
Although the small excursions to Poissonian and scale-free networks have shed some light on the nature of the curve collapse, its appearance in connection with gene-duplication-and-mutation networks remains without a deeper explanation. Nevertheless, from a pragmatic point of view we can say the following: if we consider a gene-duplication-and-mutation network as the “true” network and introduce false negatives in the form of random link removal, then the resulting degree distribution appears like one obtained from the same gene-duplication-and-mutation process, but with different parameters. It would be inappropriate to give a biological interpretation to the magnitude of the extracted parameters.
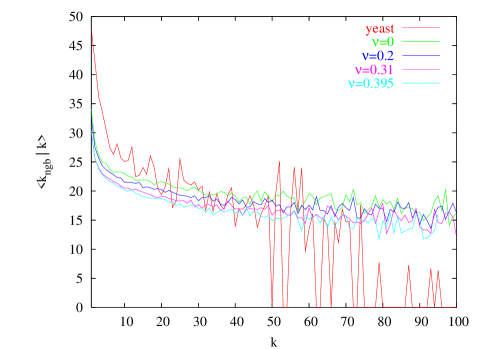
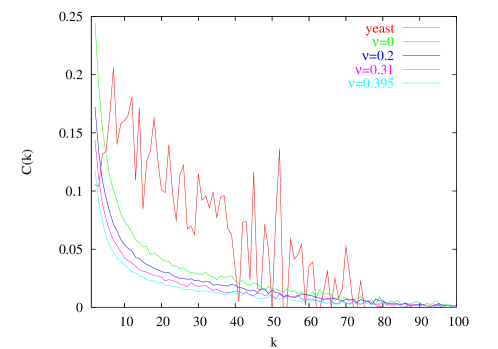
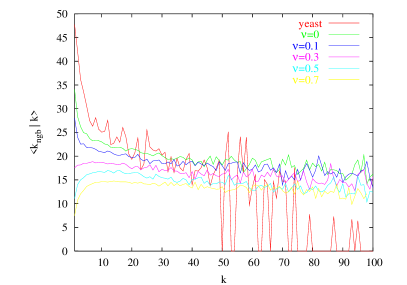
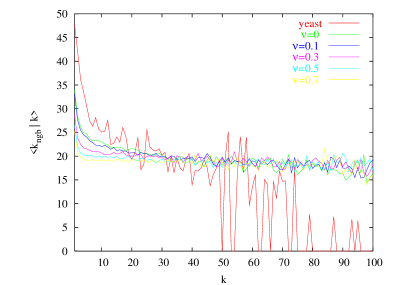
The curve collapse motivates to look at observables beyond degree distribution. The average degree for neighbors of a node with degree represents a measure for degree correlations. Fig. 4a illustrates its dependence on the removal strength. The same procedure with rescaled model parameters as for Fig. 3b has been applied. With increasing the degree correlations are reduced to some minor extend. They stay close to the model correlations. The comparison with the correlations observed in the yeast data makes clear that all curves corresponding to different more or less match with the same quality.
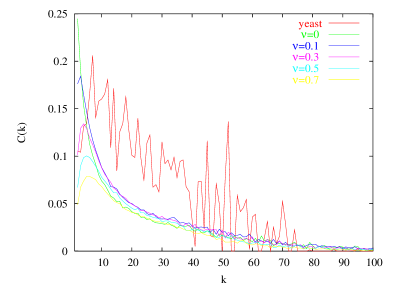
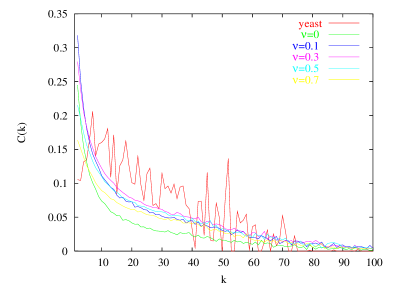
A similar finding is obtained for the degree-dependent cluster coefficient . It represents the fraction of triangles formed by a node with degree and its neighbors out of the maximum possible number . Fig. 4b shows its dependence on the removal strength. decreases with increasing , but remains within the same order of magnitude as for . Compared to the yeast data, all curves are too low and no one of them is really to be favored over the other ones.
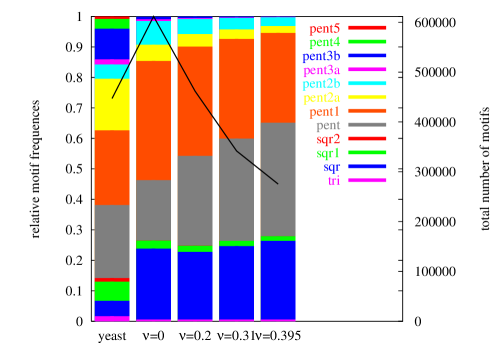
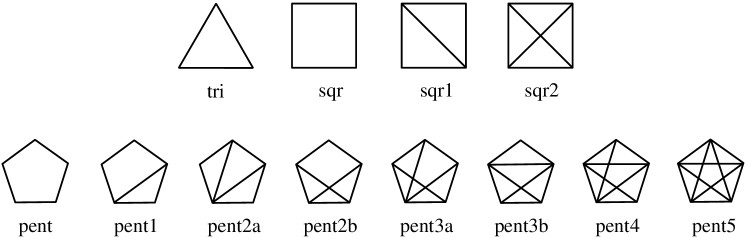
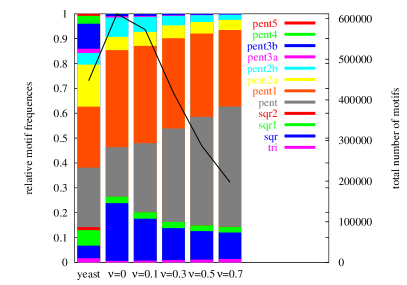
A corresponding conclusion can also be drawn from an analysis based on motif structures. A variety of motif systematics has been discussed in the literature [22, 23, 24, 25]. Our selected set is depicted in Fig. 5. It is restricted to triangles, squares and pentagons with different intra-link structure. The loops within these motifs represent potential regulatory mechanisms. The total number of all selected motifs as well as their relative frequencies have been determined in dependence on the random link removal strength. Fig. 4c reveals that the total number decreases with . At it matches its yeast data counterpart. Within the model the three dominant contributions come from the motifs ”sqr”, ”pent” and ”pent1”. The relative frequency of ”sqr” basically remains independent of , but noticeably overestimates the frequency extracted from the yeast data set. With increasing removal strength the relative frequency of ”pent” increases slightly, whereas that of ”pent1” decreases to some small extend. Both more or less agree with their yeast data counterparts. Except for ”pent2b”, no agreement is reached for the relative frequencies of all ”pent” motifs with more than one intra link. The significant model underestimations hold for all link removal strengths.
3 Spoke link rearrangement
So far the modeling of observational incompleteness has only taken subnetwork sampling in the form of random link removal into account. In this way only false negative links have been created. For the modeling of false positive links some kind of link rearrangement or link addition is needed. We will now discuss a very specific random link rearrangement, which is directly motivated from the shortcomings in the generation and interpretation of protein-interaction data.
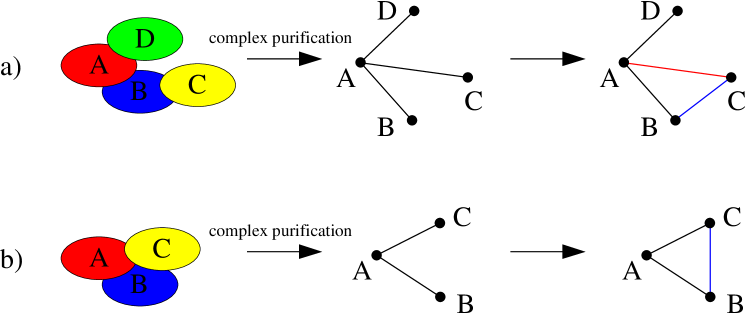
Using the complex purification methods, namely affinity precipitation and affinity chromatography [1, 2], a protein is tagged and placed into the cell lysis. The tagged protein (bait) is then isolated and analyzed with its associated proteins (preys). It is not obvious how to assign links between the bait and preys found in the protein complex. In the commonly used spoke algorithm [26] direct links are defined between the bait and all its preys. This approach is illustrated in Fig. 6. It does not take into account the possibility that the bait is not directly interacting with all preys but via intermediate proteins. This results in false positive and negative links (Fig. 6a). Moreover, possible interactions between the prey proteins themselves are also not taken care of, resulting in even more false negative links (Fig. 6b). Similar effects occur with the yeast-two-hybrid [16] and the synthetic lethality methods [3]. Although the yeast-two-hybrid method characterizes the interaction between two target proteins, no assurance can be given that this interaction is not provided by an intermediate protein. With the synthetic lethality method an interaction is assumed between two functional correlated proteins but even if they are part of the same complex, it is not clear if a direct interaction exists.
To study the influence of this effect on the network topology we propose a local random link rearrangement, which hereafter is called spoke link rearrangement. After selection of an initial (bait) node, one of its first (prey) neighbors is chosen at random. The latter then continues to randomly choose one of its first neighbors, excluding of course the initial node. Two cases then have to be distinguished. If the last node is a second neighbor of the bait node, a new, but then false-positive link between these two nodes is introduced and the old link between the two prey nodes is removed to gain false-negative status; see again Fig. 6a. In the other case, the second prey node turns out to be a first neighbor of the bait node, upon which only the link between the two prey nodes is removed and becomes false-negative; see again Fig. 6b. – Due to the second case, the spoke link rearrangement is not a pure link rearrangement. However, the cluster coefficient is small enough to keep the link removal part small (see Fig. 4b and third row of Fig. 7).
So far the selection of bait nodes in the spoke link rearrangement has not been specified. In the yeast data [4], the bait proteins are of course known and make up approximately a quarter of all listed protein nodes. In general they have a larger degree than the overall average. Their degree distribution is different from the observed overall degree distribution , but can be mapped onto the latter via
| (2) |
with . This indicates that a bait node with degree might be picked from the model network with the preferential bias
| (3) |
Since the observed degree distribution entering (2) is most likely not equal to the unknown true one, we will discuss probabilistic bait selection with and in the following.
The combination of the biased bait selection (3) and the spoke link rearrangement process are applied to the network structure obtained with the gene-duplication-and-mutation model of Ref. [12]. Again, model parameters are taken to match the yeast data, i.e. , and . The rearrangement strength counts the relative number of bait selections implying link rearrangement or removal.
Since link removal is included in the spoke link rearrangement, the average degree decreases with increasing from its initial value . For the already very large rearrangement strength we arrive at the slightly reduced values and for and , respectively. Note also, that the giant component of the network does not change with and remains at its initial value . Both subprocesses of the spoke link rearrangement always keep the three involved nodes connected to the overall network. This observation together with the decreasing average degree would imply, that for a fair comparison between the yeast data and the spoke-link-rearranged model a reparametrization of the model parameter is required to start with an initially denser network. Since the reduction of the average degree remains rather small for modest, data-relevant rearrangement strengths, we abandon to do so.
The first row of Fig. 7 shows the dependence of the degree distribution on the rearrangement strength . For the probability to find low- and high-degree nodes decreases with increasing . Already for small the deviations to the initial degree distribution are noticeable. For very large the degree distribution appears to converge towards a Poissonian. For the outcome is different. For small the deviations to the initial degree distribution are barely noticeable, leading to a curve collapse in good approximation. Even for large the resulting is still close by.
Analytical insight into these findings can be obtained from the following rate equation:
| (4) | |||||
The first two terms on the right-hand side represent the gain and loss term of the selected bait, which increases its degree by one. The third and fourth term describe the first neighbor of the bait, which looses a link. Consult again Fig. 6a. The spoke link removal (see Fig. 6b) has been neglected in (4). Furthermore, also degree correlations have been discarded.
For the case the stationary solution of (4) is
found to be the modified Poissonian
| (5) |
where is required from for all . This confirms the simulational finding of Fig. 7a for very large . – For , represents the non-normalizable stationary solution of the rate equation. However, due to the finiteness of the network a cutoff may be introduced, leading to
| (6) |
With parameters and this solution is also illustrated in Fig. 7b and its inset. It agrees nicely with obtained from the simulations.
The degree correlation in the form is illustrated in the second row of Fig. 7. In case of and especially for very small degrees, the average neighbor degree rapidly decreases with increasing rearrangement strength. Its initial disassortative character is turned into a randomized one, which is reflected in the -independence. The average neighbor degree associated with does show a similar, but weaker dependence on the rearrangement strength.
The third row of Fig. 7 focuses on the degree-dependent cluster coefficient. Not much happens for at modest rearrangement strengths , except for very low degrees, where the cluster coefficient decreases as . This behavior is also observed in the yeast data. In case of the biased bait picking with , the cluster coefficient increases for all as the rearrangement strength increases from to , only then to decrease again for even larger . At the turning point , the found degree-dependent cluster coefficient almost matches its counterpart from the yeast data. – The overall cluster coefficient declines with increasing as for and as for . For very large rearrangement strengths it becomes very small.
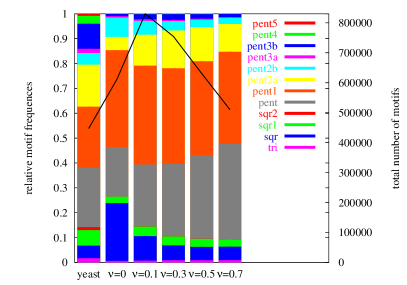
The motifs of Fig. 5 are exemplified in the last row of Fig. 7. For their total number is a strictly decreasing function with . The case shows a different behavior. For to about it is first an increasing function and then becomes a decreasing function beyond this point. Compared to the yeast data, the order of magnitude is right for both -values. The relative frequency of the motif ’sqr’ decreases with . Characteristic trends are also observed for other motifs, but it is difficult to provide a solid explanation for it. Just by looking at the two subfigures, we have the impression that for the combination , the distribution of relative motif frequencies comes closest to the yeast distribution.
We have arrived at a remarkable result: in comparison to the respective yeast-data counterparts, the degree distribution resulting from the parameter combination and of the spoke link rearrangement perfectly matches, the found degree correlation is at least close, the degree-dependent cluster coefficient matches close to perfect and also the distribution of relative motif frequencies comes very close. Compared to the initial model at , the agreement with data has improved.
Without showing, we have also looked at a combined application of spoke link rearrangement and random link removal. Results turn out to be a mere superposition of those obtained independently in this and the previous section.
4 Conclusion
Observed protein interaction networks are known to be corrupted by a large amount of false negative and false positive links. This observational incompleteness impacts the analysis of network structure. We have assumed the emergence of false negative links to be random and have modeled it with a random subnetwork sampling like random link removal. Most of the false positive links arise due to an operationally defined link assignment during measurements. The latter has been abstracted as a specific random (spoke) link rearrangement process. The modeling of both forms of observational incompleteness reveals that the resulting degree distributions either do not depend at all or only weakly on the applied link removal / rearrangement strengths. Based on this curve collapse alone, no judgment can be made on the qualities of the underlying gene-duplication-and-mutation network models and no biological interpretation should be given to respective model parameters, like the mutation rate .
For observables beyond degree distribution, like degree correlation, cluster coefficient and motif frequencies, a dependence on the applied link removal / rearrangement strength is found. Whereas for random link removal this dependence remains small, spoke link rearrangement appears to move these observables closer to their counterparts extracted from the DIP database. This shows the importance to include observational incompleteness into the comparison between network models and data. It should also be included into any systematic identification of statistically significant network measures [25] and will gain more interest, the more rigorous the analysis of relevant data becomes.
References
- [1] A.C. Gavin et.al., Functional organization of the yeast proteome by systematic analysis of protein complexes, Nature 415 (2002) 141–147.
- [2] Y. Ho et.al., Systematic identification of protein complexes in saccharomyces cerevisiae, Nature 415 (2002) 180–183.
- [3] A.H.Y. Tong et.al., Systematic analysis with ordered arrays of yeast deletion mutants, Science 294 (2001) 2364–2368.
- [4] L. Salwinski, C.S. Miller, A.J. Smith, F.K. Pettit, J.U. Bowie, and D. Eisenberg, The database of interacting proteins: 2004 update, NAR 32 (2004) D449–451.
- [5] B.-J. Breitkreutz, C. Stark, and M. Tyers, The grid: The general repository for interaction datasets, Genome Biology 4 (2003) R23.
- [6] C. Alfarano et al., The biomolecular interaction network database and related tools, Nucleic Acids Res. 33 (2005) D418–424.
- [7] A. Zanzoni, L. Montecchi-Palazzi, M. Quondam, G. Ausiello, M. Helmer-Citterich, and G. Cesareni, Mint: a molecular interaction database, FEBS Letters 513 (2002) 135–140.
- [8] R.V. Sole, R. Pastor-Satorras, E.D. Smith, and T. Kepler, A model of large-scale proteome evolution, Adv. Complex Systems 5 (2002) 43–54.
- [9] A. Vazquez, A. Flammini, A. Maritan, and A. Vespignani, Modeling of protein interaction networks, Complexus 1 (2003) 38–44.
- [10] J. Berg, M. Lässig, and A. Wagner, Structure and evolution of protein interaction networks: a statistical model for link dynamics and gene duplications, BMC Evol. Bio. 4 (2004) 51 (12 pages).
- [11] I. Ispolatov, P.L. Krapivsky, and A. Yuryev, Duplication-divergence model of protein interaction network, Phys. Rev. E 71 (2005) 061911 (8 pages).
- [12] I. Ispolatov, P.L. Krapivsky, I. Mazo, and A. Yuryev, Cliques and duplication-divergence network growth, New J. Phys. 7 (2005) 145 (14 pages).
- [13] E. Eisenberg, and E.Y. Levanon, Preferential attachment in the protein network evolution, Phys. Rev. Lett. 91 (2003) 138701 (4 pages).
- [14] J.S. Bader, A. Chaudhuri, J.M. Rothberg, and J. Chant, Gaining confidence in high-throughput protein interaction networks, Nature Biotech. 22 (2004) 78–85.
- [15] C.M. Deane, L. Salwinski, I. Xenarios, and D. Eisenberg, Protein interactions: Two methods for assessment of the reliability of high-throughput observations, Mol. Cell Proteomics 1 (2002) 349–356.
- [16] C. Mering, R. Krause, B. Snel, S. Cornell, S.G. Oliver, S. Fields, and P. Bork, Comparative assessment of large-scale data data sets of protein-protein interactions, Nature 417 (2002) 399–403.
- [17] J. Scholz, M. Dejori, M. Stetter, and M. Greiner, Noisy scale-free networks, Physica A 350 (2005) 622–642.
- [18] M.E.J. Newman, Ego-centered networks and the ripple effect, Soc. Networks 25 (2003) 83–95.
- [19] S.H. Lee, P.-J. Kim, and H. Jeong, Statistical properties of sampled networks, Phys. Rev. E 73 (2006) 016102 (7 pages).
- [20] L. Dall’Asta, I. Alverez-Hamelin, A. Barrat, A. Vázquez, and A. Vespignani, Statistical theory of Internet exploration, Phys. Rev. E 71 (2005) 036135 (9 pages).
- [21] R. Albert, and A.L. Barabási, Statistical mechanics of complex networks, Rev. Mod. Phys. 74 (2002) 47–97.
- [22] R. Milo, S. Shen-Orr, S. Itzkovitz, N. Kashtan, D. Chklovskii, and U. Alon, Network motifs: simple building blocks of complex networks, Science 298 (2002) 824–827.
- [23] A. Vazquez, R. Dobrin, D. Sergi, J.P. Eckmann, Z.N. Oltvai, and A.L. Barabasi, The topological relationship between the large-scale attributes and local interaction patterns of complex networks, PNAS 101 (2004) 17940–17945.
- [24] N. Przulj, D.G. Corneil, and I. Jurisica, Modeling interactome: Scale-free or geometric, Bioinformatics 20 (2004) 3508–3515.
- [25] E. Ziv, R. Koytcheff, M. Middendorf, and C. Wiggins, Systematic identification of statistically significant network measures, Phys. Rev. E 71 (2005) 016110 (8 pages).
- [26] G.D. Bader, and C.W.V. Hogue, Analyzing yeast protein-protein interaction data obtained from different sources. Nature Biotech. 20 (2002) 991–997.