The evaluation of protein folding rate constant is improved by predicting the folding kinetic order with a SVM-based method
Abstract
Protein folding is a problem of large interest since it concerns the mechanism by which the genetic information is translated into proteins with well defined three-dimensional (3D) structures and functions. Recent data on protein folding suggest that several pathologies such as prion and Alzheimer diseases may be due to change in protein stability during folding processes. Recently theoretical models have been developed to predict the protein folding rate considering the relationships of the process with tolopological parameters derived from the native (atomic-solved) protein structures. Previous works classified proteins in two different groups exhibiting either a single-exponential or a multi-exponential folding kinetics. It is well known that these two classes of proteins are related to different protein structural features. The increasing number of available experimental kinetic data allows the application to the problem of a machine learning approach, in order to predict the kinetic order of the folding process starting from the experimental data so far collected. This information can be used to improve the prediction of the folding rate.
In this work first we describe a support vector machine-based
method (SVM-KO) to predict for a given protein the kinetic order
of the folding process. Using this method we can classify correctly
78% of the folding mechanisms over a set of 63 experimental
data. Secondly we focus on the prediction of the logarithm of
the folding rate. This value can be obtained as a linear regression
task with a SVM-based method. In this paper we show that linear
correlation of the predicted with experimental data can improve
when the regression task is computed over two different sets,
instead of one, each of them composed by the proteins with a
correctly predicted two state or multistate kinetic order.
Keywods: folding kinetics, kinetic order, folding rate,
machine learning, support vector machine, contact order.
pacs:
I 1 Introduction
In the last years, many theoretical and experimental studies have focused on the problem of describing the mechanism of protein folding Jackson (1998); Plaxco et al. (1998); Fersht (2000); Gianni et al. (2003); Compiani et al. (2004); Plaxco et al. (2000); Garbuzynskiy et al. (2004). An important result was the development of empirical models that estimate protein folding kinetics and rates. The number of proteins under investigation is rapidly increasing, allowing more data to be collected. Many proteins fold by a simple two-state transition mechanism (TS), lacking observable folding intermediates under any experimental condition. In turn, other proteins are endowed with intermediates during the folding process; their folding process is therefore classified as a multistate one (MS).
Experimental and theoretical work focused particularly on small
two-state folding (TS) proteins. It was demonstrated that the
logarithm of the in-water folding rates of these proteins correlates
with some topological parameter as computed from their 3D structure
or from that of closely related proteins, such as single point
mutants or homologs with high level of sequence identity Jackson (1998); Zhou and Zhou (2002); Ivankov et al. (2003).
Other methods predict protein folding rates starting from the
Einstein diffusion equation Debe and Goddard (1999) or from the secondary structure
of the protein Gong et al. (2003). More recent work demonstrated that the chain
length is one of the main determinants of the folding rate for
proteins with a multistate folding (MS) kinetics Galzitskaya et al. (2003); Ivankov and Finkelstein (2004). As
a general observation, it appears that the logarithm of the folding
rate correlates with structural topological parameters in TS
proteins and with chain length in MS proteins.
In this paper we adopt a different perspective: we use the experimental
data so far collected and, based on these observations, we develop
a method to predict salient aspects of protein folding that can
be directly computed starting from the protein structure.
II 2 Material and Methods
The problem here addressed concerns the kinetics and mechanism of the protein folding: starting from few simple parameters derived from the protein structure, the aim is to predict important features of the folding mechanism. In particular we implement a support vector machine (SVM)-based method trained over a set of 63 proteins known with atomic resolution and whose folding pathway has been experimentally characterized to predict the logarithm of the folding rate and whether the protein folds through intermediate states or not.
II.1 2.1 Database and Tools
Our data set is derived from the supplementary material of Ivankov and Finkelstein (2004). It contains folding data determined for 63 proteins, 38 of which are endowed with a TS folding mechanism. The other 25 proteins have a MS folding mechanism. The set comprises only single-domain proteins having no S-S bonds and/or no covalently bound ligands. When necessary, we generate two different sets (TS1 and MS1) including only those proteins correctly predicted with the corresponding folding mechanisms (TS1 comprises 34 proteins and MS1 15 proteins).
The in-water folding rates (kf) and native structure of these
proteins have been established experimentally. The protein structure
were collected from the Protein Data Bank (www.pdb.org) Berman et al. (2000).
The method proposed here predicts some features of the protein
folding process using a SVM approach. In particular we choose
the LIBSVM tools available online at the web site http://www.csie.ntu.edu.tw/cjlin/libsvmtools/.
The protein secondary structure was calculated with the DSSP
program (http://www.cmbi.kun.nl/gv/dssp/ Kabsch and Sander (1983)).
Sequence clustering was performed by means of the blastclust
program available within the BLAST suite at http://www.ncbi.nlm.nih.gov/
Altschul et al. (1997).
II.2 2.2 Protein structural parameters
In order to investigate the relationships between the folding
rate constant and the protein native conformation we evaluate
four structure-based parameters. The first parameter is the effective
length of the protein chain (Leff) defined as
| (1) |
where L is the chain length, LH is the number of residues in
helical conformation and NH is the number of helices. The others
topological parameters are: the contact order (CO),
| (2) |
the absolute contact order
| (3) |
and the total contact distance
| (4) |
where N is the number of amino acid residues of a protein, Nc is defined as total number of contacts and Lij = |i-j|.
The number of contacts is evaluated considering all the residues that have two heavy atoms within a given value of cut-off radius R and at a given sequence separation (w).
II.3 2.3 The predictor
The method addresses two different tasks: (1) the prediction of the existence of intermediate states in protein folding and (2) the prediction of the logarithm of the folding rate value. The former case is a classification task, discriminating whether for a given protein the folding pathway is or is not endowed with intermediate states; the latter one in turn is a fitting-regression task for estimating the folding rate. To address the two tasks, we developed a method based on support vector machines and relying on the same input for testing different kernel functions. Also, different SVMs explore different protein features. SVMs take two inputs for a given protein: the chain length and, one at a time, the four structured-based parameters described above (Eqn 1-4). We found that the best performing predictor was the one having as input the protein chain length and the contact order, tested by splitting the dataset in five parts and adopting a cross-validation procedure. The methods were then optimized trying different values of cut-off radius (R) and of sequence separation (w).
In the final section of our work we focus our attention on the 49 proteins that are correctly classified as TS and MS proteins. According to the protein kinetic order we split the dataset in two subsets, composed by 34 TS proteins and 15 MS proteins, respectively. We show that when linear regression fitting is performed on the two sets independently, the prediction of the logarithm of the folding rate is largely improved (see below).
II.4 2.4 Scoring the classification performance
All the results obtained with our systems are scored using a cross-validation procedure on the data pertaining to the 63 proteins. The dataset was divided in 5 subsets, putting in the same set proteins with the same PDB code and proteins with related sequences, as obtained by means of the blastclust program, by adopting the default value of length coverage equal to 0.9 and the score coverage threshold equal to 1.75.
The efficiency of the predictor is scored using the statistical
indexes defined in the following. The overall accuracy is:
| (5) |
where p is the total number of correctly predicted folding mechanisms
and N is the total number of proteins.
The Matthews correlation coefficient MC is defined as:
| (6) |
where D is the normalization factor [[p(s)+u(s)] [p(s)+o(s)]
[n(s)+u(s)] [n(s)+o(s)]]1/2, for each class s (TS and MS, for
two-state and multistate folding processes, respectively); p(s)
and n(s) are the total number of correct predictions and correctly
rejected assignments, respectively, and u(s) and o(s) are the
numbers of under and over predictions.
Finally, it is very important to assign a reliability score to
each SVM prediction. Using one SVM output this is obtained by
computing:
| (7) |
II.5 2.5 Scoring the regression performance
The quality of the prediction when evaluating the protein folding
constant rates was assessed by computing the Pearson linear correlation
coefficient r and the associated value of the standard error .
III 3 Results and Discussion
In order to solve the tasks discussed in section 2.3 we developed different support vector machines. Taking advantage of previous studies, each of the SVMs considers two important protein features: (1) sequence length and (2) the four structural parameters described above. The best performing predictor was then optimized testing different values of cut-off radius (R), different sequence separation values (w) and different kernel functions. We found that the best performance was achieved by a SVM endowed with a linear kernel function K(xi,xj)=xiTxj (data not shown).
III.1 3.1 Structural parameter optimization
Previous studies have highlighted in proteins the correlation between folding kinetics and structural parameters as described in section 2.2 Plaxco et al. (2000); Zhou and Zhou (2002); Ivankov et al. (2003); Ivankov and Finkelstein (2004). Table I lists the scoring performance of each method when predicting the logarithm of the folding rate and the folding kinetics.
| Structural Parameter | Leff | CO | ACO | TCD | |
| Prediction of | MC | 0.15 | 0.42 | 0.27 | 0.36 |
| Folding States | Q2 | 57.1 | 73.2 | 65.9 | 69.8 |
| Prediction of | r | 0.45 | 0.64 | 0.45 | 0.63 |
| log(kf) | 1.57 | 1.39 | 1.57 | 1.37 |
III.2 3.2 Optimization of the cut-off radius
The results shown in Table I indicate that the best SVM method has as input the sequence length and the contact order (see column CO). For this method we tested different values of the cut-off radius. In Table II (see next page), the scoring indexes for the two previous tasks are shown as a function of the radius value ranging from 4 to 12 Å.
| Cut-off radius (Å) | 4 | 6 | 9 | 12 | |
|---|---|---|---|---|---|
| Prediction of | MC | 0.42 | 0.31 | 0.48 | 0.40 |
| Folding States | Q2 | 73.2 | 67.1 | 75.6 | 72.0 |
| Prediction of | r | 0.64 | 0.61 | 0.65 | 0.64 |
| log(kf) | 1.39 | 1.44 | 1.35 | 1.38 |
III.3 3.3 Sequence separation optimization
When considering the protein folding mechanism, an important issue is the different contribution of local and non-local interactions. It is well known that local interactions involved in the formation of particular motifs of secondary structure are established between residues with a sequence separation below 4 residues that is approximately the span length of one turn of an á-helix structure. Therefore, by increasing the value of w in the calculation of CO, we should encompass local interactions and include also contacts between residues that may contribute to non-local interactions during the folding process. We address this task by evaluating the contact order as a function of sequence separation; the best performing implementation of SVMs was consequently optimized and the results are shown in Table III.
| Windows Length | 0 | 2 | 4 | 6 | 8 | |
|---|---|---|---|---|---|---|
| Prediction of | MC | 0.48 | 0.50 | 0.46 | 0.53 | 0.42 |
| Folding States | Q2 | 75.6 | 76.1 | 74.6 | 77.7 | 73.1 |
| Prediction of | r | 0.65 | 0.60 | 0.61 | 0.58 | 0.60 |
| log(kf) | 1.35 | 1.52 | 1.29 | 1.45 | 1.41 |
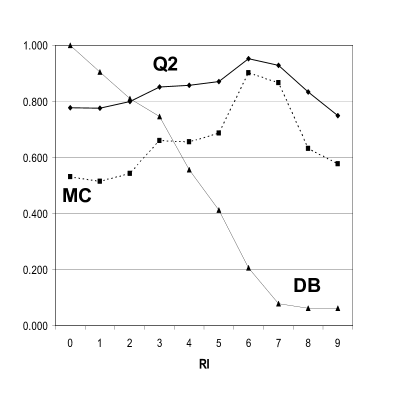
III.4 3.4 Prediction of the folding mechanism.
From our results we conclude that the best method for the binary classification between the two-state and the multistate folding mechanism takes as input the sequence length and the contact order. The best discrimination between TS and MS proteins is obtained when the contact order value is calculated considering a cut-off radius of 9 Å and a sequence separation >6 residues. In figure 1 we report the accuracy (Q2) and the Matthew’s correlation coefficient (MC) as a function of the reliability index (RI).
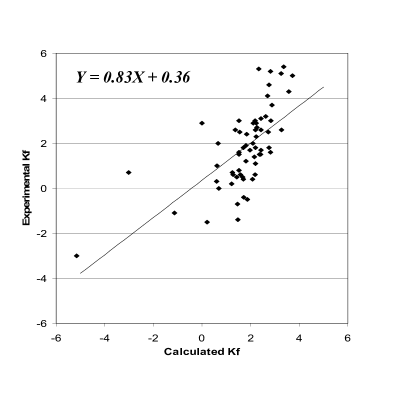
III.5 3.5 Prediction of the logarithm of the folding rate
Similar to the classification task, the regression task for the prediction of the logarithm of the folding rate is optimized considering as input the sequence length and the contact order. The results of our method are shown in figure 2.
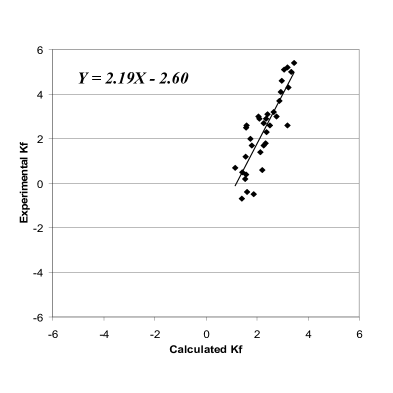
III.6 3.6 Improving the prediction of folding rate
Can we discriminate between two-state and multistate proteins
when predicting the folding rate constant? In other words can
we relate the folding rate constant to the protein structural
features? To address this problem we selected from the dataset
only those proteins for which our predictor correctly evaluates
the kinetic order (49 proteins over 63 in the whole set) and
we compute the linear regression between calculated and experimental
folding rate for each of the two folding types. In figure 3 we
report the regression plot calculated over the 34 that are correctly
predicted as TS proteins.
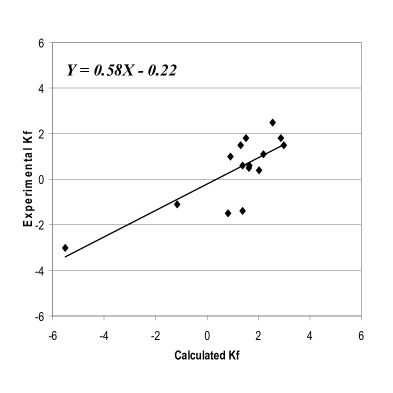
In the figure 4 the last procedure was performed for the 15 correctly
predicted MS proteins
It appears that both the slope and the intercept are different,
depending on the protein folding type, and that the correlation
coefficient and standard error are better when each folding type
is considered separately than when accumulated.
IV 4 Conclusion
This work represents a first attempt to address the problem of
the prediction of the folding mechanism using a machine learning
approach. In particular we try to predict whether the folding
process follows a two-state or a multistate mechanism and the
logarithm of the folding rate considering only few simple inputs:
the length of the protein sequence and the contact order, as
calculated according to the eq. (2). This is the first time,
at the best of our knowledge, that a statistical evaluation of
the problem is provided. We optimize our method considering different
values of the cut-off radius and introducing a sequence separation
for the calculation of the contact order (CO) from the protein
structure, in order to discriminate local versus non local interactions.
Our approach allows to generalize on the given examples since
it is tested adopting a cross-validation procedure. We find that
the best predictive performance is achieved when the value of
the contact order is calculated using a cut-off radii of 9 Å
and a sequence separation larger or equal to 6, suggesting that
non local more than local interactions are important in determining
the parameters at hand for the given protein set.
With our method the prediction of possible intermediate states
during the folding process reaches accuracy of 78% with a significant
Matthew’s correlation coefficient of 0.53. Furthermore, when
predictions with a reliability index value =3 are considered,
the SVM method increases its accuracy to 85% and its correlation
to 0.66 over 75% of the database. Results in Tab. 2 indicate
that for discriminating between TS and MS folding mechanisms,
contacts between residues with sequence separation >6 are
important. In turn, for predicting the value of the logarithm
of the folding rate the highest score is obtained considering
all the contacts. On the contrary, with respect to the classification
between TS and MS proteins, the regression task for the prediction
of the logarithm of kf, performs better when local and non
local interactions are considered taking also into account contacts
with sequence separation less or equal then 6. In this particular
task our best method reaches a significant correlation coefficient
of 0.65 with a related standard error of 1.35. These values can
be considered satisfactory, since they are obtained with only
two element vectors as input in the training of the SVM and since
the method is tested using a cross-validation procedure.
In order to improve the prediction of the logarithm of the folding
rate in the last part of this work we developed a new method
that use the two different linear regression calculated over
two subsets. The two sets are built starting from the 63 proteins
and selecting the 34 proteins with correctly predicted TS kinetic
and the 15 proteins with correctly predicted MS kinetic. On this
set of 49 proteins data the linear regression fit calculated
between experimental and predicted logarithm of kf is 0.74
and the standard error is 1.25. The subsequent division of the
database in predicted TS and MS proteins leads to an increase
of the correlation between experimental and predicted logarithm
of kf. The obtained values are 0.84 when the regression fitting
is performed on the 34 correctly predicted TS proteins and 0.79
when the regression fitting is calculated over the 15 predicted
MS proteins, respectively. Similarly, a general decrease of the
standard error that reaches a mean value of about 0.90 is noticed.
In spite of the fact that the SVM predicts incorrectly 22% of
the folding kinetic order values, the new method allows us to
improves the efficacy in the evaluation of the folding rate.
The results confirm the hypothesis that the folding rate of TS
and MS are a function of the same protein structural features
(protein length and contact order). However the relative weight
of their contribution to the overall rate constant may be different
for the two folding types.
This work represents to our knowledge the first attempt to predict
the folding protein type from sequence length and contact order,
as computed from the protein structure. Furthermore we can also
predict the folding rate constant. This value is better correlated
to experimental values when the two folding protein types are
considered separately, suggesting that sequence length and contact
order interplay differently as a function of the protein folding
type. Although the number of available experiments is not so
high this research suggests some ideas and a general procedure
to investigate the kinetic of the protein folding.
V ACKNOWLEDGMENTS
This work was supported by following grants: PNR 2001-2003 (FIRB art. 8) and PNR 2003 project (FIRB art. 8) on Bioinformatics for Genomics and Proteomics and LIBI-Laboratorio Internazionale di Bioinformatica, both delivered to RC. EC is supported by a grant of the European Union VI Framework Programme to the Bologna Node of the Biosapiens Network of Excellence project.
References
- Jackson (1998) S. E. Jackson, Fold Des 3, R81 (1998).
- Plaxco et al. (1998) K. W. Plaxco, K. T. Simons, and D. Baker, J Mol Biol 227, 985 (1998).
- Fersht (2000) A. R. Fersht, Proc. Natl. Acad. Sci. USA 97, 1525 (2000).
- Gianni et al. (2003) S. Gianni, N. R. Guydosh, F. Khan, T. D. Caldas, U. Mayor, G. W. N. White, M. L. DeMarco, V. Daggett, and A. R. Fersht, Proc. Natl. Acad. Sci. USA 100, 13286 (2003).
- Compiani et al. (2004) M. Compiani, E. Capriotti, and R. Casadio, Phys Rev E Stat Nonlin Soft Matter Phys 69, 051905 (2004).
- Plaxco et al. (2000) K. W. Plaxco, K. T. Simons, I. Ruczinski, and D. Baker, Biochemistry 39, 11177 (2000).
- Garbuzynskiy et al. (2004) S. O. Garbuzynskiy, A. V. Finkelstein, and O. V. Galzitskaya, J Mol Biol 336, 509 (2004).
- Zhou and Zhou (2002) H. Zhou and Y. Zhou, Biophys J 82, 458 (2002).
- Ivankov et al. (2003) D. N. Ivankov, S. O. Garbuzynskiy, E. Alm, K. W. Plaxco, D. Baker, and A. V. Finkelstein, Protein Sci. 12, 2057 (2003).
- Debe and Goddard (1999) D. A. Debe and W. A. Goddard, J Mol Biol pp. 619–625. (1999).
- Gong et al. (2003) H. Gong, D. G. Isom, R. Srinivasan, and G. D. Rose, J Mol Biol 327, 1149 (2003).
- Galzitskaya et al. (2003) O. V. Galzitskaya, S. O. Garbuzynskiy, D. N. Ivankov, and A. V. Finkelstein, Proteins 51, 162 (2003).
- Ivankov and Finkelstein (2004) D. N. Ivankov and A. V. Finkelstein, Proc Natl Acad Sci USA 101, 8942 (2004).
- Berman et al. (2000) H. M. Berman, J. Westbrook, Z. Feng, G. Gilliland, T. N. Bhat, H. Weissig, I. N. Shindyalov, and P. E. Bourne, Nucleic Acids Res 28, 235 (2000).
- Kabsch and Sander (1983) W. Kabsch and C. Sander, Biopolymers 22, 2577 (1983).
- Altschul et al. (1997) S. F. Altschul, T. L. Madden, A. A. Shaffer, J. Zhang, Z. Zhang, W. Miller, and D. I. Lipman, Nucleic Acids Res 25, 3389 (1997).