Magnetic Susceptibility: Solutions, Emulsions, and Cells
Abstract
Differences in magnetic susceptibility between various compartments in heterogeneous samples can introduce unanticipated complications to NMR spectra. On the other hand, an understanding of these effects at the level of the underlying physical principles has led to the development of several experimental techniques that provide data on cellular function that are unique to NMR spectroscopy. To illustrate some key features of susceptibility effects we present, among a more general overview, results obtained with red blood cells and a recently described model system involving diethyl phthalate in water. This substance forms a relatively stable emulsion in water and yet it has a significant solubility of mmol at room temperature; thus, the NMR spectrum has twice as many resonances as would be expected for a simple solution. What determines the relative intensities of the two families of peaks and can their frequencies be manipulated experimentally in a predictable way? The theory used to interpret the NMR spectra from the model system and cells was first developed in the context of electrostatics nearly a century ago, and yet some of its underlying assumptions now warrant closer scrutiny. While this insight is used in a practical way in this article, the accompanying article deals with the mathematics and physics behind this new analysis.
INTRODUCTION
Purpose
Our aim is to provide an understanding of how differences in magnetic susceptibility in different regions of a sample impinge on NMR spectra and magnetic resonance imaging (MRI) images of cellular systems. In high-resolution NMR of liquids, magnetic susceptibility effects are known to impinge on resolution and the accurate assignment of chemical shifts (e.g., 1), while in heterogeneous samples the situation is more complex. Hence, we begin with a brief overview of the motivation to understand this area as NMR spectroscopists investigating cells, and then describe the basic physics of magnetism as it relates to heterogeneous systems. Following this, we describe an NMR method for the measurement of magnetic susceptibility and proceed to show the “tangible” or visible spectroscopic effects of changing magnetic susceptibility in a suspension of red blood cells (RBCs). The recently studied model system of diethyl phthalate (DEP) in dilute aqueous emulsion provides an elegant example of the phenomena arising from differences in magnetic susceptibility that underlie some contemporary studies of cellular function in vivo.
Motivation
It was recently discovered that lipid globules inside muscle [so-called intramyocellular lipid (IMCL)] and those globules in subcutaneous and other tissues [socalled extramyocellular lipid (EMCL)] give 1H nuclear magnetic resonance (NMR, MRS) peaks at different frequencies in the spectrum (2, 3). This occurs despite the similarity of the chemical composition of the lipids in the different tissue compartments. It is now known that the separate frequencies are simply the consequence of a combination of the differences in magnetic susceptibility across the cellular compartments and the respective shapes of the microcompartments occupied by the lipids. This is one of the latest examples of magnetic susceptibility effects being recognized, understood, and then quantified to make a new, unique, investigative tool of cellular function in vivo (4). There has been a lot of work done over many years on understanding the effect of magnetic susceptibility differences across tissue compartments on MRI images (e.g., 5), and of the related effects of contrast agents (6); and, further insights in this area have recently been added (7, 8). Inevitably, this work has rested upon NMR studies of pure chemical systems (e.g., 1, 9) and a recent review in this journal addresses fundamental magnetic susceptibility issues relating to NMR probe design (10).
Spin Echo
To our knowledge, the first use of differences in magnetic susceptibility to study an aspect of cellular function was the exploitation of differential signal intensity, inside and outside cells, from various solutes detected in 1H spin-echo NMR spectra of RBCs (erythrocytes) in suspension (11). The physical basis of the effect is creation of inhomogeneities in the magnetic field brought about by differences in the magnetic susceptibility of the cell cytoplasm and the suspension medium. In the spin-echo experiment (acquire) the signal intensity, , after the echo time , is not only a function of the intrinsic transverse relaxation time, , of the resonant nuclei but also of the diffusive motion of the solute molecules that bear the nuclei through inhomogeneous magnetic fields. Thus,
| (1) |
where is the signal intensity when , is the magnetogyric ratio of the nucleus, is the magnitude of the magnetic field inhomogeneity expressed to a first approximation as a linear field gradient, is the diffusion coefficient of the solute, and is a term that describes the amplitude modulation of the signal due to spin–spin coupling; it has the value 1 when there is no coupling (12, 13).
In a suspension of RBCs the average magnetic field inhomogeneities are larger outside than inside the cells (11, 14). If the cells were ellipsoidal or spheroidal and were sufficiently far apart in the suspension so that they could be considered to be “isolated,” the field inside would be uniform while the field outside would be inhomogeneous (15). These shapes are surrounded by so called degree-2 surfaces as they are described by mathematical functions in which the independent Cartesian variables , , and are raised to the power 2; a familiar example is a sphere centred on the origin with a radius , its expression is . Human RBCs are biconcave discs whose surface can only be described by at least a degree-4 expression (16). Numerical solutions of the Laplace equation that yield descriptions of the magnetic fields in and around an isolated cell (see below) show that the magnetic field is nonuniform in both regions.
An early experimentally based consideration of susceptibility-induced field disturbances in NMR samples was given by Glasel and Lee (17), who studied packed beds of glass spheres surrounded by 2H2O. They deduced that there was little bound water at the surface of the glass beads but that the value of the apparent was a function of the magnetic field inhomogeneities at the glass–water boundary. Similarly, the relative intensity of the extracellular spinecho signal from oxygenated RBC is reduced outside compared with inside, when the extracellular magnetic susceptibility is increased by adding the membrane- impermeant paramagnetic cage complex Fe(III)– ferrioxamine to the suspension. In other words, the specific signal intensity is greater inside the cell as a result of a longer apparent (defined by the terms in the exponent in Eq. [1]) that is a consequence of diffusion of the extracellular solute in the inhomogeneous magnetic field around the cells. Thus, a membrane- permeable solute that is transported to the inside of RBCs in such a suspension, over periods of minutes to hours, shows progressively increasing spin-echo signal intensity. It is possible to determine the transport rate from these time courses, but there are caveats associated with interpreting these experiments: Specifically, a change in cell volume, which can arise if there is not careful control over the osmolality of added solutions, also alters the magnitude of field inhomogeneities inside and outside the cells. Nevertheless, the experiment has been used successfully to characterize the transport kinetics of alanine, lactate (11), and choline (18) into human RBCs.
It is evident from the above considerations that a detailed understanding of magnetic field theory is required in biomedical NMR spectroscopy. Because many of the features of magnetic fields in inhomogeneous media are not described in detail in the bio-NMR literature, they are discussed next.
BASIC CONCEPTS OF MAGNETISM
Magnetic Field
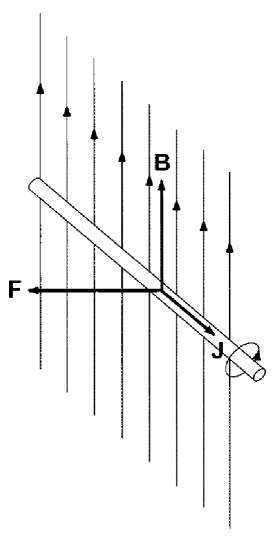
A magnetic field is said to exist in a region of space if a magnet, or a moving electric charge, experiences a force when placed in it. Lines along which the force acts throughout the space represent this field graphically. The representation suggests an analogy with streamlines in a flowing liquid, and hence it evokes the concept of magnetic flux (Latin, flow). Thus, the physical attribute that characterizes a magnetic field is its flux density (flow per unit area), expressed in units of joules per ampere per square meter. Rearrangement of these units, which are called the tesla (T), yields newtons per meter per ampere (N m-1 A-1). This provides one way of visualizing how the magnitude of the field might be measured: A magnetic field is said to have a magnetic induction (or flux density) of 1 T if a conductor of length 1 m, carrying a current of 1 A and lying at right angles to the flux lines (see Fig. 1), experiences a force of 1 N.
Clearly, magnetic fields exist in matter, and although “free space” (a vacuum) is free of matter it also can be the location for a magnetic field. Thus, a current passing through a conductor of a specified geometry creates a magnetizing force, called the magnetic field strength, , that, in turn, establishes a magnetic flux density, . The actual value of in the substance will depend on its extent of magnetic polarizability. Hence, acts on the medium to produce , and the simple relationship between these two properties is
| (2) |
where is the magnetic permeability (units, henries per meter; H m-1 = J A-2 m-1).
In a vacuum the expression has the form
| (3) |
where is the magnetic permeability of free space; it has the value H m-1. [Note that the units H (henries) are not to be confused with the symbol for the magnetizing field.]
The units of are A m-1; and one SI unit of magnetic field strength is defined as that generated at the center of a circular conductor of diameter 1 m carrying a current of 1 A. Thus, describes the physical arrangement of the magnetic field generator (shape of the current-carrying conductor and its current) while incorporates this characteristic together with an expression of the tendency of the medium in which the field resides to be magnetized.
In a medium, the interaction of the moving charges in the atoms and molecules within a magnetic field leads to the induction of a bulk magnetic dipole moment, denoted by the magnetization . It has the units of magnetic dipole moment (A m2) per unit volume (m-3), or A m-1, just like . Therefore, we write
| (4) |
We can derive Eq. [2] from Eq. [4] by introducing a parameter, , called the magnetic susceptibility; it relates the magnetization of the material to the magnetic field strength as follows:
| (5) |
Thus,
| (6) | |||||
where we note that the permeability of the medium is given by . The factor is called the relative permeability. In diamagnetic materials so that , and in paramagnetic materials , so that . All materials are (weakly) diamagnetic but many are also paramagnetic. For most materials, the paramagnetism is usually stronger than the diamagnetism at room temperature, but it decreases with temperature in what is called the Curie effect (19).
Water and most common gases except oxygen are diamagnetic. Oxygen (in its low-energy triplet state) is paramagnetic, as are many ions of the transition metals.
Larmor Equation
The master equation of NMR theory is the Larmor equation; it specifies that the resonance frequency, , of a nucleus is directly proportional to the value of in its immediate neighborhood, viz., . In view of the fact that is a function of the magnetic susceptibility of the medium, a change in this value can change the resonance frequency of the nucleus; but, because the nucleus is surrounded by polarizable material the field in its immediate vicinity also depends on the shape of the macroscopic container. In other words, is also a function of the shape of the body in which the nucleus resides.
With an understanding of the basis of shifts of resonances induced by the effects of bulk magnetic susceptibility (BMS) we can readily predict the direction of shifts in resonance frequency; but see (20, 21) for caveats. What is more challenging is predicting the magnitude of shifts in variously shaped compartments of cells and tissues.
HOW THE GEOMETRY OF THE SAMPLE AFFECTS
General
The idea that certain materials when placed in a magnetic field lead to a distortion of the field is a familiar one and Fig. 2 shows the nature of such fields for five bodies of simple geometric form. The actual calculation of the value of the field at any point in or around the bodies requires some relatively sophisticated mathematics and computation, which is outlined in the next section but is dealt with in detail in the accompanying article (22). On the other hand, those wishing to progress rapidly to the more practical aspects of the general topic of magnetic susceptibility can safely skip the following subsection.
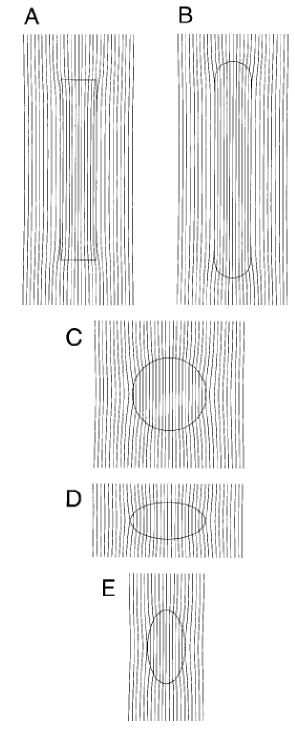
Magnetic field lines in and around five different geometric bodies that have axial symmetry in the direction of a previously uniform imposed magnetic field. The fields were calculated using the theory encompassed in Eqs. [43]–[48] of the accompanying article (22). The internal magnetic susceptibility used in the calculations was set to 0.5 (to make the field distortion visible) and the external susceptibility was 0. Of course, only the difference in susceptibility is significant in these calculations. For cylinders (A) and (B), the length of the straight sides was 10 times the radius of cross-section. For the oblate spheroid (D), and prolate spheroid (E), the semimajor axis was twice the semiminor axis, and the semimajor axes were the same as the radius of the sphere, (C).
Laplace Equation: Solution
Mathematical expressions for the macroscopic field inside and around any body are derived by several possible means but most directly by solving the Laplace equation for the magnetic potential (e.g., 23). It is known from one of the four Maxwell equations (Ampere’s law with ; 24) that the curl of the magnetic field in a magnetostatic situation is zero, so , hence, is described by the gradient of a scalar potential such that . Then, from Eq. [2] can also be found from the scalar potential viz., . Another of Maxwell’s equations (absence of free magnetic monopoles) states that , so
| (7a) | |||
| In uniform materials, for which is a constant value, this equation reduces to the Laplace equation: | |||
| (7b) | |||
In turn, in Cartesian coordinates this equation is written as
| (8) |
The solution of the Laplace equation for a given boundary/body depends on the specification of the behaviour of at infinity and at the surface of the body (23). The latter depends on the magnetic susceptibilities inside and outside the body. For bodies of various shapes the solution of the Laplace equation entails finding a coordinate system for which the body surface is a coordinate surface, in which case Eq. [8] takes on a much more complicated form. This new representation of the Laplace equation enables the use of the mathematical method of separation of variables to solve it (e.g., 15, 23).
Special Cases
It is a well-established theoretical prediction and an experimentally verified fact that if a homogeneous spherical body is placed in a uniform imposed magnetic field then the resulting field inside the body is uniform, even if the magnetic susceptibility of the material is different from that outside (see references in 15, 19, 24). This is also the outcome for oblate and prolate spheroids and even for general ellipsoids. Thus, it occurs with bodies described as degree-2 surfaces in Cartesian coordinates and is a mathematical result that can be traced to the fact that the solution of a second-order differential equation has an indicial equation of degree 2 (23). Interestingly, a uniform field also arises in the central spheroid in a series of confocal spheroids (15). In all cases involving ellipsoids the direction of the field is not parallel to the imposed field if the axis/axes of rotational symmetry are not parallel to the imposed uniform field.
For a long homogeneous cylinder in a uniform imposed field, the field inside is uniform apart from inhomogeneities near the two ends [Fig. 2(A)]. Thus, the cylinder behaves like an elongated prolate spheroid and the internal field is only parallel to its long axis if it is parallel to the imposed field.
Analysis yields an expression that provides the value of the macroscopic field inside the body, but it does not specify the field at the level of an atomic nucleus in a molecule in the body. After all, it is the latter field that determines the Larmor frequency of the nucleus so it is the one whose value we seek in order to predict the Larmor frequency of the nucleus when it is inside the body. The subtleties of calculating this nuclear field, , are presented in the accompanying article. It suffices for this article to simply declare that the value of in a spherical body, even when its magnetic susceptibility is different from outside, is the same as that of the uniform imposed field outside. On the other hand, for a long cylinder the value of is different from . It is greater or less than depending upon whether the body has a greater or lesser magnetic susceptibility than outside and on its orientation with respect to the direction of . Manipulation of these macroscopic situations forms the basis of an elegantly simple means of measuring the magnetic susceptibility of a solution, as follows.
MEASURING MAGNETIC SUSCEPTIBILITY
Apparatus
This measurement is most conveniently performed in a modern NMR spectrometer by using the method of Frei and Bernstein (25). It employs a glass capillary that is expanded out at one end to a small sphere to make a capillary–sphere (cs) assembly (Fig. 3).
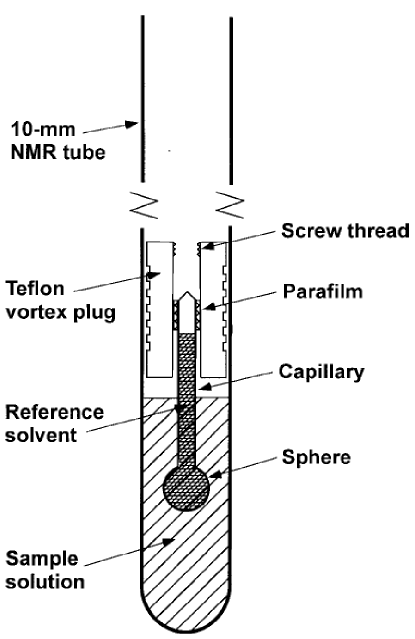
These devices are commercially available from, e.g., Wilmad (Buena, NJ; catalog item 529A). The capillary has an internal diameter of mm, an external diameter of 1.5 mm, and is 40 mm long; the sphere has an external diameter of 4.1 mm. The reference compound that is commonly used in the cs is benzene because it has a single 1H NMR resonance that is separated from those of many (biologic) compounds. Melting the glass at the top of the capillary seals the cs; for nonorganic solvents the tube can be sealed with Parafilm. The hole of a Teflon vortex plug is drilled out to an internal diameter of 2.5 mm to accommodate the capillary, which is held in place with Parafilm wrapped around its upper end. The flexibility of the Parafilm enables the sphere to be readily adjusted to lie coaxially in the sample tube.
We use a conventional 10-mm NMR tube to hold 3 mL of the liquid whose susceptibility is to be measured. The vortex plug, with the cs inserted into it, is positioned in the NMR tube so that the sphere lies within the lower limit of the receiver coil, as judged by using the sample depth gauge that is supplied by the NMR probe manufacturer. This choice of position ensures that a signal is readily detected from the contents of both the capillary and the sphere.
A simple 90∘ pulse-acquire RF-pulse sequence is used to record a spectrum that, of course, includes resonances from the benzene in the cs and from the compounds in the sample. Other reference solvents or solutes in solution, for which the magnetic susceptibilities are known, can be used and other nuclides such as 13C, 19F, or 31P, detected.
Analysis: Example
Figure 4(A) shows a typical 1H NMR spectrum from
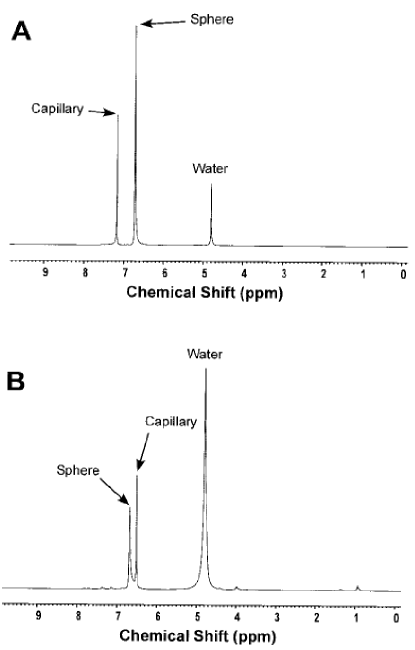
a Frei–Bernstein experiment for which there was benzene in the cs and 2H2O in the sample tube. The signal labeled “water” is from a small amount of 1HO2H in the 2H2O, while the assignments to the benzene in the sphere and the capillary were based on the relative volumes of each in the region of the receiver coil; these are readily determined by readjusting the position of the cs with respect to the receiver coil and then recording another spectrum.
The estimated value of of the sample (2H2O) depends linearly on the separation between the two resonances and is given by (25)
| (9) |
where is the chemical shift (in ppm, measured with a standard reference compound or, as was done here, assigning the chemical shift of water to 4.8 ppm), the s denote the magnetic susceptibilities, and the s are geometric constants that depend on the shape of the compartment. In the particular case of a cylinder lying parallel to , and a sphere, the factors are -1/3 and 0, respectively (see Eq. [51] in the accompanying article (22), for which ). The sphere and capillary are rarely of perfectly ideal shape, so the term ( is determined as a single calibration factor using the known susceptibilities of benzene and 2H2O (21). In the present case, therefore, Fig. 4(A) can be used to estimate . Thus, was measured to be 0.455 ppm (182 Hz at 400 MHz; see caption of Fig. 4). The values of and were obtained from a table of molar susceptibilities that is comprehensive but they are given in cgs-emu units (21). Magnetic susceptibility values of compounds that are useful in biologic work are given in Table 1. The values were converted to SI units by using the multiplicative factor or, if we continue to express density of matter in units of g cm-3, we use . Thus,
| (10) | |||||
Hence, for the particular cs used for Fig. 4(A), the value of was estimated to be 0.40, whereas for an ideal cs the value would have been 0.333. However, Fig. 4(A) shows only one spectrum from what in practice was a series of replicated measurements that were used to estimate a mean value and standard deviation. In this more extensive series of experiments with the solvents 2H2O, 1H2O, methanol, ethanol, acetone, and CCl4 (see Table 1 for the values used) the value for was found to be , whereas for two other assemblies the values were , and . This result underscores the need to calibrate each individual assembly with a number of substances of known .
| Compound Name |
|
|||
|---|---|---|---|---|
| Acetone | 5.78 | |||
| Benzene | 7.68 | |||
| Carbon tetrachloride | 8.68 | |||
| Dimethyl sulfoxide | 8.55 | |||
| D2O | 8.82 | |||
| Ethanol | 7.23 | |||
| Ethylene glycol | 8.77 | |||
| D-Glucose | (25∘C) 10.92 | |||
| Glycerol | 9.79 | |||
| H2O | 9.04 | |||
| Mannitol | 11.40 | |||
| Methanol | 6.66 | |||
| Myristic acid | (60∘C) 8.31 | |||
| Oleic acid | (18∘C) 8.31 | |||
| Palmitic acid | (62∘C) 8.31 | |||
| Toluene | 7.76 |
For Fig. 4(B) a paramagnetic reagent, iron dextran containing Fe(III), which is used clinically as an intravenous iron supplement, was added to the 2H2O, and the same as for Fig. 4(A) was inserted into the sample. In the spectrum, the resonance of the benzene in the capillary lies to low frequency of the sphere compared with that in Fig. 4(A) (the other small resonances that are perceptible in the spectrum are from diethyl phthalate (DEP), which was also added to the sample; see below for further discussion of this point). The separation between the two benzene peaks is -0.169 ppm. Hence, by using the value of determined above, and by rearranging Eq. [10], we can estimate the of the iron dextran solution to be
| (11a) | |||||
| (11b) | |||||
The coefficient has been factored out, so the bracketed term, which is the value given in cgs-emu units, can be compared readily with the commonly used tables (24). The value is clearly negative but less so than that of neat 2H2O.
Diamagnetic samples (e.g., Table 1) have negative magnetic susceptibilities while paramagnetic ones are positive, so a mixture of para- and diamagnetic substances will have a net value that is a weighted sum of each of the contributions. In the sample used for Fig. 4(B) iron dextran was dissolved in 2H2O. As we have seen, 2H2O alone is diamagnetic but is iron dextran paramagnetic or simply less diamagnetic? In fact, the sample has both dia- and paramagnetic constituents so a key question is, how do we measure the magnetic susceptibility of each constituent of a mixture, and in turn how do we use the values to predict the net value for a mixture? We now address this task.
WIEDEMANN S ADDITIVITY LAW
Different -Types
This law (19) is a consequence of the superposition principle for electrostatic and magnetic fields that specifies that the field at a given point in space is the linear vector sum of contributions from all sources. Wiedemann s law states that the overall magnetic susceptibility of a mixture is the weighted sum of the magnetic susceptibilities of the constituents, weighted according to their relative volumes of occupation of the mixture, which is usually a solution. Thus, in mathematical form it is written as
| (12) |
where denotes the volume of the mixture occupied by substance , whose magnetic susceptibility is . Therefore, it is evident why the susceptibility, which is dimensionless, is nevertheless referred to as the volume susceptibility and often written with a subscript , namely, .
On the other hand, it is sometimes useful to express the susceptibilities in terms of masses; hence in a mixture, the weighting factors are the corresponding masses:
| (13) |
where is the so-called mass susceptibility and the are the relative masses of the components of the mixture. Because , where is the density of the th component, the relationship between mass and volume susceptibility is
| (14) |
where for convenience we use the reciprocal of the density, , known as the partial specific volume.
Yet another way of expressing the overall magnetic susceptibility of a mixture is to use the number of moles, , of each substance in the mixture; this uses molar magnetic susceptibilities as follows:
| (15) |
Thus, the molar susceptibility is related to the volume susceptibility by
| (16) |
As noted above, tables of magnetic susceptibilities are often given as molar susceptibilities (e.g., 26) but when studying solutions it is simplest to use volume susceptibilities, as given in Table 1. As well as being cautious with the factor of , care must be exercised in correcting for changes in solute density with temperature.
Complications with Wiedemann s Law
There are potential traps in calculating the net magnetic susceptibility of a mixture from the known susceptibilities of all the constituents and their relative volumes or masses. The most obvious problems arise if there are chemical reactions between the constituents; any changes in chemical properties can clearly change magnetic ones. Another effector of susceptibility is a change in the conformation of a macromolecule, such as occurs in hemoglobin when ligands such as 2,3-bisphosphoglycerate bind to it; and, a further effect is brought about by the binding of oxygen to heme that alters the spin state of the prosthetic Fe atom (27, 28).
RED BLOOD CELLS
Measurement of
Figure 5(A) shows the 1H NMR spectrum from a Frei Bernstein experiment in which the sample was a suspension of RBCs of hematocrit (Ht) 77%, and the central peak is from the residual 1H2O in the cells that had been centrifugally washed in 2H2O saline. In contrast, Fig. 5(B) shows the spectrum obtained with the lower Ht of 54%. The larger separation (200 Hz compared with 183 Hz) between the benzene resonances from the cs for the suspension of lower Ht indicates that the RBCs were less diamagnetic than the saline bathing medium.
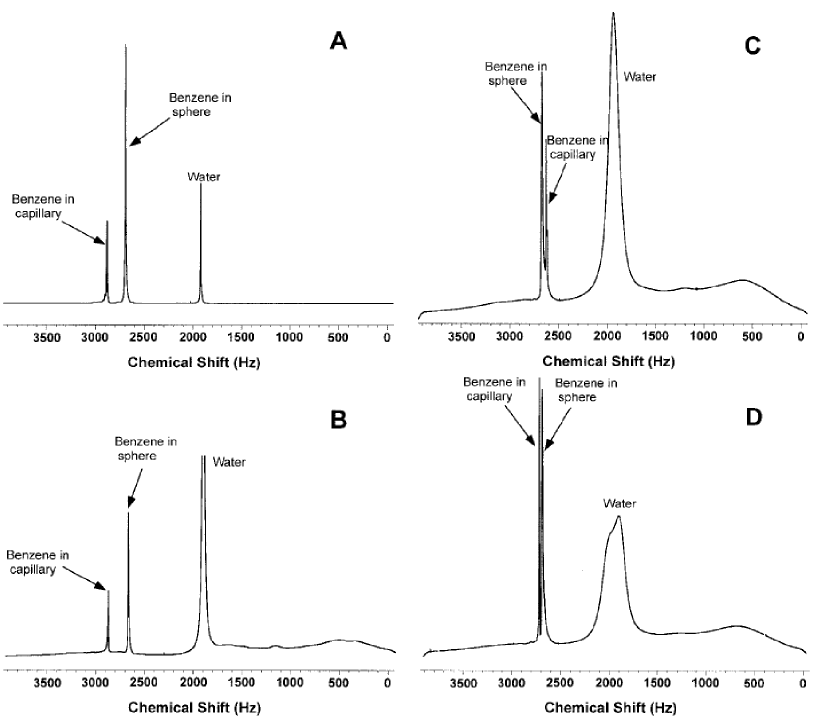
Further, Fig. 5(C) shows the outcome from RBCs of Ht 77%, in which the Fe in the hemoglobin was oxidized by adding NaNO2 to the suspension (29). In the presence of molecular oxygen the nitrite abstracts an electron from Fe(II) in the heme of hemoglobin to generate nitrate and an Fe(III) hemoglobin complex that is known to be paramagnetic. The resonance from the benzene in the cylinder is now to low frequency of that from the sphere. However, for Ht = 54% [Fig. 5(D)] the magnitude of the paramagnetic effect of the Fe(III) in the hemoglobin is weaker so that the resonance from the capillary remains (slightly) to high frequency of the peak from the sphere.
An important conclusion that can be drawn from these data is that the magnetic susceptibility of an RBC suspension of hematocrit in the physiological range of 35 45%, which contains all its hemoglobin in the (oxidized) met state, is still diamagnetic. The net magnetic susceptibility of a suspension of RBCs is only positive, namely, paramagnetic, if all the hemoglobin is converted to the met form and the Ht is well above the physiological value of 40%.
The net magnetic susceptibility of the RBC suspension is the volume-weighted sum of the volume susceptibility of water, ions, membrane constituents, and the hemoglobin molecules (which make up 95% of the cell s proteins). In turn, the magnetic susceptibility of hemoglobin is the weighted sum of the diamagnetic susceptibility of the globin, the diamagnetic susceptibility of the heme moieties, and the paramagnetic susceptibility of Fe(III), as has been reported by Cerdonio et al. (27, 28).
Another obvious finding from Figs. 5(C) and (D) is the broadness of the water signal in the presence of paramagnetic hemoglobin. This is understood to be due to two effects:
-
1.
The large difference in the magnetic susceptibility between the inside and outside of the cells creates large spatial magnetic field variations in and around the cells. This gives rise to a distribution of Larmor frequencies.
-
2.
Rapid exchange between free water and that associated with hemoglobin ensures that the high-energy nuclear magnetic state is relaxed rapidly by the paramagnetic Fe(III) in the hemoglobin. Further, water is in rapid exchange across the cell membranes, in a process mediated primarily by aquaporins, so protons in the water molecules outside the cells also have their relaxation rates enhanced.
EMULSIONS AND SOLUTIONS
Context
We recently found that some amphipathic molecules, in particular various phthalate esters, when added to suspensions of RBCs give rise to two sets of 1H NMR resonances. The study was part of an investigation of the drug detoxification characteristics of human RBCs and the phthalates were used as model xenobiotic compounds (30). Diethyl phthalate in a suspension of RBCs not only gave two sets of resonances from each proton in the molecule but over time the relative intensities of one of the sets declined (30, 31). The separate sets of resonances were attributed to intraand extracellular populations of the compound, while the change in relative intensity with time was originally attributed to metabolism. Only when the 1H NMR spectrum of the stock aqueous sample was obtained was it appreciated that the two sets of peaks were from DEP in free solution, and the remainder was in (presumably spherical) microdroplets. The explanation for the decline in one set of peaks was the binding of the free compounds to cellular proteins, probably hemoglobin, and the progressive coalescence of the microdroplets in a process of separation of the phthalate phase from the aqueous one.
The analysis of these spectra was illuminated by an understanding of the effects on the proton resonance frequencies of having neat DEP in microdroplets. The significantly different magnetic susceptibility of the DEP in aqueous solution and in the microdroplets was at least part of the basis of the different resonance frequencies. The various features of the spectra and a more general understanding of the effects of differences in magnetic susceptibility in heterogeneous systems that arise in the DEP system are described next.
Neat DEP
Figure 6(A) shows the structure of DEP and its 1H NMR spectrum. The relatively low resolution has a positive pedagogic outcome: It enables us to focus attention on the main resonances and not their fine structure or splitting patterns. Assignment of the methyl and methylene resonances is straightforward, with the methylene resonance at the higher frequency.
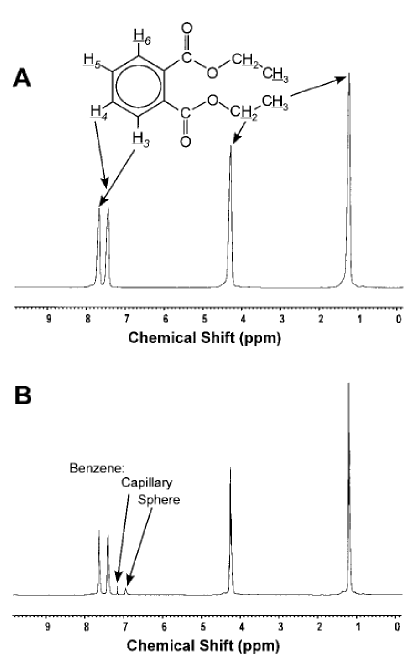
However, because proton chemical shifts are not readily predicted for aromatic rings with two ortho substituents (32), and the solvent system we describe here might be considered somewhat unusual, we confirmed the assignments shown in Fig. 6(A) by HSQC and HMBC spectra. Note that in Fig. 6(A) the position numbers of the atoms are given in italics and do not indicate spin systems. The spin systems are of the type AA’BB’ for each set of aromatic protons. The HMBC spectrum yielded a strong correlation due to the 3-bond coupling between the protons that are ortho to each carboxyl group and the carboxyl carbon atoms; no correlation was observed for the relatively small coupling between the meta protons and carboxyl carbon atom.
The relative areas of the peaks corresponding to the protons in DEP should be in the ratio 3:2:2:2 for the respective signals from low to high frequency. However, this is clearly not the case. The ratio is approximately correct for the aliphatic protons, but the aromatic protons, which have longer values, did not fully relax between transients because the recycle time of spectral acquisition (compared with ) was insufficient.
of DEP
Figure 6(B) shows the 1H NMR spectrum from a Frei Bernstein experiment with neat DEP in the sample tube giving slightly better spectral resolution to that shown in Fig. 6(A); we used the same benzene-containing cs assembly described above. The signal from the benzene in the capillary is at higher frequency than from that in the sphere. This indicates that neat DEP is diamagnetic. In fact, from the difference in chemical shift of 0.21 ppm (84.1 Hz) we can use Eq. [11] to obtain an estimate of the volume magnetic susceptibility of . The negative sign indicates that DEP is diamagnetic.
2H2O as Sample and DEP in cs
Figure 7 shows the 1H NMR spectrum from a Frei Bernstein experiment in which the sample was 2H2O and DEP was in the cs instead of benzene. Deuterated water was used to reduce the intensity of the 1H2O peak.
Thus, the spectrum shows a singlet from the trace of water (2HO1H) in the 2H2O sample, with a chemical shift of 4.8 ppm. For the DEP in the cs, the methyl and methylene protons give clearly resolved peaks from the capillary and sphere. However, the peak at 7.35 ppm from H3/H6 on the benzene ring of DEP in the capillary fortuitously overlaps with the peak from the H4/H5 of the DEP in the sphere.
Recall that the only difference between the DEP that gives the two separate sets of peaks in Fig. 7 compared with Fig. 6 is the fact that part of the sample for the spectrum in Fig. 7 was located in a glass capillary and the other was in a glass sphere, while outside there was a substance of different magnetic susceptibility, 2H2O. The peak separation in Fig. 7 of 0.27 ppm (107 Hz) is substantially greater than, for example, the chemical shift change of the -protons of an amino acid such as glycine in aqueous solution with a pH change from 5 to 8.
An appreciation of the extent of this magnetic susceptibility-induced shift is important for the next stage in the interpretation of the spectra of DEP in an aqueous environment.
DEP in 2H2O in Sample with No cs
The spectrum in Fig. 8(A) was obtained with neat DEP added to 2H2O to give a concentration, averaged over the sample, of 10 mmol L-1; no cs was used. When preparing the sample, the added DEP did not completely dissolve in the 2H2O and phase separation was obvious, but vigorous shaking produced a slightly opaque mixture that appeared to be stable, at least to the eye, for several hours.
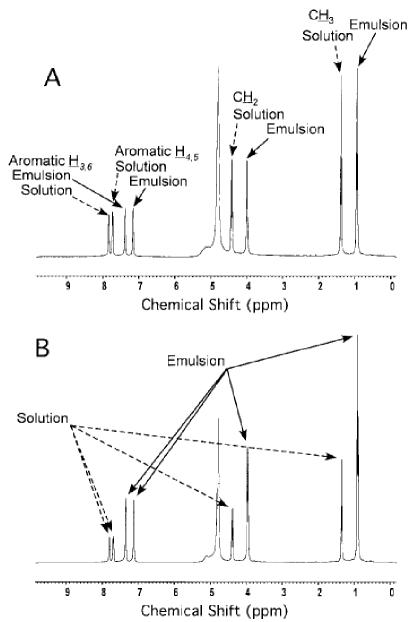
The subsequent 1H NMR spectrum contained twice as many peaks as that of neat DEP, and each pair of peaks was of almost the same amplitude and area in the two phases. In fact it was reminiscent of the spectrum in Fig. 7, for which the DEP was in the cs and 2H2O was in the sample tube. As noted in the Introduction, it was hypothesized that the two sets of peaks were from two different phases of DEP, one as neat DEP in the emulsion and one from DEP dissolved in 2H2O. But, which set of peaks is assigned to the microspheres of the emulsion?
The answer lies in the elegant result (outlined above) that for an isolated sphere in a uniform imposed magnetic field the macroscopic field inside is always uniform and has a value that depends on the difference in magnetic susceptibility across the boundary, no matter what the radius of the sphere with all other things being equal (e.g., solvent effects, see below; 23, 24). On the other hand, the magnitude of the magnetic field at a resonant nucleus is the same as that of a similar nucleus outside the sphere. This remarkable result is the basis of why a cs assembly is used in routine practice for external reference compounds when accurately determining chemical shifts in NMR spectra. The physical explanation of this result is the subject of the accompanying article.
The two peaks centered at 7.15 and 7.39 ppm are separated by 0.24 ppm, which is exactly the same as the separation between these two peaks from the DEP in the glass sphere shown in Fig. 7. This fact alone suggests that the set of four peaks to lower frequency in Fig. 8(A) are from DEP in the emulsion microspheres. However, an experiment that yields the assignment when its spectrum is compared with Fig. 8(A) is shown in Fig. 8(B). The DEP concentration was increased to 15 mmol L-1, and this was accompanied by an increase in the cloudiness of the mixture. The resulting 1H NMR spectrum showed a doubling of the amplitudes and areas of the lower-frequency peaks, thus enabling their assignment to DEP in the emulsion microspheres. The higher-frequency peaks are therefore assigned to DEP in aqueous solution, representing a solubility of 5 mmol L-1 in water, at 25∘C. In other words, because the limit of solubility of the DEP was reached at 5 mmol L-1 the more intense peaks in the spectrum must have been from the emulsion phase.
A remaining important observation is possible from Figs. 8(A) and 8(B). The separation between the resonances of the methyl and methylene protons in the emulsion phase and the aqueous solution was 0.443 ppm (177.1 Hz) and 0.426 ppm (170.2 Hz), respectively; those between the corresponding pairs of aromatic resonances were 0.561 ppm (224.5 Hz) and 0.445 ppm (178.1 Hz), respectively, for the H4/H5 and H3/H6 pairs. Another way of emphasising the difference between the solution and emulsion spectra is to note that the separation between the H4/H5 and H3/H6 resonances is 0.108 ppm (43.1 Hz) in the solution and 0.224 ppm (89.5 Hz) in the emulsion phase.
An explanation for this differential in shifts, between the emulsion and solution phases, is that H3/H6 are more exposed to the diamagnetic anisotropy of the carbonyl oxygen of the ester group than are H4/H5. In the aqueous phase this anisotropy is diminished by the binding of water. This influence is not readily apparent for the methyl and methylene protons because the flexibility of the alkyl chain allows each group of protons similar proximity to the carbonyl group.
It is clear that solvent effects of this nature can work either in opposition or additively to magnetic susceptibility effects to determine the final chemical shift. This outcome is well illustrated in the next example.
15 mmol L-1 DEP in 2H2O and Neat DEP in cs
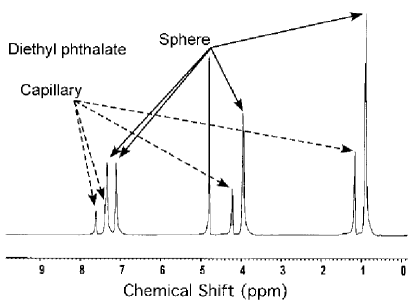
The 1H NMR spectrum from the sample arrangement given in the title of this section (Fig. 9) illustrates the predicted superposition of the resonances of the DEP in the sphere of the cs and of DEP in the emulsion phase; the superimposed peaks at 0.87, 3.9, 7.1, and 7.4 ppm are due to DEP in spherical compartments.
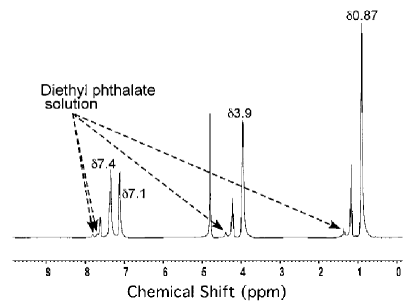
Peaks of about one-third the intensity of those due to DEP in spherical compartments are found at 1.15, 4.2, 7.4 (unresolved from the highest-frequency sphere-peak), and 7.65 ppm. These arise from DEP in the capillary of the cs. Finally, the small peaks identified by arrows in Fig. 9 are those from DEP dissolved in the 2H2O.
The assignments for DEP in the sphere (and coincident resonances for DEP in the emulsion phase) and cylinder of the cs were determined by monitoring signal intensity while moving the cs, as described above for the benzene water system [Fig. 4(A)]. The resonances whose frequency is insensitive to the position of the cs may therefore be attributed to DEP in solution in the (external) NMR tube.
OTHER PHENOMENA THAT CAUSE SHIFT EFFECTS
H-Bonding
Specific shift effects, other than magnetic susceptibility differences in a sample, occur with some phosphoryl and various 13C and 19F resonances in RBC suspensions. These latter effects we have denoted “split peak phenomena” (33, 34); they arise from the different average extent of H-bonding of water inside and outside the cells to the phosphoryl oxygen, the F atom, or the oxygen near the reporter 13C nucleus, respectively.
Shift Reagents
Another valuable experimental means of bringing about a transmembrane NMR chemical shift difference exists for alkali metal cations; paramagnetic lanthanide shift reagents are the main group. More recently the chemical shifts of inorganic anions have been altered by cobalt complexes of glycine and triglycine (6, 35, 36). Thus, the chemical shift of a solute in a cellular system can be affected by BMS, solvent, and shift-reagent-induced effects that may be additive or negate each other (e.g., 32).
CONCLUSIONS
The Frei Bernstein experiment (Figs. 3 and 4) provides a graphical demonstration of the effect of the shape of a macroscopic container on the chemical shift of a nuclear population, when there is a difference in magnetic susceptibility across the boundary of the container. The difference in magnetic susceptibility between that of water and an organic liquid such as DEP induces a larger shift than those due to the phenomena mentioned above.
The discovery that differences in magnetic susceptibility underlie the duplicated resonances of DEP in dilute aqueous solutions provides insights into otherwise perplexing data from DEP in RBC suspensions (30, 31). The BMS effect also accounts for the separate resonances from lipid in spherical droplets inside skeletal muscle and outside in elongated, more cylinder- like, adipocytes (2 4, 8). In other words, the situation with DEP in a capillary (cylinder) and sphere assembly is an analog of muscle tissue in which there are lipid droplets inside myocytes and larger, more elongated, lipid bodies in adipocytes between the fibers. The lipid is relatively more diamagnetic than the surrounding medium, and the arm or leg of a patient will be parallel to of a horizontal magnet in an MRI/MRS scanner, so the lipid cylinders lie in the direction of ; this is the same as the orientation of the capillary used in our Frei Bernstein experiment. Thus, it is possible to predict, from what we presented above, that the signal from the extramyocellular lipid will be to high frequency of that from the intramyocellular lipid; this is confirmed by in vivo MRS (3).
In addition, we emphasized the importance of using a spherical bulb of the kind shown in Fig. 3 to contain the reference compound when an external chemical shift reference is employed in NMR spectroscopy.
While an empirical appreciation of the extent of BMS effects that might arise in studies of cellular systems can be obtained from experimental data like those in Figs 7 9 (e.g., 28), a quantitative description, or prediction of the actual value, is much more complex. The actual explanation for why the BMS shift effect does not impinge upon nuclei if they are inside a spherical bulb entails a subtle argument; this is the subject of the accompanying article (22).
ACKNOWLEDGMENTS
The work was funded by a Project Grant from the Australian Research Council to P.W.K. Bill Lowe is thanked for expert technical help and David Philp and David Regan and Drs. Tom Eykyn and Konstantin Momot are thanked for valuable discussions on the article.
REFERENCES
-
1.
VanderHart DL. Magnetic susceptibility & high resolution NMR of liquids & solids. In: Grant D, Harris R, eds. Encyclopaedia of NMR. New York: John Wiley & Sons. p 2938 2946.
-
2.
Schick F, Eisman B, Jung WJ, Bongers H, Bunse M, Lutz O. Comparison of localized proton NMR signals of skeletal muscle and fat tissue in vivo: two lipid compartments in muscle tissue. Magn Reson Med 1993; 29:158 167.
-
3.
Boesch C, Slotboom J, Hoppeler H, Kreis. In vivo determination of intra-myocellular lipids in human muscle by means of localized 1H-MR-spectroscopy. Magn Reson Med 1997; 37:484 493.
-
4.
Hakumaki JM, Kauppinen RA. 1H NMR visible lipids in the life and death of cells. TIBS 2000; 25:357 361.
-
5.
Majumdar S, Gore JC. Studies of diffusion in random fields produced by variations in susceptibility. J Magn Reson 1988; 78:41 55.
-
6.
Springer CS. Physicochemical principles influencing magnetopharmaceuticals. In: Gillies RJ, ed. NMR in Physiology and Biomedicine. San Diego: Academic Press; 1994. p. 75 99.
-
7.
Li L. Magnetic susceptibility quantification for arbitrarily shaped objects in inhomogeneous fields. Magn Reson Med 2001; 46:907 916.
-
8.
Steidle G, Machann J, Claussen CD, Schick F. Separation of intra- and extramyocellular lipid signals in proton MR spectra by determination of their magnetic field distribution. J Magn Reson 2002; 154:228 235.
-
9.
Homer J, Aldaffaee HK. Volume magnetic-susceptibilities from nuclear magnetic-resonance chemical-shift studies of heterogeneously dispersed liquids. J Chem Soc Faraday Trans 1985; 81:803 809.
-
10.
Doty DF, Entzminger G, Yang YA. Magnetism in high-resolution NMR probe design. I: General methods. Concepts Magn Reson 1998; 10:133 156.
-
11.
Brindle KM, Brown, FF, Campbell ID, Grathwohl C, Kuchel, PW. Application of spin echo nuclear magnetic resonance to whole cell systems: membrane transport. Biochem J 1979; 180:37 44.
-
12.
Rabenstein DL. 1H NMR method for the non-invasive study of metabolism and other processes involving small molecules in intact erythrocytes. J Biophys Biochem Meth 1984; 8:277 306.
-
13.
Kuchel PW. Biological applications of NMR. In: Field LD, Sternhell S, eds. Analytical NMR. Chichester,UK: John Wiley & Sons;1989. p 157 219.
-
14.
Endre ZH, Chapman BE, Kuchel PW. Cell volume dependence of 1H spin echo NMR signals in human erythrocyte suspensions: influence of in-situ field gradients. Biochim Biophys Acta 1984; 803:137 144.
-
15.
Kuchel PW, Fackerell, ED. Parametric-equation representation of biconcave erythrocytes. Bull Math Biol 1999; 61:209 220.
-
16.
Kuchel PW, Bulliman BT. Perturbation of homogeneous magnetic fields by isolated cells modelled as single and confocal spheroids: implications for magnetic resonance spectroscopy and imaging. NMR Biomed 1989; 2:151 160.
-
17.
Glasel JA, Lee KH. On the interpretation of water nuclear magnetic resonance relaxation times in heterogeneous systems. J Am Chem Soc 1974; 96:970 978.
-
18.
Jones AJ, Kuchel PW. Measurement of choline concentration and transport in human erythrocytes by 1H NMR: comparison of normal blood and from lithiumtreated psychiatric patients. Clin Chim Acta 1980; 104: 77 85.
-
19.
Pople JA, Schneider WG, Bernstein HJ. High-Resolution Nuclear Magnetic Resonance. New York: McGraw-Hill; 1959.
-
20.
Levitt MH. The signs of frequencies and phases in NMR. J Magn Reson 1997; 126:164 182.
-
21.
Levitt MH. Signs of frequencies and phases in NMR: the role of radiofrequency mixing. J Magn Reson 2000; 142:190 194.
-
22.
Durrant CJ, Hertzberg MP, Kuchel PW. 2003. Magnetic susceptibility: further insights into macroscopic and microscopic fields and the sphere of Lorentz. Concepts Magn Reson Part A 18A:72 95.
-
23.
Moon P, Spencer DE. Field Theory for Engineers. Princeton, NJ: Van Nostrand; 1961.
-
24.
Jackson JD. Classical Electrodynamics, 3rd Ed. New York: John Wiley & Sons; 1998.
-
25.
Frei K, Bernstein HJ. Method for determining magnetic susceptibilities by NMR. J Chem Phys 1962; 37:1891 1892.
-
26.
Weast RC. CRC Handbook of Chemistry and Physics. Boca Raton, FL: CRC Press; 1983.
-
27.
Cerdonio M, Morante S, Vitale S. Magnetic susceptibility of haemoglobins. Meth Enzymol 1981; 76:354 371.
-
28.
Cerdonio M, Morante S, Torresani D, Vitale S, de Young A, Noble RW. Reexamination of the evidence for paramagnetism in oxy- and carbonmonoxyhaemoglobin. Proc Natl Acad Sci USA 1983; 82:102 103.
-
29.
Kosaka H, Tyuma I, Imaizumi K. Mechanism of autocatalytic oxidation of oxyhemoglobin by nitrite. Biomed Biochim Acta 1983; 42:S144 S148.
-
30.
Skibsted U, Hansen PE. 1H NMR spin echo spectroscopy of human erythrocytes. Transformation of exogenous compounds. NMR Biomed 1990; 3:248 258.
-
31.
Hansen P, Skibsted, Rae CD, Kuchel PW. 1H NMR of compounds with low water solubility in the presence of erythrocytes: effects of emulsion phase separation. Eur Biophys J 2001; 30:69 74.
-
32.
Jackman L, Sternhell S. Applications of Nuclear Magnetic Resonance Spectroscopy in Organic Chemistry. Oxford, UK: Pergamon Press; 1969. p. 203.
-
33.
Kirk K, Kuchel PW. The contributions of magnetic susceptibility effects to transmembrane chemical shift differences in the NMR spectra of oxygenated erythrocyte suspensions. J Biol Chem 1989; 263:130 134.
-
34.
Kuchel PW, Chapman BE, Xu AS-L. Rates of anion transfer across erythrocyte membranes measured with NMR spectroscopy. In: Bamberg E, Passow H, eds. The Band 3 Proteins: Anion Transporters, Binding Proteins and Senescent Antigens. Amsterdam: Elsevier; 1992; p.105 119.
-
35.
Chu SC-K, Xu Y, Balschi JA, Springer CS. Bulk magnetic- susceptibility shifts in NMR-studies of compartmentalized samples use of paramagnetic reagents. Magn Reson Med 1990; 13:239 262.
-
36.
Lin WR, Mota de Freitas DM. Cl-35 NMR study of Cl distribution and transport in human red blood cell suspensions. Magn Reson Chem 1996; 34:768 772.