Chapter 4: Knowledge-based energy functions for computational studies of proteins
4.1 Introduction
This chapter discusses theoretical framework and methods for developing knowledge-based potential functions essential for protein structure prediction, protein-protein interaction, and protein sequence design. We discuss in some details about the Miyazawa-Jernigan contact statistical potential, distance-dependent statistical potentials, as well as geometric statistical potentials. We also describe a geometric model for developing both linear and non-linear potential functions by optimization. Applications of knowledge-based potential functions in protein-decoy discrimination, in protein-protein interactions, and in protein design are then described. Several issues of knowledge-based potential functions are finally discussed.
In the experimental work that led to the recognition of the 1972 Nobel prize in chemistry, Christian Anfinsen showed that a completely unfolded protein ribonuclease could refold spontaneously to its biologically active conformation. This observation indicates that the sequence of amino acids of a protein contains all of the information needed to specify its three-dimensional structure (Anfinsen et al., 1961; Anfinsen, 1973). The automatic in vitro refolding of denatured proteins was further confirmed in many other protein systems (Janicke, 1987). Anfinsen’s experiments led to the thermodynamic hypothesis of protein folding, which postulates that a native protein folds into a three-dimensional structure in equilibrium, in which the state of the whole protein-solvent system corresponds to the global minimum of free energy under physiological conditions.
Based on this thermodynamic hypothesis, computational studies of proteins, including structure prediction, folding simulation, and protein design, all depend on the use of a potential function for calculating the effective energy of the molecule. In protein structure prediction, the potential function is used either to guide the conformational search process, or to select a structure from a set of possible sampled candidate structures. Potential function has been developed through an inductive approach (Sippl, 1993), where the parameters are derived by matching the results from quantum-mechanical calculations on small molecules to experimentally measured thermodynamic properties of simple molecular systems. These potential functions are then generalized to the macromolecular level based on the assumption that the complex phenomena of macromolecular systems result from the combination of a large number of interactions as found in the most basic molecular systems. This type of potential function is often referred to as “physics-based”, “semi-empirical” effective potential function, or a force field (Levitt and Warshel, 1975; Wolynes et al., 1995; Momany et al., 1975; Karplus and Petsko, 1990). The physics-based potential functions have been extensively studied over the last three decades, and has found wide uses in protein folding studies (Duan and Kollman, 1998; Lazaridis and Karplus, 2000). Nevertheless, it is difficult to use physics-based potential functions for protein structure prediction, because they are based on full atomic model and therefore require high computational cost. In addition, a physical model may not fully capture all of the important physical interactions. Readers are referred to Chapter 4 for a detailed discussion of physics-based potential functions.
Another type of potential function is developed through a deductive approach by extracting the parameters of the potential functions from a database of known protein structures (Sippl, 1993). Because this approach implicitly incorporates many physical interactions (electrostatic, van der Walls, cation- interactions) and the extracted potentials do not necessarily reflect true energies, it is often referred to as “knowledge-based effective energy function”. In recent past, this approach has quickly gained momentum due to the rapidly growing database of experimentally determined three-dimensional protein structures. Impressive successes in protein folding, protein-protein docking and protein design have been achieved recently using knowledge-based scoring functions (Russ and Ranganathan, 2002; Venclovas et al., 2003; Hu et al., 2004; Méndez et al., 2005). In this chapter, we focus our discussion on this type of potential functions.
4.2 General framework
Several different approaches have been proposed to extract knowledge-based scoring functions from protein structures. They can be categorized roughly into two groups. One prominent group of knowledge-based potentials are those derived from statistical analysis of database of protein structures (Tanaka and Scheraga, 1976a; Miyazawa and Jernigan, 1985; Samudrala and Moult, 1998; Lu and Skolnick, 2001). In this class of potentials, the interacting potential between a pair of residues are estimated from its relative frequency in database when compared with that in a reference state or a null model (Miyazawa and Jernigan, 1996; Samudrala and Moult, 1998; Lu and Skolnick, 2001; Wodak and Rooman, 1993; Sippl, 1995; Lemer et al., 1995; Jernigan and Bahar, 1996; Simons et al., 1999a). A different class of knowledge-based potentials are based on optimization. In this case, the set of parameters for the potential functions are optimized by some criterion, e.g., by maximizing the energy gap between known native conformation and a set of alternative (or decoy) conformations (Goldstein et al., 1992; Maiorov and Crippen, 1992; Thomas and Dill, 1996a; Tobi et al., 2000a; Vendruscolo and Domanyi, 1998; Vendruscolo et al., 2000a; Bastolla et al., 2001; Dima et al., 2000; Micheletti et al., 2001; Dobbs et al., 2002; Hu et al., 2004).
There are three main ingredients for developing a knowledge-based potential function. We first need protein descriptors to describe the sequence and the shape of the native protein structure in a format that is suitable for computation. We then need to decide on a functional form of the potential function. Finally, we need a method to derive the values of the parameters for the potential function.
4.2.1 Protein representation and descriptors.
To describe the geometric shape of a protein and its sequence of amino acid residues, a protein is frequently represented by a -dimensional descriptor . For example, a method that is widely used is to count non-bonded contacts of 210 types of amino acid residue pairs in a protein structure. In this case, the count vector , is used as the protein descriptor. Once the structural conformation of a protein and its amino acid sequence is given, the protein descriptions will fully determine the -dimensional vector . In the case of contact descriptor, corresponds to the mapping provided by specific contact definition, e.g., two residues are in contact if their distance is below a cut-off threshold distance. At the residue level, the coordinates of of , , or side-chain center can be used to represent the location of a residue. At atom level, the coordinates of atoms are directly used, and contact may be defined by the spatial proximity of atoms. In addition, other features of protein structures can be used as protein descriptors as well, including distances between residue or atom pairs, solvent accessible surface areas, dihedral angles of backbones and side-chains, and packing densities.
4.2.2 Functional form.
The form of the potential function determines the mapping of a -dimensional descriptor to a real energy value. A widely used functional form for protein scoring function is the weighted linear sum of pairwise contacts (Tanaka and Scheraga, 1976a; Miyazawa and Jernigan, 1985; Tobi et al., 2000a; Vendruscolo and Domanyi, 1998; Samudrala and Moult, 1998; Lu and Skolnick, 2001). The linear sum is:
| (4.1) |
where “” denotes inner product of vectors; is the number of occurrence of the -th type of descriptor. As soon as the weight vector is specified, the potential function is fully defined. In subsection 4.4.3, we will discuss a nonlinear form potential function.
4.2.3 Deriving parameters of potential functions.
For statistical knowledge-based potential functions, the weight vector for linear potential is derived by characterization of the frequency distributions of structural descriptors from a database of experimentally determined protein structures. For optimized knowledge-based linear potential function, is obtained through optimization. We describe the details of these two approaches below.
4.3 Statistical method
4.3.1 Background
In statistical methods, the observed statistical frequencies of various protein structural features are converted into effective free energies, based on the assumption that frequently observed structural features correspond to low-energy states (Tanaka and Scheraga, 1976b; Miyazawa and Jernigan, 1985; Sippl, 1990). This is the Boltzmann’s principle, an idea first proposed by Tanaka and Scheraga (1976) to estimate potentials for pairwise interaction between amino acids (Tanaka and Scheraga, 1976b). Miyazawa and Jernigan (1985) significantly extended this idea and derived a widely-used statistical potentials, where solvent terms are explicitly considered and the interactions between amino acids are modeled by contact potentials. Sippl (1990) and others (Samudrala and Moult, 1998; Lu and Skolnick, 2001; Zhou and Zhou, 2002) derived distance-dependent energy functions to incorporate both short-range and long-range pairwise interactions. The pairwise terms were further augmented by incorporating dihedral angles (Nishikawa and Matsuo, 1993; Kocher et al., 1994), solvent accessibility and hydrogen-bonding (Nishikawa and Matsuo, 1993). Singh and Tropsha (1996) derived potentials for higher-order interactions (Singh et al., 1996a, b). More recently, Ben-Naim (1997) presented three theoretical examples to demonstrate the nonadditivity of three-body interactions (Ben-Naim, 1997a). Li and Liang (2005) identified three-body interactions in native proteins based on an accurate geometric model, and quantified systematically the nonadditivities of three-body interactions (Li and Liang, 2005b).
4.3.2 Theoretical model.
At the equilibrium state, an individual molecule may adopt many different conformations or microscopic states with different probabilities. The distribution of protein molecules among the microscopic states follows the Boltzmann distribution, which connects the potential function for a microstate to its probability of occupancy . This probability or the Boltzmann factor is:
| (4.2) |
where and are Boltzmann constant and the absolute temperature measured in Kelvin, respectively. The partition function is defined as:
| (4.3) |
It is a constant under the true energy function once the sequence of a protein is specified, and is independent of the representation and descriptor of the protein. If we are able to measure the probability distribution accurately, we can obtain the knowledge-based potential function from the Boltzmann distribution:
| (4.4) |
The partition function cannot be obtained directly from experimental measurements. However, at a fixed temperature, is a constant and has no effect on the different probability of occupancy for different conformations.
In order to obtain an knowledge-based potential function that encodes the sequence-structure relationship of proteins, we have to remove background energetic interactions that are independent of the protein sequence and the protein structure. These generic energetic contributions are referred collectively as that of the reference state (Sippl, 1990). An effective potential energy is then obtained as:
| (4.5) |
where is the probability of a sequence adopting a conformation specified by the vector in the reference state. Since and are both constants, is also a constant that does not depend on the descriptor vector . If we assume that as in (Sippl, 1990), the effective potential energy can be calculated as:
| (4.6) |
To calculate , One can further assume that the probability distribution of each descriptor is independent, and we have Furthermore, by assuming each occurrence of the -th descriptor is independent, we have where and are the probability of -th type structural feature in native proteins and the reference state, respectively. In a linear potential function, the right-hand side of Equation 4.6 can be calculated as:
| (4.7) |
Correspondingly, to calculate the effective potential energy of the system, one often assumes that can be decomposed into various basic energetic terms. For a linear potential function, can be calculated as:
| (4.8) |
If the distribution of each is assumed to be linearly independent to the others in the native protein structures, we have:
| (4.9) |
In another word, the probability of each structural feature in native protein structures follows the Boltzmann distribution. This is the Boltzmann assumption made in nearly all statistical potential functions. Finkelstein (1995) summarized protein structural features which are observed to correlate with the Boltzmann distribution. These include the distribution of residues between the surface and interior of globules, the occurrence of various angles, cis and trans prolines, ion pairs, and empty cavities in protein globules (Finkelstein et al., 1995).
The probability can be estimated by counting frequency of the -th structural feature after combining all structures in the database. Clearly, the probability is determined once a database of crystal structures is given. The probability is calculated as the probability of the -th structural feature in the reference state. Therefore, the choice of the reference state has large effects and is critical for developing knowledge-based statistical potential function.
4.3.3 Miyazawa-Jernigan contact potential
Because of the importance of the Miyazawa-Jernigan model in developing statistical knowledge-based potential and its wide use, we discuss the Miyazawa-Jernigan contact potential in details. This also gives an exposure of different technical aspects of developing statistical knowledge-based potential functions.
Residue representation and contact definition. In the Miyazawa-Jernigan model, the -th residue is represented as single ball located at its side-chain center . If the -th residue is a Gly residue, which lacks a side chain, the positions of the Cα atom is taken as . A pair of residues are defined to be in contact if the distance between their side-chain centers is less than a threshold . Neighboring residues and along amino acid sequences () are excluded from statistical counting because they are likely to be in spatial contact that does not reflect the intrinsic preference for inter-residue interactions. Thus, a contact between the -th and -th residues is defined using :
where is the Euclidean distance between the -th and -th residues. Hence, the total number count of contacts of residue type with residue type in protein is:
| (4.10) |
where is the residue type of the -th amino acid residue. The total number count of contacts in all proteins are then:
| (4.11) |
Coordination and solvent assumption. The number of different types of pairwise residue-residue contacts can be counted directly from the structure of proteins following Equation 4.11. We also need to count the number of residue-solvent contacts. Since solvent molecules are not consistently present in X-ray crystal structures, and therefore cannot be counted exactly, Miyazawa and Jernigan made an assumption based on the model of an effective solvent molecule, which has the volume of the average volume of the 20 types of residues. Physically, one effective solvent molecule may represent several real water molecules or other solvent molecules. The number of residue-solvent contacts can be estimated as:
| (4.12) |
where the subscript represents the effective solvent molecule; the other indice and represent the types of amino acids; is the number of residue type in the set of proteins; is the mean coordination number of buried residue , calculated as the number of contacts formed by a buried residue of type averaged over a structure database. Here the assumption is that residues make the same number of contacts on average, with either effective solvent molecules (first term in Equation (4.12), or other residues (second term in Equation (4.12)).
For convenience, we calculate the total numbers of residues , of residue-residue contacts , of residue-solvent contacts , and of pairwise contacts of any type as follows:

Chemical reaction model. Miyazawa and Jernigan (1985) developed a physical model based on hypothetical chemical reactions. In this model, residues of type and in solution need to be desolvated before they can form a contact. The overall reaction is the formation of contacts, depicted in Figure 4.1a. The total free energy change to form one pair of contact from fully solvated residues of and is (Figure 4.1a):
| (4.13) |
where is the absolute contact energy between the -th and -th types of residues, and ; are the absolute contact energy between the -th residue and effective solvent, and ; likewise for ; are the absolute contact energies of solvent-solvent contacts .
The overall reaction can be decomposed into two steps (Figure 4.1b). In the first step, residues of type and type , initially fully solvated, are desolvated or “demixed from solvent” to form self-pairs and . The free energy changes and upon this desolvation step can be easily seen from the desolvation process (horizontal box) in Figure 4.1 as:
| (4.14) |
where are the absolute contact energies of self pair and , respectively. In the second step, the contacts in and pairs are broken and residues of type and residues of type are mixed together to form two pairs. The free energy change upon this mixing step is (vertical box in Figure 4.1):
| (4.15) |
Denote the free energy changes upon the mixing of residue of type and solvent as , We have:
| (4.16) |
which can be obtained from Equation 4.14 and Equation 4.15 after substituting “” with “”. Following the reaction model of Figure 4.1b, the total free energy change to form one pair of can be written as:
| (4.17a) | |||||
| (4.17b) | |||||
Contact energy model. The total energy of the system is due to the contacts between residue-residue, residue-solvent, solvent-solvent:
| (4.18) |
Because the absolute contact energies is difficult to measure and knowledge of this value is unnecessary for studying the dependence of energy on protein conformation, we can simplify Equation 4.18 further. Our goal is to separate out terms that do not depend on contact interactions and hence do not depend on the conformation of the molecule. Equation 4.18 can be re-written as:
| (4.19a) | |||||
| (4.19b) | |||||
by using Equation 4.12 and Equation 4.13. Here only the second terms in Equation 4.19a and 4.19b are dependent on protein conformations. Therefore, only either or needs to be estimated. Since the number of residue-residue contacts can be counted directly while the number of residue-solvent contacts is more difficult to obtain, Equation 4.19a is more convenient for calculating the total contact energy of protein conformations. Both and are termed as effective contact energies and their values were reported in (Miyazawa and Jernigan, 1996).
Estimating effective contact energies: quasi-chemical approximation. The effective contact energies in Equation 4.19a can be estimated in unit by assuming that the solvent and solute molecules are in quasi-chemical equilibrium for the reaction depicted in Figure 4.1a:
| (4.20) |
where , and are the contact numbers of pairs between residue type and , residue type and solvent, and solvent and solvent, respectively. is the total number of contacts in the system and is canceled out. Similarly, and can be estimated from the model depicted in Figure 4.1b:
| (4.21a) | |||||
| (4.21b) | |||||
Based on these models, two different techniques have been developed to obtain effective contact energy parameters. Following the hypothetical reaction in Figure 4.1(a), can be directly estimated from Equation 4.20, as was done by Zhang and Kim (Zhang and Kim, 2000). Alternatively, one can follow the hypothetical two-step reaction in Figure 4.1b and estimate each term in Equation 4.17b for by using Equation 4.21. Because the second approach leads to additional insight about the desolvation effects () and the mixing effects () in contact interactions, we follow this approach in subsequent discussions. The first approach will become self-evident after our discussion.
Models of reference state. In reality, the true fraction of contacts of type among all pairwise contacts is unknown. One can approximate this by calculating its mean value from sampled structures in the database. We have:
where and . However, this yields a biased estimation of and . When effective solvent molecules, residues of -th type and residues of -th type are randomly mixed, will not equal to 0 as should be because of differences in amino acid composition among proteins in the database. Therefore, a reference state must be used to remove this bias.
In the work of Miyazawa and Jernigan, the effective contact energies for mixing two types of residues and for solvating a residue are estimated based on two different random mixture reference states (Miyazawa and Jernigan, 1985). In both cases, the contacting pairs in a structure are randomly permuted, but the global conformation is retained. Hence, the total number of residue-residue, residue-solvent, solvent-solvent contacts remain unchanged.
The first random mixture reference state for desolvation contains the same set of residues of the protein and a set of effective solvent molecules. We denote the overall number of contacts in this random mixture state after summing over all proteins as , and , respectively. can be computed as:
| (4.22) |
where Miyazawa and Jernigan assumed that the average coordination number of residue in all proteins is . Therefore, a residue of type makes number of contacts in protein . Similarly, the number of contacts can be computed as:
| (4.23) |
From the horizontal box in Figure 4.1, the effective contact energy can now be computed as:
| (4.24) |
The second random mixture reference state for mixing contains the exact same set of residues as the protein , but have all residues randomly mixed. We denote the number of contacts in this random mixture as . The overall number of contacts in the full protein set is the sum of over all proteins:
| (4.25) |
From the vertical box in Figure 4.1, the effective contact energy can now be computed as:
| (4.26) |
The compositional bias is removed by the denominator in Equation 4.26, and now equals to 0.
| Cys | Met | Phe | Ile | Leu | Val | Trp | Tyr | Ala | Gly | Thr | Ser | Asn | Gln | Asp | Glu | His | Arg | Lys | Pro | |
|---|---|---|---|---|---|---|---|---|---|---|---|---|---|---|---|---|---|---|---|---|
| Cys | -5.44 | -4.99 | -5.80 | -5.50 | -5.83 | -4.96 | -4.95 | -4.16 | -3.57 | -3.16 | -3.11 | -2.86 | -2.59 | -2.85 | -2.41 | -2.27 | -3.60 | -2.57 | -1.95 | -3.07 |
| Met | 0.46 | -5.46 | -6.56 | -6.02 | -6.41 | -5.32 | -5.55 | -4.91 | -3.94 | -3.39 | -3.51 | -3.03 | -2.95 | -3.30 | -2.57 | -2.89 | -3.98 | -3.12 | -2.48 | -3.45 |
| Phe | 0.54 | -0.20 | -7.26 | -6.84 | -7.28 | -6.29 | -6.16 | -5.66 | -4.81 | -4.13 | -4.28 | -4.02 | -3.75 | -4.10 | -3.48 | -3.56 | -4.77 | -3.98 | -3.36 | -4.25 |
| Ile | 0.49 | -0.01 | 0.06 | -6.54 | -7.04 | -6.05 | -5.78 | -5.25 | -4.58 | -3.78 | -4.03 | -3.52 | -3.24 | -3.67 | -3.17 | -3.27 | -4.14 | -3.63 | -3.01 | -3.76 |
| Leu | 0.57 | 0.01 | 0.03 | -0.08 | -7.37 | -6.48 | -6.14 | -5.67 | -4.91 | -4.16 | -4.34 | -3.92 | -3.74 | -4.04 | -3.40 | -3.59 | -4.54 | -4.03 | -3.37 | -4.20 |
| Val | 0.52 | 0.18 | 0.10 | -0.01 | -0.04 | -5.52 | -5.18 | -4.62 | -4.04 | -3.38 | -3.46 | -3.05 | -2.83 | -3.07 | -2.48 | -2.67 | -3.58 | -3.07 | -2.49 | -3.32 |
| Trp | 0.30 | -0.29 | 0.00 | 0.02 | 0.08 | 0.11 | -5.06 | -4.66 | -3.82 | -3.42 | -3.22 | -2.99 | -3.07 | -3.11 | -2.84 | -2.99 | -3.98 | -3.41 | -2.69 | -3.73 |
| Tyr | 0.64 | -0.10 | 0.05 | 0.11 | 0.10 | 0.23 | -0.04 | -4.17 | -3.36 | -3.01 | -3.01 | -2.78 | -2.76 | -2.97 | -2.76 | -2.79 | -3.52 | -3.16 | -2.60 | -3.19 |
| Ala | 0.51 | 0.15 | 0.17 | 0.05 | 0.13 | 0.08 | 0.07 | 0.09 | -2.72 | -2.31 | -2.32 | -2.01 | -1.84 | -1.89 | -1.70 | -1.51 | -2.41 | -1.83 | -1.31 | -2.03 |
| Gly | 0.68 | 0.46 | 0.62 | 0.62 | 0.65 | 0.51 | 0.24 | 0.20 | 0.18 | -2.24 | -2.08 | -1.82 | -1.74 | -1.66 | -1.59 | -1.22 | -2.15 | -1.72 | -1.15 | -1.87 |
| Thr | 0.67 | 0.28 | 0.41 | 0.30 | 0.40 | 0.36 | 0.37 | 0.13 | 0.10 | 0.10 | -2.12 | -1.96 | -1.88 | -1.90 | -1.80 | -1.74 | -2.42 | -1.90 | -1.31 | -1.90 |
| Ser | 0.69 | 0.53 | 0.44 | 0.59 | 0.60 | 0.55 | 0.38 | 0.14 | 0.18 | 0.14 | -0.06 | -1.67 | -1.58 | -1.49 | -1.63 | -1.48 | -2.11 | -1.62 | -1.05 | -1.57 |
| Asn | 0.97 | 0.62 | 0.72 | 0.87 | 0.79 | 0.77 | 0.30 | 0.17 | 0.36 | 0.22 | 0.02 | 0.10 | -1.68 | -1.71 | -1.68 | -1.51 | -2.08 | -1.64 | -1.21 | -1.53 |
| Gln | 0.64 | 0.20 | 0.30 | 0.37 | 0.42 | 0.46 | 0.19 | -0.12 | 0.24 | 0.24 | -0.08 | 0.11 | -0.10 | -1.54 | -1.46 | -1.42 | -1.98 | -1.80 | -1.29 | -1.73 |
| Asp | 0.91 | 0.77 | 0.75 | 0.71 | 0.89 | 0.89 | 0.30 | -0.07 | 0.26 | 0.13 | -0.14 | -0.19 | -0.24 | -0.09 | -1.21 | -1.02 | -2.32 | -2.29 | -1.68 | -1.33 |
| Glu | 0.91 | 0.30 | 0.52 | 0.46 | 0.55 | 0.55 | 0.00 | -0.25 | 0.30 | 0.36 | -0.22 | -0.19 | -0.21 | -0.19 | 0.05 | -0.91 | -2.15 | -2.27 | -1.80 | -1.26 |
| His | 0.65 | 0.28 | 0.39 | 0.66 | 0.67 | 0.70 | 0.08 | 0.09 | 0.47 | 0.50 | 0.16 | 0.26 | 0.29 | 0.31 | -0.19 | -0.16 | -3.05 | -2.16 | -1.35 | -2.25 |
| Arg | 0.93 | 0.38 | 0.42 | 0.41 | 0.43 | 0.47 | -0.11 | -0.30 | 0.30 | 0.18 | -0.07 | -0.01 | -0.02 | -0.26 | -0.91 | -1.04 | 0.14 | -1.55 | -0.59 | -1.70 |
| Lys | 0.83 | 0.31 | 0.33 | 0.32 | 0.37 | 0.33 | -0.10 | -0.46 | 0.11 | 0.03 | -0.19 | -0.15 | -0.30 | -0.46 | -1.01 | -1.28 | 0.23 | 0.24 | -0.12 | -0.97 |
| Pro | 0.53 | 0.16 | 0.25 | 0.39 | 0.35 | 0.31 | -0.33 | -0.23 | 0.20 | 0.13 | 0.04 | 0.14 | 0.18 | -0.08 | 0.14 | 0.07 | 0.15 | -0.05 | -0.04 | -1.75 |
Although can be estimated from Equation (4.21b) by assuming that in a reference state, Zhang and DeLisi (1997) simplified the Miyazawa-Jernigan process by further assuming that the number of solvent-solvent contacts in both reference states is the same as in the native state (Zhang et al., 1997):
| (4.27) |
Therefore, and are canceled out in Equation 4.24 and not needed for calculating . This treatment systematically subtracts a constant scaling energy from all effective energies , and should produce exactly the same relative energy values for protein conformations as Miyazawa-Jernigan’s original work, with the difference of a constant offset value. In fact, Miyazawa and Jernigan (1996) showed that this constant scaling energy is the effective contact energy between the average residue of the 20 residue types, and suggested that being used to measure the stability of a protein structure (Miyazawa and Jernigan, 1996).
Hydrophobic nature of Miyazawa-Jernigan contact potential. In the relation of Equation 4.17b, , the Miyazawa-Jernigan effective contact energy is composed of two types of terms: the desolvation terms and and the mixing term . The desolvation term of residue type , that is, or (Figure 4.1), is the energy change due to the desolvation of residue , the formation of the - self-pair, and the solvent-solvent pair. The value of this term should correlate well with the hydrophobicity of residue type (Miyazawa and Jernigan, 1985; Li et al., 1997), although for charged amino acids this term also incorporates unfavorable electrostatic potentials of self-pairing. The mixing term is the energy change accompanying the mixing of two different types of amino acids of and to form a contact pair - after breaking self-pairs - and -. Its value measures the tendency of different residues to mix together. For example, the mixing between two residues with opposite charges are more favorable than mixing between other types of residues, because of the favorable electrostatic interactions.
Important insights into the nature of residue-residue contact interactions can also be obtained by a quantitative analysis of the desolvation terms and the mixing terms. Among different types of contacts, the average difference of the desolvation terms is 9 times larger than that of the mixing terms (see Table 4.1 taken from (Miyazawa and Jernigan, 1996)). Thus, a comparison of the values of and clearly shows that the desolvation term plays the dominant role in determining the energy difference among different conformations.
Similar conclusion can be drawn by an eigenvalue decomposition analysis of the Miyazawa-Jernigan matrix , which is made up of values alone, without the knowledge of the mixing terms (Li et al., 1997). The matrix is a real symmetric matrix, and thus can be reconstructed based on the following spectral decomposition:
| (4.28) |
where and is the -th largest eigenvalue and the corresponding eigenvector, respectively; is the -th component of the -th eigenvector. Li et al. (1997) found that there are two dominant eigenvalues and , and the corresponding two eigenvectors are strongly correlated after a shift and a rescaling operation, i.e., . Here, is the vector with each component equals to 1 and and are scalars. Therefore, can be well-approximated with only one eigenvector corresponding to the largest eigenvalue . For each entry of the matrix , we have the following approximation:
| (4.29) |
where , and and are constants. To better understand the underlying physical implications, Equation 4.29 can be rewritten into the following form:
| (4.30) |
where
Here is a single-body term and are interpreted as the desolvation term in (Li et al., 1997); is a two-body term and are interpreted as the mixing term and the magnitude of the mixing term is significantly smaller than that of . This result is not surprising and is consistent with the original model of Miyazawa-Jernigan contact matrix , where .
To summarize, the quantitative analysis of Miyazawa-Jernigan contact energies reveals that hydrophobic effect is the dominant driving force for protein folding. To a large extent, this conclusion justifies the HP model proposed by Chan and Dill (1990) where only hydrophobic interactions are included in studies of simple models of protein folding (Chan and Dill, 1990).
4.3.4 Distance dependent potential function
In the Miyazawa-Jernigan potential function, interactions between amino acids are assumed to be short-ranged and a distance cutoff is used to define the occurrence of a contact. This type of statistical potential is referred to as the “contact potential”. Another type of statistical potential allows modeling of residue interactions that are distance-dependent. The distance of interactions are usually divided into a number of small intervals or bins, and the potential functions are derived by applying Equation 4.9 for individual distance intervals.
Formulation of distance-dependent potential functions. In distance-dependent statistical potential functions, Equation 4.9 can be written in several forms. To follow the conventional notations, we use to represent the -th protein descriptor for pairwise interactions between residue type and residue type . From Equation 4.9, we have:
| (4.31a) | |||
| where represents an interaction between a specific residue pair at distance , is the the contribution from the type of residue pairs at distance , and are the observed and expected probabilities of this distance-dependent interaction, respectively, the observed number of interactions, the observed total number of all pairwise interactions in a database, the expected number of interactions when the total number of all pairwise interactions in reference state is set to be . | |||
Since the expected joint probability for the reference is not easy to estimate, Sippl (1990) replaces Equation 4.9 with:
| (4.31b) |
where and are the observed and expected probability of interaction of residue pairs given the distance interval , respectively; is the observed total number of all pairwise interactions at the distance ; is the expected number of interactions at when the total number of all pairwise interactions at this distance in the reference state is set to . There are several variations of potential function of this form, including the “Knowledge-Based Potential function” (KBP) by Lu and Skolnick (2001) (Lu and Skolnick, 2001).
In the work of developing the “Residue-specific All-atom Probability Discriminatory Function” (RAPDF) (Samudrala and Moult, 1998), Samudrala and Moult (1998) alternatively replaced Equation 4.9 with:
| (4.31c) |
where and are the observed and expected probability of interaction at the distance for a given pair of residues , respectively; is the observed total number of interactions for pairs regardless of the distance. is the expected number of interactions at distance when the total number of interactions in the reference state is set to .
The knowledge-based potential functions of Equation 4.31a, 4.31b, and 4.31c can all be written using the unifying formula based on the number counts of interactions:
| (4.32) |
Clearly, the different ways of assigning make the potential functions differ from each other substantially, since the method to calculate is essentially the same for many potential functions. In other words, the model of reference state used to compute is critical for distance-dependent energy functions.
Different models of reference states. Sippl (1990) first proposed the “uniform density” model of reference state, where the probability density function for a pair of contacting residues is uniformly distributed along the distance vector connecting them: (Sippl, 1990). Lu and Skolnick made use of this type of reference state to calculate the expected number of interactions at distance as (Lu and Skolnick, 2001):
The expected probability is estimated using the random mixture approximation as:
where and are the mole fractions of residue type and , respectively.
Samudrala and Moult (1998) made use of another type of reference state, where the probability of the distance between a pair of residues being is independent of the contact types (Samudrala and Moult, 1998):
The expected number of interactions at distance in Equation 4.31c becomes:
where is estimated from :
Ideal gas reference state. In the uniform density model of Sippl, the same density of a particular residue pair along a line could result from very different volume distribution of pairs in specific regions of the protein. For example, one spherical shell proximal to the molecular center could be sparsely populated with residues, and another distant shell could be densely populated, but all may have the same density of pairs along the same radial vector. Zhou and Zhou (2002) developed a new reference state (called Dfire for “Distance-scaled, Finite Ideal-gas REference state”) where residues follow uniform distribution everywhere in the protein (Zhou and Zhou, 2002). Assuming that residues can be modeled as noninteracting points (i.e., as ideal gas molecules), the distribution of interacting pairs should follow the uniform distribution not only along any vector lines, but also in the whole volume of the protein.
When the distance between a pair of residues is at a threshold distance , the interaction energy between them can be considered to be 0. Therefore, residue type and type form pairs at the distance purely by random, and the observed number of pairs at the distance can be considered the same as the expected number of pairs at the distance in the reference state. Denote as the volume of a spherical shell of width at a distance from the center. The expected number of interactions at the distance after volume correction is:
For a protein molecule, will not increase as because of its finite size. In addition, it is well-known that the volume of protein molecule cannot be treated as a solid body, as there are numerous voids and pockets in the interior. This implies that the number density for a very large molecule will also not scale as (Liang and Dill, 2001). Zhou and Zhou (2002) assumed that increase in rather than , where the exponent needs to be determined. To estimate the value, each protein in the database is reshaped into a ball of radius , where is the radius of gyration of the protein , and residues are distributed uniformly in this reshaped ball. Here takes the value so that in the reshaped molecule, the number of total interacting pairs at distance is about the same as that observed in the native protein , namely:
for protein . Once the value of is determined and hence the effective radius for each native protein is known, the number of interacting pairs at distance can be counted directly from the reshaped ball. Zhou and Zhou further defined a reduced distance-dependent function and the relative fluctuation of :
where , and is the total number of distance shells, all of which has the same thickness. is then estimated by minimizing the relative fluctuation . The rationale is that since idealized residues are points and are uniformly distributed in the reshaped ball, should be . In their study, was found to be (Zhou and Zhou, 2002).
4.3.5 Geometric potential functions.
The effectiveness of potential function also depends on the representation of protein structures. Another class of knowledge-based statistical potentials is based on the computation of various geometric constructs that reflect the shape of the protein molecules more accurately. These geometric constructs include the Voronoi diagram (McConkey et al., 2003), the Delaunay triangulation (Singh et al., 1996a; Zheng et al., 1997a; Carter Jr. et al., 2001; Krishnamoorthy and Tropsha, 2003), and the alpha shape (Li et al., 2003; Li and Liang, 2005b, a) of the protein molecules. Geometric potential functions has achieved significant successes in many fields. For example, the potential function developed by McConkey et al. is based on the Voronoi diagram of the atomic structures of proteins, and is among one of the best performing atom-level potential functions in decoy discrimination (McConkey et al., 2003). Because the alpha shape of the molecule contains rich topological, combinatorial, and metric information, and has a strong theoretical foundation, we discuss the alpha potential functions in more detail below as an example of this class of potential function.
Geometric model. In Miyazawa-Jernigan and other contact potential functions, pairwise contact interactions are declared if two residues or atoms are within a specific cut-off distance. Contacts by distance cut-off can potentially include many implausible non-contacting neighbors, which have no significant physical interaction (Bienkowska et al., 1999). Whether or not a pair of residues can make physical contact depends not only on the distance between their center positions (such as Cα or Cβ, or geometric centers of side chain), but also on the size and the orientations of side-chains (Bienkowska et al., 1999). Furthermore, two atoms close to each other may in fact be shielded from contact by other atoms. By occupying the intervening space, other residues can block a pair of residues from direct interacting with each other. Inclusion of these fictitious contact interactions would be undesirable.
The alpha potential solves this problem by identifying interacting residue pairs following the edges computed in the alpha shape. Details of alpha shape can be found in the Chapter “Protein structure geometry”. When the parameter is set to be 0, residue contact occurs if residues or atoms from non-bonded residues share a Voronoi edge, and this edge is at least partially contained in the body of the molecule. Figure 4.2 illustrates the basic ideas.
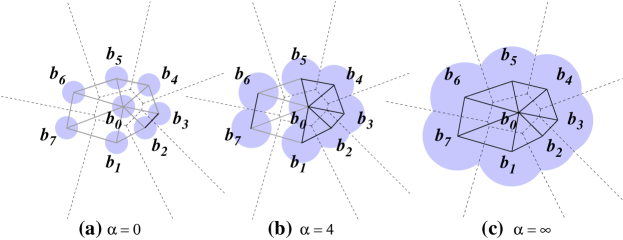
Distance and packing dependent alpha potential. For two non-bonded residue balls of radius with its center located at and of radius at , they form an alpha contact if their Voronoi regions intersect and these residue balls also intersect after their radii are inflated to and , respectively. That is, the alpha contact exists when:
We further define the 1-star for each residue ball as: , namely, the set of 1-simplices with as a vertex. The near neighbors of are derived from and are defined as:
and the degree of near neighbors of residue is defined as the size of this set of residues:
The degree of near neighbors is a parameter related to the local packing density and hence indirectly the solvent accessibility around the residue ball (Figure 4.2b). A large value indicates high local packing density and less solvent accessibility, and a small value indicates low local packing density and high solvent accessibility. Similarly, the degree of near neighbors for a pair of residues is defined as:
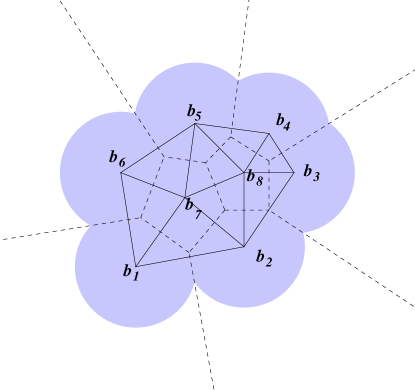
Reference state and collection of non-interacting pairs. We denote the shortest path length between residue and residue as , which is the fewest number of alpha edges ( that connects and . The reference state of the alpha potential is based on the collection of all non-interacting residue pairs :
Any pair in this reference state is intercepted by two residues (Figure 4.3). We assume that there is no attractive or repulsive interactions between them, because of the shielding effect by the two intervening residues. Namely, residue and residue form a pair only by random chance, and any properties associated with , such as packing density, side-chain orientation, are independent of the same properties associated with .
Statistical model: pairwise potential and desolvation potential. According to Equation (4.9, the packing and distance-dependent statistical potential of residue pair at the packing environment and the distance specified by is:
| (4.33) |
Here, is the observed probability:
| (4.34) |
where is the number of residue pair at the packing environment and the distance specified by , and is the total number of residue pairs at the distance specified by . is the expected probability:
| (4.35) |
where is the number of residue pair at the packing environment in reference state, and is the total number of non-interacting residue pairs at the reference state.
The desolvation potential of residue type to have near neighbors is estimated simply by following Equation (4.9,:
| (4.36) |
where represent all 20 residue types.
For a protein structure, the total internal energy is estimated by the summation of the desolvation energy and pairwise interaction energy in the particular desolvated environment:
| (4.37) |
4.3.6 Sampling weight of proteins in database
When developing statistical energy functions using a database consisting of many homologous sequences, undesirable sampling biases will be introduced. An easy way to avoid such sampling bias is to construct a database of structures in which no pair of proteins can have more than 25% sequence identity. By this criterion, a structure database may exclude a significant number of informative structures, which may be valuable for studying a specific type of proteins with very few known structures. An alternative method to avoid such sampling bias without neglecting these structures is to introduce weights that are properly adjusted for each structure, which may or may not be homologous to other structures in the database.
A similarity matrix of all proteins in the database can be used to decide the weight for each protein structure (Miyazawa and Jernigan, 1996). The similarity between the -th and -th proteins is defined by Miyazawa and Jernigan based on the result of sequence alignment:
where is the number of identical residues in the alignment, and are the lengths of sequences and , respectively. This similarity matrix is symmetric and composed of real values. It has the spectral decomposition:
| (4.38) |
where and are the -th eigenvalue and eigenvector of , respectively. For symmetric matrix, these eigenvectors form an orthonormal base. Because for the symmetric matrix , Trace() = and is positive semi-definite, we have:
| (4.39) |
where is the number of proteins included in the database. The value of reflects the weight of the corresponding orthogonal eigenvector to the matrix . For the special case where there one distinct sequence, which is completely dissimilar to any other sequences in the database, at least one eigenvalues will be exactly equal to and the corresponding eigenvector represents this distinct sequence but contains no information about other sequences due to the orthogonality of the eigenvectors of matrix . In another case when there is one set of sequences which are exactly the same within the group but are completely dissimilar to any other sequences outside this set, at least one eigenvalue will be exactly equal to and eigenvalues will be equal to zero. The eigenvector corresponding to the non-zero eigenvalue represents the whole group of those sequences but contains no information about other sequences.
On the basis of these characteristics, Miyazawa and Jernigan (1996) decreased all eigenvalues 1 to 1 to reconstruct a new weight matrix , so that redundant information from similar sequences are removed and the weight for the th protein in the database is determined. In another word, we have before weighting:
| (4.40) |
after weighting,
| (4.41) |
where
Therefore, if and only if a sequence is completely dissimilar to any other sequences (), the sampling weight for that sequence will be . If all sequences in the database are identical, the sampling weights for these sequences will be . Generally, sampling weights take a value between one and , and are about negatively proportional to the number of similar sequences.
4.4 Optimization method
There are several drawbacks of knowledge-based potential function derived from statistical analysis of database. These include the neglect of chain connectivity in the reference state, and the problematic implicit assumption of Boltzmann distribution (Thomas and Dill, 1996b, a; Ben-Naim, 1997b). We defer a detailed discussion to Section 4.7.1.
An alternative method to develop potential functions for proteins is by optimization. For example, in protein design, we can use the thermodynamic hypothesis of Anfinsen to require that the native amino acid sequence mounted on the native structure has the best (lowest) fitness score compared to a set of alternative sequences (sequence decoys) taken from unrelated proteins known to fold into a different fold when mounted on the same native protein structure :
Equivalently, the native sequence will have the highest probability to fit into the specified native structure. This is the same principle described in (Shakhnovich and Gutin, 1993; Deutsch and Kurosky, 1996; Li et al., 1996). Sometimes we can further require that the score difference must be greater than a constant (Shakhnovich, 1994):
Similarly, for protein structure prediction and protein folding, we require that the native amino acid sequence mounted on the native structure has the lowest energy compared to a set of alternative conformations (decoys) :
and
when we insist to maintain an energy gap between the native structure and decoy conformations. For linear potential function, we have:
| (4.42) |
Our goal is to find a set of parameters through optimization for the potential function such that all these inequalities are satisfied.
As discussed earlier, there are three key steps in developing effective knowledge-based scoring function using optimization: (1) the functional form, (2) the generation of a large set of decoys for discrimination, and (3) the optimization techniques. The initial step of choosing an appropriate functional form is important. Knowledge-Based pairwise potential functions are usually all in the form of weighted linear sum of interacting residue pairs. In this functional form, the weight coefficients are the parameters of the potential function, which are optimized for discrimination. This is the same functional form used in statistical potential, where the weight coefficients are derived from database statistics. The objectives of optimization are often maximization of energy gap between native protein and the average of decoys, or energy gap between native and decoys with lowest score, or the -score of the native protein (Goldstein et al., 1992; Maiorov and Crippen, 1992; Thomas and Dill, 1996a; Koretke et al., 1996; Hao and Scheraga, 1996; Mirny and Shakhnovich, 1996; Vendruscolo and Domanyi, 1998; Koretke et al., 1998; Tobi et al., 2000a; Vendruscolo et al., 2000a; Dima et al., 2000; Micheletti et al., 2001; Bastolla et al., 2001).
4.4.1 Geometric nature of discrimination
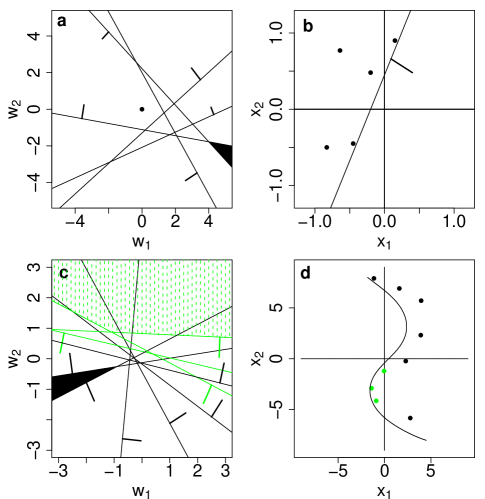
There is a natural geometric view of the inequality requirement for weighted linear sum scoring functions. A useful observation is that each of the inequalities divides the space of into two halves separated by a hyperplane (Figure 4.4a). The hyperplane for Equation 4.42 is defined by the normal vector and its distance from the origin. The weight vector must be located in the half-space opposite to the direction of the normal vector . This half-space can be written as . When there are many inequalities to be satisfied simultaneously, the intersection of the half-spaces forms a convex polyhedron (Edelsbrunner, 1987). If the weight vector is located in the polyhedron, all the inequalities are satisfied. Scoring functions with such weight vector can discriminate the native protein sequence from the set of all decoys. This is illustrated in Figure 4.4a for a two-dimensional toy example, where each straight line represents an inequality that the scoring function must satisfy.
For each native protein , there is one convex polyhedron formed by the set of inequalities associated with its decoys. If a scoring function can discriminate simultaneously native proteins from a union of sets of sequence decoys, the weight vector must be located in a smaller convex polyhedron that is the intersection of the convex polyhedra:
There is yet another geometric view of the same inequality requirements. If we now regard as a point in , the relationship for all sequence decoys and native proteins requires that all points are located on one side of a different hyperplane, which is defined by its normal vector and its distance to the origin (Figure 4.4b). We can show that such a hyperplane exists if the origin is not contained within the convex hull of the set of points (see Appendix).
The second geometric view looks very different from the first view. However, the second view is dual and mathematically equivalent to the first geometric view. In the first view, a point determined by the structure-decoy pair and corresponds to a hyperplane representing an inequality, a solution weight vector corresponds to a point located in the final convex polyhedron. In the second view, each structure-decoy pair is represented as a point in , and the solution weight vector is represented by a hyperplane separating all the points from the origin.
4.4.2 Optimal linear potential function
Several optimization methods have been applied to find the weight vector of linear scoring function. The Rosenblantt perceptron method works by iteratively updating an initial weight vector (Vendruscolo and Domanyi, 1998; Micheletti et al., 2001). Starting with a random vector, e.g., , one tests each native protein and its decoy structure. Whenever the relationship is violated, one updates by adding to it a scaled violating vector . The final weight vector is therefore a linear combination of protein and decoy count vectors:
| (4.43) |
Here is the set of native proteins, and is the set of decoys. The set of coefficients gives a dual form representation of the weight vector , which is an expansion of the training examples including both native and decoy structures.
According to the first geometric view, if the final convex polyhedron is non-empty, there can be infinite number of choices of , all with perfect discrimination. But how do we find a weight vector that is optimal? This depends on the criterion for optimality. For example, one can choose the weight vector that minimizes the variance of score gaps between decoys and natives:
as used in reference (Tobi et al., 2000a), or minimizing the -score of a large set of native proteins, or minimizing the -score of the native protein and an ensemble of decoys (Chiu and Goldstein, 1998; Mirny and Shakhnovich, 1996), or maximizing the ratio between the width of the distribution of the score and the average score difference between the native state and the unfolded ones (Goldstein et al., 1992; Hao and Scheraga, 1999a). A series of important works using perceptron learning and other optimization techniques (Friedrichs and Wolynes, 1989; Goldstein et al., 1992; Tobi et al., 2000a; Vendruscolo and Domanyi, 1998; Dima et al., 2000) showed that effective linear sum scoring functions can be obtained.
There is another optimality criterion according to the second geometric view (Hu et al., 2004). We can choose the hyperplane that separates the set of points with the largest distance to the origin. Intuitively, we want to characterize proteins with a region defined by the training set points . It is desirable to define this region such that a new unseen point drawn from the same protein distribution as will have a high probability to fall within the defined region. Non-protein points following a different distribution, which is assumed to be centered around the origin when no a priori information is available, will have a high probability to fall outside the defined region. In this case, we are more interested in modeling the region or support of the distribution of protein data, rather than estimating its density distribution function. For linear scoring function, regions are half-spaces defined by hyperplanes, and the optimal hyperplane is then the one with maximal distance to the origin. This is related to the novelty detection problem and single-class support vector machine studied in statistical learning theory (Vapnik and Chervonenkis, 1964, 1974; Schölkopf and Smola, 2002). In our case, any non-protein points will need to be detected as outliers from the protein distribution characterized by . Among all linear functions derived from the same set of native proteins and decoys, an optimal weight vector is likely to have the least amount of mis-labellings. The optimal weight vector can be found by solving the following quadratic programming problem:
| Minimize | (4.44) | ||||
| subject to | (4.45) |
The solution maximizes the distance of the plane to the origin. We obtained the solution by solving the following support vector machine problem:
| (4.46) |
where . Note that a solution of Problem (4.46) satisfies the constraints in Inequalities (4.45), since subtracting the second inequality here from the first inequality in the constraint conditions of (4.46) will give us .
4.4.3 Optimal nonlinear potential function
Optimal linear potential function can be obtained using the optimization strategy discussed above. However, it is possible that the weight vector does not exist, i.e., the final convex polyhedron may be an empty set. This occurs if a large number of native protein structures are to be simultaneously stabilized against a large number of decoy conformations, no such potential functions in the linear functional form can be found (Vendruscolo et al., 2000a; Tobi et al., 2000a).
According to our geometric pictures, there are two possible scenarios. First, for a specific native protein , there may be severe restriction from some inequality constraints, which makes an empty set. Some decoys are very difficult to discriminate due to perhaps deficiency in protein representation. In these cases, it is impossible to adjust the weight vector so the native protein has a lower score than the sequence decoy. Figure 4.4c shows a set of inequalities represented by straight lines according to the first geometric view. In this case, there is no weight vector that can satisfy all these inequality requirements. That is, no linear scoring function can classify all decoys from native protein. According to the second geometric view (Figure 4.4d), no hyperplane can separate all points (black and green) from the origin, which corresponds to the native structures.
Second, even if a weight vector can be found for each native protein, i.e., is contained in a nonempty polyhedron, it is still possible that the intersection of polyhedra is an empty set, i.e., no weight vector can be found that can discriminate all native proteins against the decoys simultaneously. Computationally, the question whether a solution weight vector exists can be answered unambiguously in polynomial time (Karmarkar, 1984). If a large number (e.g., hundreds) of native protein structures are to be simultaneously stabilized against a large number of decoy conformations (e.g., tens of millions), no such potential functions can be found computationally (Vendruscolo et al., 2000a; Tobi et al., 2000a). Similar conclusion is drawn in a study for protein design, where it was found that no linear potential function can simultaneously discriminate a large number of native proteins from sequence decoys (Hu et al., 2004).
A fundamental reason for such failure is that the functional form of linear sum is too simplistic. It has been suggested that additional descriptors of protein structures such as higher order interactions (e.g., three-body or four-body contacts) should be incorporated in protein description (Betancourt and Thirumalai, 1999; Munson and Singh, 1997; Zheng et al., 1997b). Functions with polynomial terms using up to 6 degree of Chebyshev expansion has also been used to represent pairwise interactions in protein folding (Fain et al., 2002).
We now discuss an alternative approach. Let us still limit ourselves to pairwise contact interactions, although it can be naturally extended to include three or four body interactions (Li and Liang, 2005b). We can introduce a nonlinear scoring function analogous to the dual form of the linear function in Equation (4.43), which takes the following form:
| (4.47) |
where and are parameters of the scoring function to be determined, and from the set of decoys is the contact vector of a sequence decoy mounted on a native protein structure , and from the set of native training proteins is the contact vector of a native sequence mounted on its native structure . In this study, all decoy sequence are taken from real proteins possessing different fold structures. The difference of this functional form from linear function in Equation (4.43) is that a kernel function replaces the linear term. A convenient kernel function is:
where is a constant. Intuitively, the surface of the scoring function has smooth Gaussian hills of height centered on the location of decoy protein , and has smooth Gaussian cones of depth centered on the location of native structures . Ideally, the value of the scoring function will be for contact vectors of native proteins, and will be for contact vectors of decoys.
4.4.4 Deriving optimal nonlinear scoring function.
To obtain the nonlinear scoring function, our goal is to find a set of parameters such that has value close to for native proteins, and the decoys have values close to . There are many different choices of . We use an optimality criterion originally developed in statistical learning theory (Vapnik, 1995; Burges, 1998; Schölkopf and Smola, 2002). First, we note that we have implicitly mapped each structure and decoy from through the kernel function of to another space with dimension as high as tens of millions. Second, we then find the hyperplane of the largest margin distance separating proteins and decoys in the space transformed by the nonlinear kernel. That is, we search for a hyperplane with equal and maximal distance to the closest native proteins and the closest decoys in the transformed high dimensional space. Such a hyperplane can be found by obtaining the parameters and from solving the following Lagrange dual form of quadratic programming problem:
| Maximize | ||||
| subject to |
where is a regularizing constant that limits the influence of each misclassified protein or decoy (Vapnik and Chervonenkis, 1964, 1974; Vapnik, 1995; Burges, 1998; Schölkopf and Smola, 2002), and if is a native protein, and if is a decoy. These parameters lead to optimal discrimination of an unseen test set (Vapnik and Chervonenkis, 1964, 1974; Vapnik, 1995; Burges, 1998; Schölkopf and Smola, 2002). When projected back to the space of , this hyperplane becomes a nonlinear surface. For the toy problem of Figure 4.4, Figure 4.4d shows that such a hyperplane becomes a nonlinear curve in formed by a mixture of Gaussian kernels. It separates perfectly all vectors (black and green) from the origin. That is, a nonlinear scoring function can have perfect discrimination.
4.4.5 Optimization techniques.
The techniques that have been used for optimizing potential function include perceptron learning, linear programming, gradient descent, statistical analysis, and support vector machine (Tobi et al., 2000a; Vendruscolo et al., 2000a; Xia and Levitt, 2000; Bastolla et al., 2000, 2001; Hu et al., 2004). These are standard techniques that can be found in optimization and machine learning literature. For example, there are excellent linear programming solvers based on simplex method, as implemented in Clp, Glpk, and lp_solve (Berkelaar, 2004), and based on interior point method as implemented in the Bpmd (Mészáros, 1996), the Hopdm and the PCx packages (Czyzyk et al., 2004). We neglect the details of these techniques and point readers to the excellent treatises of (Papadimitriou and Steiglitz, 1998; Vanderbei, 1996).
4.5 Applications
Knowledge-Based potential function has been widely used in the study of protein structure prediction, protein folding, and protein-protein interaction. In this section, we discuss briefly some of these applications. Additional details of applications of knowledge-based potential can be found in other chapters of this book.

4.5.1 Protein structure prediction
Protein structure prediction is an extraordinarily complex task that involves two major components: sampling the conformational space and recognizing the near native structures from the ensemble of sampled conformations.
In protein structure prediction, methods for conformational sampling will generate a huge number of candidate protein structures. These are often called decoys. Among these decoys, only a few are near native structures that are very similar to the native structure. An knowledge-based potential function must be used to discriminate the near native structures from all other decoys for a successful structure prediction.
Several decoy sets have been developed which are used as objective benchmarks to test if an knowledge-based potential function can successfully identify the native and near native structures. For example, Park and Levitt (1996) constructed a 4-state-reduced decoy set. This decoy test set contains native and near-native conformations of seven sequences, along with about 650 misfolded structures for each sequence. The positions of of these decoys were generated by exhaustively enumerating ten selectively chosen residues in each protein using a 4-state off-lattice model. All other residues were assigned the phi/psi value based on the best fit of a 4-state model to the native chain (Park and Levitt, 1996).
A central depository of folding decoy conformations is the Decoys R’Us (Samudrala and Levitt, 2000). See Section 4.6 for the url links to download several folding and docking decoy sets. A variety of knowledge-based potential functions have been developed and their performance in decoy discrimination have steadily improved (Zhou and Zhou, 2002; Lu and Skolnick, 2001; Li et al., 2003).
Figure 4.5 shows an example of decoy discrimination on the 4-state-reduced decoy set. This result is based on the residue-level packing and distance-dependent alpha potential discussed earlier. For all of the seven proteins in the 4-state-reduced set, the native structures have the lowest energy. In addition, all of the decoys with the lowest energy are within 2.5 RMSD to the native structure.
Table 4.5.1 lists the performance of the geometric potential function in folding and docking decoy discriminations. Several studies examine the comparative performance of different knowledge-based potential functions (Park and Levitt, 1996; Zhou and Zhou, 2002; Gilis, 2004). Such evaluations often are based on measuring the success in ranking native structure from a large set of decoy conformations and in obtaining a large -score) for the native protein structure. Because the development of potential function is a very active research field, the comparison of performances of different potential functions will be different as new models and techniques are developed and incorporated.
| Folding decoy sets | 4-state-reduced | lattice-ssfit | fisa-casp3 | fisa | lmds | |||||||||
|---|---|---|---|---|---|---|---|---|---|---|---|---|---|---|
| Nativea | Native | Native | Native | Native | ||||||||||
| 7/7 | 4.46 | 8/8 | 7.70 | 3/3 | 5.23 | 3/4 | 5.42 | 7/10 | 1.45 | |||||
| Docking decoy sets | Rosetta-Bound-Perturb | Rosetta-Unbound-Perturb | Rosetta-Unbound-Global | Vakser’s | Sternberg’s | |||||||||
| Native | Native | Native | Native | Native | ||||||||||
| 50/54 | 12.75 | 53/54 | 12.88 | 53/54 | 8.55 | 4/5 | 4.45 | 16/16 | 4.45 | |||||
| RDOCK | 29/42c | |||||||||||||
| a Number of native structures ranking first. eg. means seven out of seven native structures have the lowest energy among their corresponding decoy sets. | ||||||||||||||
| b: ; and are the mean and standard deviation of the energy values of conformations, respectively. | ||||||||||||||
| c: Native complex is not included in this docking decoy sets. 32 out of 42 decoy sets have at least one near native structures (cRMSD ) in the top 10 structures. | ||||||||||||||
Knowledge-based potential function can not only be applied at the end of the conformation sampling to recognize near native structures, it can also be used during conformation generation to guide the efficient sampling of protein structures. Details of this application can be found in (Jernigan and Bahar, 1996; Hao and Scheraga, 1999b). In addition, knowledge-based potential also plays important role in protein threading studies. Chapter 13 provides further detailed discussion.
4.5.2 Protein-protein docking prediction
Knowledge-Based potential function can also be used to study protein-protein interactions. Here we give an example of predicting the binding surface of seven antibody or antibody related proteins (e.g., Fab fragment, T-cell receptor) (Li and Liang, 2005a). These protein-protein complexes are taken from the 21 Capri (Critical Assessment of PRedicted Interactions) target proteins. Capri is a community-wide competition designed to objectively assess the abilities in protein-protein docking prediction (Méndez et al., 2005). In Capri, a blind docking prediction starts from two known crystallographic or NMR structures of unbound proteins and ends with a comparison to a solved structure of the protein complex, to which the participants did not have access. Knowledge-Based potential functions, together with geometric complementarity scoring functions, can be used to recognize near native docking complexes and to guide the generation of conformations for protein-protein docking.
When docking two proteins together, we say a cargo protein is docked to a fixed seat protein. To determine the binding surfaces on the cargo protein, we can examine all possible surface patches on the unbound structure of cargo protein as candidate binding interfaces. The alpha knowledge-based potential function is then used to identify native or near native binding surfaces. To evaluate the performance of the potential function, we assume the knowledge of the binding interface on the seat protein. We further assume the knowledge of the degree of near neighbors for interface residues.
We first partition the surface of the unbound cargo protein into candidate surface patches, each has the same size as the native binding surface of residues. A candidate surface patch is generated by starting from a surface residue on the cargo protein, and following alpha edges on the boundary of the alpha shape by breadth-first search, until residues are found (Figure 4.6a). We construct candidate surface patches by starting in turn from each of the surface residue on the cargo protein. Because each surface residue is the center of one of the candidate surface patch, the set of candidate surface patches cover exhaustively the whole protein binding interface.
| Antibodya | Antigen | |||||
| Target | Complex | Rank | Overlapc | Ranknative | Overlap | |
| T02 | Rotavirus VP6-Fab | 1/283d | 0.71 | 1/639 | 0.68 | |
| T03 | Flu hemagglutinin-Fab | 1/297 | 0.56 | 1/834 | 0.71 | |
| T04 | -amylase-camelid Ab VH 1 | 56/89 | 0.60 | 102/261 | 0.03 | |
| T05 | -amylase-camelid Ab VH 2 | 23/90 | 0.57 | 57/263 | 0.25 | |
| T06 | -amylase-camelid Ab VH 3 | 1/88 | 0.70 | 1/263 | 0.62 | |
| T07 | SpeA superantigen TCR | 1/172 | 0.57 | 1/143 | 0.61 | |
| T13 | SAG1-antibody complex | 1/286 | 0.64 | 1/249 | 0.69 | |
| a “Antibody”: Different surface patches on the antibody molecule are evaluated by the | ||||||
| scoring function, while the native binding surface on the antigen remains unchanged. | ||||||
| “Antigen”: similarly defined as “Antibody”. | ||||||
| b Ranking of the native binding surface among all candidate surface patches. | ||||||
| c Fraction of residues from the best candidate surface patch that overlap with residues | ||||||
| from the native binding surface patch. | ||||||
| d The first number is the rank of native binding surface and the second number is the | ||||||
| number of total candidate surface patches. | ||||||
Second, we assume that a candidate surface patch on the cargo protein has the same set of contacts as that of the native binding surface. The degree of near neighbors for each hypothetical contacting residue pair is also assumed to be the same. We replace the residues of the native surface with the residues from the candidate surface patch. There are different ways to permute the residues of the candidate surface patch, where is the number of residue type on the candidate surface patch. A typical candidate surface patch has about 20 residues, therefore the number of possible permutation is very large. For each candidate surface patch, we take a sample of 5,000 random permutations. For a candidate surface patch , we assume that the residues can be organized so that they can interact with the binding partner at the lowest energy. Therefore, the binding energy is estimated as: E(SP_i) = min_k E(SP_i)_k, k = 1, ⋯, 5,000. Here is calculated based on the residue-level packing and distance-dependent potential for the -th permutation. The value of is used to rank the candidate surface patches.
We assess the statistical potential by taking antibody/antigen protein in turn as the seat protein, and the antigen/antibody as cargo protein. The native interface on the seat protein is fixed. We test if our statistical potential can discriminate native surface patch on the cargo protein from the set of candidate surface patches. We also test if the best scored patch resembles the native patch. The results are listed in Table 4.3 and the predicted antigen-binding interface of target T02 is shown in Figure 4.6(b) as an example. For five out of the seven protein complexes, we succeeded in discriminating the native patches on both the antibody and the antigen. Over 50% of the residues from the best scored patch overlaps with corresponding native patch. Our statistical potential does not work as well for the target T04 and T05, because the antibodies of these two complexes do not use their CDR domains to recognize the antigens as an antibody usually does, and such examples are not present in the dataset of the 34 antibody-antigen complexes, based on which the alpha potential function was obtained.
4.5.3 Protein design
Protein design aims to identify sequences compatible with a given protein fold but incompatible to any alternative folds (Koehl and Levitt, 1999a, b). The goal is to design a novel protein that may not exist in nature but has enhanced or novel biological function. Several novel proteins have been successfully designed in recent years (Dahiyat and Mayo, 1997; Hill et al., 2000; Looger et al., 2003; Kuhlman et al., 2003). The problem of protein design is complex, because even a small protein of just 50 residues can have an astronomical number of sequences () This clearly precludes exhaustive search of the sequence space with any computational or experimental method. Instead, protein design methods rely on potential functions for biasing the search towards the feasible regions that encode protein sequences. To select the correct sequences and to guide the search process, a design potential function is critically important. Such a scoring function should be able to characterize the global fitness landscape of many proteins simultaneously.
Here, we briefly describe the application of optimal nonlinear design potential function discussed in Section 4.4.3 (Hu et al., 2004) in protein design. We aim to solve a simplified protein sequence design problem. Our goal is to distinguish each native sequence for a major portion of representative protein structures from a large number of alternative decoy sequences, each a fragment from proteins of different fold.
To train the nonlinear potential function, a list of 440 proteins was compiled from the 1998 release (Whatif98) of the Whatif database (Vendruscolo et al., 2000a). Using gapless threading (Maiorov and Crippen, 1992), a set of 14,080,766 sequence decoys was obtained. The entries in Whatif99 database that are not present in Whatif98 are used as a test set. After clean-up, the test set consists of 194 proteins and 3,096,019 sequence decoys.
To test the design scoring functions for discriminating native proteins from sequence decoys, we take the sequence from the conformation-sequence pair for a protein with the lowest score as the predicted sequence. If it is not the native sequence , the discrimination failed and the design scoring function does not work for this protein.
The nonlinear design scoring function is capable of discriminating all of the 440 native sequences. In contrasts, no linear scoring function can succeed in this task. The nonlinear potential function also works well for the test set, where it succeeded in correctly identifying 93.3% (181 out of 194) of native sequences in the independent test set of 194 proteins. This compares favorably with results obtained using optimal linear folding scoring function taken as reported in (Tobi et al., 2000a), which succeeded in identifying 80.9% (157 out of 194) of this test set. It also has better performance than optimal linear scoring function based on calculations using parameters reported in reference (Bastolla et al., 2001), which succeeded in identifying 73.7% (143 out of 194) of proteins in the test set. The Miyazawa-Jernigan statistical potential succeeded in identifying 113 native proteins out of 194) (success rate 58.2%).
4.5.4 Protein stability and binding affinity
Because the stability of protein in the native conformation is determined by the distribution of the full ensemble of conformations, namely, the partition function of the protein sequence , care must be taken when using statistical potentials to compare the stabilities of different protein sequences adopting the same given conformation as in protein design (Miyazawa and Jernigan, 1996; Sippl, 1990). This issue is discussed in some detail in Subsection 4.7.1.
Nevertheless, it is expected that statistical potential should work well in estimating protein stability changes upon mutations, as the change in partition functions of the protein sequence is small. In most such studies and studies using physics-based empirical potential (see Chapter 4 in this book and reference (Bordner and Abagyan, 2004)), good correlation coefficient (0.6–0.8) between predicted and measured stability change can be achieved (Gilis and Rooman, 1996, 1997; Guerois et al., 2002; Bordner and Abagyan, 2004; Hoppe and Schomburg, 2005; Zhou and Zhou, 2002).
Several studies have shown that statistical potentials can also be used to predict quantitative binding free energy of protein-protein or protein-ligand interactions (DeWitte and Shakhnovich, 1996; Mitchell et al., 1999; Muegge and Martin, 1999; Liu et al., 2004; Zhang et al., 2005). In fact, Xu et al. showed that a simple number count of hydrophilic bridges across the binding interface is strongly correlated with binding free energies of protein-protein interaction (Xu et al., 1997). This study suggests that binding free energy may be predicted successfully by number counts of various types of interfacial contacts defined using some distance threshold. Such number count studies provide an excellent benchmark to quantify the improvement in predicting binding free energy when using statistical potentials for different protein-protein and protein-ligand complexes. Similar to prediction of protein stability change upon mutation, knowledge based potential function played an important role in a successful study of predicting binding free energy changes upon mutation (Kortemme and Baker, 2002; Kortemme et al., 2004).
4.6 Online resource
A list of online sources of decoy data for folding and docking is provided in Table 4.4.
| Decoy sets | Type | URL | |
| Decoy ‘R’ Usa | folding | http://dd.stanford.edu/ | |
| Loop | folding | http://francisco.compbio.ucsf.edu /∼jacobson/decoy.htm | |
| CASP | folding | http://predictioncenter.org/ | |
| ZDOCK, RDOCK | docking | http://zlab.bu.edu/∼leely/RDOCK _decoy/ | |
| Vakser decoy set | docking | http://www.bioinformatics.ku.edu/ files/vakser/decoys/ | |
| Sternberg decoy set | docking | http://www.sbg.bio.ic.ac.uk/docking/ all_decoys.html | |
| Rosetta | docking, folding | http://depts.washington.edu/bakerpg/ | |
| CAPRI | docking | http://capri.ebi.ac.uk/ | |
| a: The database of Decoy ‘R’ Us contains multiple decoy sets, Single decoy sets and loop decoy sets. 4-state-reduced decoy set is included in the multiple decoy sets. | |||
4.7 Discussion
4.7.1 Knowledge-Based statistical potential functions
The statistical potential functions are often derived based on several assumptions: (a) protein energetics can be decomposed primarily into pairwise interactions; (b) interactions are independent from each other; (c) the partition function in native proteins and in reference states are approximately equal; (d) the probability of occupancy of a state follows the Boltzmann distribution. These assumptions are often unrealistic and raise questions about the validity of the statistical potential functions: Can statistical potential functions provide energy-like quantities such as the folding free energy of a protein, or the binding free energy of a protein-protein complex (Thomas and Dill, 1996b)? Can statistical potential functions correctly recognize the native structures from alternative conformations?
The assumptions of statistical knowledge-based potential functions. From Equation 4.4, we can obtain the potential function by estimating the probability . However, we need a number of assumptions for this approach to work. We need the independency assumption to have: π() = ∏_i π(c_i) = ∏_i ∏_c_i π_i, where is the number of occurrence of -th structural feature, e.g., number of a specific residue pair contact; is the probability of -th structural feature in the database. That is, we have to assume that the distribution of a specific structural feature is independent and not influenced by any other features, and is of no consequence for the distribution of other features as well. We also need to assume that provides an adequate characterization of protein interactions, and the functional form of provides the correct measurement of the energy of the interactions. We further need to assume that the energy for a protein-solvent system is decomposable, , i.e., the overall energy can be partitioned into many basic energy terms, such as pairwise interactions, desolvation energies. Moreover, the partition functions in a chosen reference state are approximately equal to the partition functions in native proteins. These above assumptions together lead to the Boltzmann assumption that the structural features contained in the protein database must be a population correctly sampled under the Boltzmann distribution. That is, for for any protein descriptor, we have: π_i ∝exp(-w_i).
To calculate in practice, we have to rely on another assumption that all protein structures are crystallized at the same temperature. Therefore, the distribution is reasonably similar for all proteins in the database, and hence the frequency counts of protein descriptors in different protein structures can be combined by simple summation with equal weight.
Clearly, none of these assumptions are strictly true. However, the success of many applications of using the statistical knowledge-based potentials indicate that they do capture many important properties of proteins. The question for improving statistical potential function is, how seriously each of these assumptions is violated and to what extent it affects the validity of the potential function. A few assumptions specific to a particular potential function (such as the coordination and solvation assumptions for the Miyazawa-Jernigan’s reaction model) have been described earlier. Here we discuss several assumptions in details below.
Interactions are not independent. Using a HP (hydrophobic-Polar) model on two-dimensional lattice, Thomas and Dill (1996) tested the accuracy of Miyazawa-Jernigan contact potentials and Sippl’s distance-dependent potentials. In HP model, a peptide chain contains only two types of monomer: and . The true energies are set as and . Monomers are in contact if they are non-bonded nearest neighbors on the lattice. The conformational space was exhaustively searched for all sequences with the chain length from 11 to 18. A sequence is considered to have a native structure if it has a unique ground energy state. All native structures were collected to build a structure database, from which the statistical potentials are extracted by following the Miyazawa-Jernigan or the Sippl method. The extracted energies are denoted as , and .
It was found that neither of these two methods can extract the correct energies. All extracted energies by these two methods depend on chain length, while the true energies do not. Using Miyazawa-Jernigan’s method, the contact is correctly determined as dominant and attractive. However, the estimated values for and are not equal to zero, whereas the true energies and are equal to zero. Using Sippl’s method, the extracted potentials erroneously show a distance-dependence, i.e., interactions are favorable in short-distance but unfavorable in long-distance, and conversely for interactions, whereas the true energies in the HP model only exist between a first-neighbor contact, and become zero for all the interactions separated by two or more lattice units.
These systematic errors result from the assumption that the pairwise interactions are independent, and thus the volume exclusion in proteins can be neglected (Thomas and Dill, 1996b). However, interactions indirectly affects the observed frequencies of and interactions. First, in both contact and distance-dependent potentials, because only a limited number of inter-residue contacts can be made within the restricted volume at a given distance, the high density of pairs at short distances is necessarily coupled with the low density (relative to reference state) of and pairs at the same distances, especially at the distance of one lattice unit. As a result, the extracted and energies are erroneously unfavorable at short distance. Second, for distance-dependent potentials, the energy of a specific type of pair interaction at a given distance is influenced by the same type of pair at different distances. For example, the high density of pairs at short distances causes a compensating depletion (relative to the uniform density reference state) at certain longer distances, and conversely for and interactions. Admittedly this study was carried out using models of short chain lengths and a simple alphabet of residues where the foldable sequences may be very homologous, hence the observed artifacts are profound, the deficiencies of the statistical potentials revealed in this study such as the excluded volume effect is likely to be significant in potential functions derived from real proteins.
Pairwise interactions are not additive. Interactions stabilizing proteins are often modeled by pairwise contacts at atom or residue level. An assumption associated with this approach is the additivity of pairwise interactions, namely, the total energy or fitness score of a protein is the linear sum of all of its pairwise interactions.
However, the non-additivity effects have been clearly demonstrated in cluster formation of hydrophobic methane molecules both in experiment (Ben-Naim, 1997a) and in simulation (Rank and Baker, 1997; Shimizu and Chan, 2001, 2002; Czaplewski et al., 2000). Protein structure refinement will likely require higher order interactions (Betancourt and Thirumalai, 1999). Some three-body contacts have been introduced in several studies (Eastwood and Wolynes, 2001; Rossi et al., 2001; Godzik and Skolnick, 1992; Godzik et al., 1992), where physical models explicitly incorporating three-body interactions are developed. In addition, several studies of Delaunay four-body interactions clearly showed the importance of including higher order interactions in explaining the observed frequency distribution of residue contacts (Krishnamoorthy and Tropsha, 2003; Carter Jr. et al., 2001; Gan et al., 2001; Zheng et al., 1997a; Singh et al., 1996a; Munson and Singh, 1997).
Li and Liang (2005) introduced a geometric model based on the Delaunay triangulation and alpha shape to collect three-body interactions in native proteins. A nonadditivity coefficient is introduced to compare the three-body potential energy with the summation of three pairwise interactions and : ν_(i,j,k) = exp[-e_(i,j,k)]/exp[ -(e_(i,j) + e_(i,k) + e_(j,k))].
There are three possibilities: (1) : interaction of a triplet type is additive in nature and can be well approximated by the sum of three pairwise interactions; (2) : three-body interactions are cooperative and their association is more favorable than three independent pairwise interactions; (3) : three-body interactions are anti-cooperative.
After systematically quantifying the nonadditive effects of all three-body contacts, it was found that hydrophobic interactions and hydrogen bonding interactions make nonadditive contributions to protein stability, but the nonadditive nature depends on whether such interactions are located in protein interior or on protein surface. When located in interior, many hydrophobic interactions such as those involving alkyl residues are anti-cooperative, namely . Salt-bridge and regular hydrogen-bonding interactions such as those involving ionizable residues and polar residues are cooperative in interior. When located on protein surface, these salt-bridge and regular hydrogen bonding interactions are anti-cooperative with , and hydrophobic interactions involving alkyl residues become cooperative (Li and Liang, 2005b).
Sequence dependency of the partition function . We can obtain the total effective energy given a structure conformation and its amino acid sequence from Equation (4.5):
| (4.48) |
where is the total number count of the occurrence of the -th descriptor, e.g., the total number of -th type of pairwise contact. The summation involving and is ignored during the evaluation of by assuming .
It is clear that both and do not depend on the particular structural conformation . Therefore, the omission of the term of the partition functions will not affect the rank ordering of energy values of different conformations (i.e., decoys) for the same protein sequence. On the other hand, it is also clear that both and depend on the specific sequence of a protein. Therefore, there is no sound theoretical basis to compare the stabilities between different proteins using the same knowledge-based potential function, unless the ratio of for each individual sequence is known and is included during the evaluation (Miyazawa and Jernigan, 1985; Samudrala and Moult, 1998; Sippl, 1990). Notably, Dfire and other statistical energy functions have been successful used to predict binding affinities across different protein-protein/peptide complexes. Nevertheless, the theoretical basis is not sound either, because the values of partition function Z(a)s for different protein complexes can be drastically different. It remains to be seen whether a similarly successful prediction of binding affinities can be achieved just by using the number of native interface contacts at some specific distance interval, i.e. the packing density along the native interface. This omission is probably benign for the problem of predicting free energy change of a protein monomer or binding free energy change of a protein-protein complex upon point mutations, because the distribution of the ensemble of protein conformations may not change significantly after one or several point mutations.
Evaluating potential function. The measure used for performance evaluation of potential functions is important. For example, -score of native protein among decoys is widely-used as an important performance statistic. However, -score strongly depends on the properties of the decoy set. Imagine we have access to the true energy function. If a decoy set has a diverse distribution in true energy values, the -score of the native structure will not be very large. However, this by no means suggests that a knowledge-based energy function that gives a larger -score for native protein is better than the true energy function. Alternative measures may provide more accurate or useful performance evaluation. For example, the correlation of energy value and crmsd may be helpful in protein structure prediction. Since a researcher has no access to the native structure, (s)he has to rely on the guidance of an energy function to search for better structures with lower crmsd to the unknown native structure. For this purpose, a potential function with a large will be very useful. Perhaps the performance of a potential function should be judged not by a single statistic but comprehensively by a number of measures.
4.7.2 Relationship of knowledge-based energy functions and further development
The Miyazawa-Jernigan contact potential is the first widely used knowledge-based potential function. Because it is limited by the simple spatial description of a cut-off distance, it cannot capture the finer spatial details. Several distance-dependent potentials have been developed to overcome this limitation, and in general have better performance (Lu and Skolnick, 2001; Samudrala and Moult, 1998; Zhou and Zhou, 2002). A major focus of works in this area is the development of models for the reference state. For example, the use of the ideal gas as reference state in the potential function Dfire significantly improves the performance in folding and docking decoy discrimination (Zhang et al., 2004a).
Because protein surface, interior, and protein-protein interface are packed differently, the propensity of the same pairwise interaction can be different depending on whether the residues are solvent-exposed or are buried. The contact potential of Simons et al. considers two types of environment, i.e., buried and non-buried environments separately (Simons et al., 1999b). The geometric potential function (Li and Liang, 2005a) described in Subsection 4.3.5 incorporates both dependencies on distance and fine-graded local packing, resulting in significant improvement in performance. Table 4.5.1 show that this potential can be successfully used in both protein structure and docking prediction. Knowledge based potential has also been developed to account for the loss of backbone, side-chain, and translational entropies in folding and binding (Amzel, 2000; Lee et al., 1994).
Another emphasis of recent development of potential function is the orientational dependency of pairwise interaction (Kortemme et al., 2003; Buchete et al., 2003, 2004; Miyazawa and Jernigan, 2005). Kortemme et al. developed an orientation-dependent hydrogen bonding potential, which improved prediction of protein structure and specific protein-protein interactions (Kortemme et al., 2003). Miyazawa and Jernigan developed a fully anisotropic distance-dependent potential, with drastic improvements in decoy discrimination over the original Miyazawa-Jernigan contact potential (Miyazawa and Jernigan, 2005).
Computational Efficiency Given current computing power, all potential functions discussed above can be applied to large-scale discrimination of native or near-native structures from decoys. For example, the geometric potential requires complex computation of the Delaunay tetrahedrization and alpha shape of the molecule (see Chapter 7 for details). Nevertheless, the time complexity is only , where is the number of residues for residual-level potentials or atoms for atom-level potentials. For comparison, a naive implementation of contact computing without the use of proper data structure such as a quad-tree or -d tree is .
In general, atom-level potentials have better accuracy in recognizing native structures than residue-level potentials, and is often preferred for the final refinement of predicted structures, but it is computationally too expensive to be applicable in every step of a folding or sampling computation.
Potential function for membrane protein. The potential functions we have discussed in Section 3 are based on the structures of soluble proteins. Membrane proteins are located in a very different physico-chemical environment. They also have different amino acid composition, and they fold differently. Potential functions developed for soluble proteins are therefore not applicable to membrane proteins. For example, Cys-Cys has the strongest pairing propensity because of the formation of disulfide bond. However, Cys-Cys pairs rarely occur in membrane proteins. This and other difference in pairwise contact propensity between membrane and soluble proteins are discussed in (Adamian and Liang, 2001).
Nevertheless, the physical models underlying most potential functions developed for soluble proteins can be modified for membrane proteins (Adamian and Liang, 2001, 2002; Adamian et al., 2003; Park et al., 2004; Jackups Jr and Liang, 2005). For example, Sale et al used the Mhip potential developed in (Adamian and Liang, 2001) to predict optimal bundling of TM helices. With the help of 27 additional sparse distance constraints from experiments reported in literature, these authors succeeded in predicting the structure of dark-adapted rhodopsin to within 3.2 Å of the crystal structure (Sale et al., 2004). It is likely that statistical potentials can be similarly developed for protein-ligand and protein-nucleotides interactions using the same principle.
4.7.3 Optimized potential function
Knowledge based potential function derived by optimization has a number of characteristics that are distinct from statistical potential. We discuss in detail below.
Training set for optimized potential function. Unlike statistical potential functions where each native protein in the database contribute to the knowledge-based scoring function, only a subset of native proteins contribute. In an optimized potential function, in addition, a small fraction of decoys also contribute to the scoring function. In the study of (Hu et al., 2004), about of native proteins and of decoys from the original training data of 440 native proteins and 14 million sequence decoys contribute to the potential function.
As illustrated in the second geometric views, the discrimination of native proteins occurs at the boundary surface between the vector points and the origin. It does not help if the majority of the training data are vector points away from the boundary surface. This implies the need for optimized potential to have appropriate training data. If no a priori information is known, it is likely many decoys (millions) will be needed to accurately define the discrimination boundary surface, because of the usually large dimension of the descriptors for proteins. However, this imposes significant computational burden.
Various strategies have been developed to select only the most relevant vector points. Usually, one may only include the most difficult decoys during training, such as decoys with lower energy than native structures, decoys with lowest absolute energies, and decoys already contributing to the potential function in previous iteration (Micheletti et al., 2001; Tobi et al., 2000b; Hu et al., 2004). In addition, an iterative training process is often necessary (Micheletti et al., 2001; Tobi et al., 2000b; Hu et al., 2004).
Reduced nonlinear potential function. The use of nonlinear terms for potential function involves large datasets, because they are necessary a priori to define accurately the discrimination surface. This demands the solution of a huge optimization problem. Moreover, the representation of the boundary surface using a large basis set requires expensive computing time for the evaluation of a new unseen contact vector . To overcome these difficulties, non-linear potential function needs to be further simplified.
One simple approach is to use alternative optimal criterion, for example, by minimizing the distance expressed in 1-norm instead of the standard 2-norm Euclidean distance. The resulting potential function will automatically have reduced terms. Another promising approach is to use rectangle kernels (Hu, Dai, and Liang, manuscript).
Potential function by optimal regression. Currently, most optimized potential functions are derived based on decoy discrimination, which is a form of binary classification. Here we suggest a conceptual improvement that can significantly improve the development of optimized potential functions. If we can measure the thermodynamic stabilities of all major representative proteins under identical experimental conditions (e.g., temperature, pH, salt concentration, and osmolarity), we can attempt to develop potential functions with the objective of minimizing the regression errors of fitted energy values and measured energy values. The resulting energy surface will then provide quantitative information about protein stabilities. However, the success of this strategy will depend on coordinated experimental efforts in protein thermodynamic measurements. The scale of such efforts may need to be similar to that of genome sequencing projects and structural genomics projects.
4.7.4 Data dependency of knowledge-based potentials
There are many directions to improve knowledge-based potential functions. Often it is desirable to include additional descriptors in the energy functions to more accurately account for solvation, hydrogen bonding, backbone conformation (e.g., and angles), and side chain entropies. Furthermore, potential functions with different descriptors and details may be needed for different tasks (e.g. backbone prediction vs structure refinement, (Rohl et al., 2004)).
An important issue in both statistical potential and optimized potential is their dependency on the amount of available training data and possible bias in such data. For example, whether a knowledge-based potential derived from a bias data set is applicable to a different class of proteins is the topic of several studies (Zhang et al., 2004c; Khatun et al., 2004). Zhang et al further studies the effect of database choice on statistical potential (Zhang et al., 2004b). In addition, when the amount of data is limited, over-fitting is a real problem if too many descriptors are introduced in either of the two types of potential functions. For statistical potential, hierarchical hypothesis testing should help to decide whether additional terms is warranted. For optimized potential, cross-validation will help to uncover possible overfitting (Hu et al., 2004).
4.8 Summary
In this chapter, we discussed the general framework of developing knowledge-based potential functions in terms of molecular descriptors, functional form, and parameter calculations. We also discussed the underlying thermodynamic hypothesis of protein folding. With the assumption that frequently observed protein features in a database of structures correspond to low energy state, frequency of observed interactions can be converted to energy terms. We then described in details the models behind the Miyazawa-Jernigan contact potential, distance dependent potentials, and geometric potentials. We also discussed how to weight sample structures of varying degree of sequence similarity in the structural database. In the section of optimization method, we describe general geometric models for the problem of obtaining optimized knowledge-based potential functions, as well as methods for developing optimal linear and nonlinear potential functions. This is followed by a brief discussion of several applications of the knowledge-based potential functions. Finally, we point out general limitations and possible improvements for the statistical and optimized potential functions.
4.9 Further reading
Anfinsen’s thermodynamic hypothesis can be found in (Anfinsen et al., 1961; Anfinsen, 1973). More technical details of the Miyazawa-Jernigan contact potential are described in (Miyazawa and Jernigan, 1985, 1996). Distance dependent potential function was first proposed by Sippl in (Sippl, 1990), with further development described in (Lu and Skolnick, 2001; Samudrala and Moult, 1998). The development of geometric potentials can be found in (Zheng et al., 1997a; Carter Jr. et al., 2001; Li et al., 2003; Krishnamoorthy and Tropsha, 2003; McConkey et al., 2003). The gas-phase approximation of the reference state is discussed in (Zhou and Zhou, 2002). Thomas and Dill offered insightful comments about the deficiency of knowledge-based statistical potential functions (Thomas and Dill, 1996b). The development of optimized linear potential functions can be found in (Vendruscolo et al., 2000b; Micheletti et al., 2001; Tobi et al., 2000a). The geometric view for designing optimized potential function and the nonlinear potential function are based on the results in (Hu et al., 2004).
4.10 Acknowledgments
We thank Drs. Bob Jernigan, Hui Lu, Dong Xu, Hongyi Zhou, and Yaoqi Zhou for helpful discussions. This work is supported by grants from the National Science Foundation (CAREER DBI0133856), the National Institute of Health (GM68958), the Office of Naval Research (N000140310329), and the Whitaker Foundation (TF-04-0023).
References
- Adamian et al. (2003) Adamian L, Jackups R, Binkowski TA, Liang J (2003) Higher-order interhelical spatial interactions in membrane proteins. J Mol Biol 327:251–272.
- Adamian and Liang (2001) Adamian L, Liang J (2001) Helix-helix packing and interfacial pairwise interactions of residues in membrane prot eins. J Mol Biol 311:891–907.
- Adamian and Liang (2002) Adamian L, Liang J (2002) Interhelical hydrogen bonds and spatial motifs in membrane proteins: polar clamps and serine zippers. Proteins 47:209–218.
- Amzel (2000) Amzel LM (2000) Calculation of entropy changes in biological processes: folding, binding, and oligomerization. Methods Enzymol 323:167–77.
- Anfinsen et al. (1961) Anfinsen C, Haber E, Sela M, White F (1961) The kinetics of formation of native ribonuclease during oxidation of the reduced polypeptide chain. Proc Natl Acad Sci 47:1309–1314.
- Anfinsen (1973) Anfinsen CB (1973) Principles that govern the folding of protein chains. Science 181:223–230.
- Bastolla et al. (2001) Bastolla U, Farwer J, Knapp EW, Vendruscolo M (2001) How to guarantee optimal stability for most representative structurs in the protein data bank. Proteins 44:79–96.
- Bastolla et al. (2000) Bastolla U, Vendruscolo M, Knapp EW (2000) A statistical mechanical method to optimize energy functions for protein folding. Proc Natl Acad Sci USA 97:3977–3981.
- Ben-Naim (1997a) Ben-Naim A (1997a) Statistical potentials extracted from protein structures: Are these meaningful potentials? J Chem Phys 107:3698–3706.
- Ben-Naim (1997b) Ben-Naim A (1997b) Statistical potentials extracted from protein structures: Are these meaningful potentials? J Chem Phys 107:3698–3706.
-
Berkelaar (2004)
Berkelaar M (2004) LP_Solve package .
URL http://www.cs.sunysb.edu/ algorith/implement/lpsolve/ implement.shtml - Betancourt and Thirumalai (1999) Betancourt MR, Thirumalai D (1999) Pair potentials for protein folding: Choice of reference states and sensitivity of predicted native states to variations in the interaction schemes. Protein Sci 8:361–369.
- Bienkowska et al. (1999) Bienkowska JR, Rogers RG, Smith TF (1999) Filtered neighbors threading. Proteins 37:346–359.
- Bordner and Abagyan (2004) Bordner AJ, Abagyan RA (2004) Large-scale prediction of protein geometry and stability changes for arbitrary single point mutations. Proteins 57(2):400–13.
- Buchete et al. (2003) Buchete NV, Straub JE, Thirumalai D (2003) Anisotropic coarse-grained statistical potentials improve the ability to identify nativelike protein structures. The Journal of Chemical Physics 118:7658–7671.
- Buchete et al. (2004) Buchete NV, Straub JE, Thirumalai D (2004) Orientational potentials extracted from protein structures improve native fold recognition. Protein Sci 13:862–74.
-
Burges (1998)
Burges CJC (1998) A Tutorial on Support Vector Machines for Pattern
Recognition. Knowledge Discovery and Data Mining 2.
URL /papers/Burges98.ps.gz - Carter Jr. et al. (2001) Carter Jr. C, LeFebvre B, Cammer S, Tropsha A, Edgell M (2001) Four-body potentials reveal protein-specific correlations to stability changes caused by hydrophobic core mutations. J Mol Biol 311(4):625–638.
- Chan and Dill (1990) Chan HS, Dill KA (1990) Origins of structure in globular proteins. Proc Natl Acad Sci 87:6388–6392.
- Chiu and Goldstein (1998) Chiu TL, Goldstein RA (1998) Optimizing energy potentials for success in protein tertiary structure prediction. Folding Des 3:223–228.
- Czaplewski et al. (2000) Czaplewski C, Rodziewicz-Motowidlo S, Liwo A, Ripoll DR, Wawak RJ, Scheraga HA (2000) Molecular simulation study of cooperativity in hydrophobic association. Protein Sci 9:1235–1245.
-
Czyzyk et al. (2004)
Czyzyk J, Mehrotra S, Wagner M, Wright S (2004) PCx package .
URL http://www-fp.mcs.anl.gov/otc/Tools/PCx/ - Dahiyat and Mayo (1997) Dahiyat BI, Mayo SL (1997) De Novo protein design: Fully automated sequence selection. Science 278:82–87.
- Deutsch and Kurosky (1996) Deutsch JM, Kurosky T (1996) New algorithm for protein design. Phys Rev Lett 76:323–326.
- DeWitte and Shakhnovich (1996) DeWitte RS, Shakhnovich EI (1996) SMoG: de novo design method based on simple, fast and accurate free energy estimates. 1. Methodology and supporting evidence. J Am Chem Soc 118:11733–44.
- Dima et al. (2000) Dima RI, Banavar JR, Maritan A (2000) Scoring functions in protein folding and design. Protein Sci 9:812–819.
- Dobbs et al. (2002) Dobbs H, Orlandini E, Bonaccini R, Seno F (2002) Optimal potentials for predicting inter-helical packing in transmembrane proteins. Proteins 49(3):342–349.
- Duan and Kollman (1998) Duan Y, Kollman PA (1998) Pathways to a protein folding intermediate observed in a 1-microsecond simulation in aqueous solution. Science 282:740–744.
- Eastwood and Wolynes (2001) Eastwood MP, Wolynes PG (2001) Role of explicitly cooperative interactions in protein folding funnels: A simulation study. J Chem Phys 114(10):4702–4716.
- Edelsbrunner (1987) Edelsbrunner H (1987) Algorithms in combinatorial geometry. Springer-Verlag, Berlin.
- Fain et al. (2002) Fain B, Xia Y, Levitt M (2002) Design of an optimal Chebyshev-expanded discrimination function for globular proteins. Protein Sci 11:2010–2021.
- Finkelstein et al. (1995) Finkelstein AV, Badretdinov AY, Gutin AM (1995) Why do protein architectures have boltzmann-like statistics? Proteins 23(2):142–50.
- Friedrichs and Wolynes (1989) Friedrichs MS, Wolynes PG (1989) Toward protein tertiary structure recognition by means of associative memory hamiltonians. Science 246:371–373.
- Gan et al. (2001) Gan H, Tropsha A, Schlick T (2001) Lattice protein folding with two and four-body statistical potentials. Proteins 43(2):161–174.
- Gilis (2004) Gilis D (2004) Protein decoy sets for evaluating energy functions. J Biomol Struct Dyn 21:725–36.
- Gilis and Rooman (1996) Gilis D, Rooman M (1996) Stability changes upon mutation of solvent-accessible residues in proteins evaluated by database-derived potentials. J Mol Biol 257(5):1112–26.
- Gilis and Rooman (1997) Gilis D, Rooman M (1997) Predicting protein stability changes upon mutation using database-derived potentials: solvent accessibility determines the importance of local versus non-local interactions along the sequence. J Mol Biol 272(2):276–90.
- Godzik et al. (1992) Godzik A, Kolinski A, Skolnick J (1992) Topology fingerprint approach to the inverse protein folding problem. J Mol Biol 227(1):227–238.
- Godzik and Skolnick (1992) Godzik A, Skolnick J (1992) Sequence-structure matching in globular proteins: application to supersecondary and tertiary structure determination. Proc Natl Acad Sci 89(24):12098–102.
- Goldstein et al. (1992) Goldstein R, Luthey-Schulten ZA, Wolynes PG (1992) Protein tertiary structure recognition using optimized hamiltonians with local interactions. Proc Natl Acad Sci USA 89:9029–9033.
- Guerois et al. (2002) Guerois R, Nielsen JE, Serrano L (2002) Predicting changes in the stability of proteins and protein complexes: a study of more than 1000 mutations. J Mol Biol 320(2):369–87.
- Hao and Scheraga (1999a) Hao MH, Scheraga H (1999a) Designing potential energy functions for protein folding. Curr Opinion Structural Biology 9:184–188.
- Hao and Scheraga (1996) Hao MH, Scheraga HA (1996) How optimization of potential functions affects protein folding. Proc Natl Acad Sci 93(10):4984–89.
- Hao and Scheraga (1999b) Hao MH, Scheraga HA (1999b) Designing potential energy functions for protein folding. Curr Opin Struct Biol 9:184–188.
- Hill et al. (2000) Hill RB, Raleigh DP, Lombardi A, DeGrado WF (2000) De novo design of helical bundles as models for understanding protein folding and function. Acc Chem Res 33:745–754.
- Hoppe and Schomburg (2005) Hoppe C, Schomburg D (2005) Prediction of protein thermostability with a direction- and distance-dependent knowledge-based potential. Protein Sci 14:2682–92.
- Hu et al. (2004) Hu C, Li X, Liang J (2004) Developing optimal non-linear scoring function for protein design. Bioinformatics 20(17):3080–98.
- Jackups Jr and Liang (2005) Jackups Jr R, Liang J (2005) Interstrand Pairing Patterns in -Barrel Membrane Proteins: The Positive-outside Rule, Ar omatic Rescue, and Strand Registration Prediction. J Mol Biol In Press.
- Janicke (1987) Janicke R (1987) Folding and association of proteins. Prog Biophys Mol Biol 49:117–237.
- Jernigan and Bahar (1996) Jernigan RL, Bahar I (1996) Structure-derived potentials and protein simulations. Curr Opin Struct Biol 6:195–209.
- Karmarkar (1984) Karmarkar N (1984) A new polynomial-time algorithm for linear programming. Combinatorica 4:373–395.
- Karplus and Petsko (1990) Karplus M, Petsko GA (1990) Molecular dynamics simulations in biology. Nature :631–639.
- Khatun et al. (2004) Khatun J, Khare SD, Dokholyan NV (2004) Can contact potentials reliably predict stability of proteins? J Mol Biol 336:1223–1238.
- Kocher et al. (1994) Kocher JA, Rooman MJ, Wodak SJ (1994) Factors influencing the ability of knowledge-based potentials to identify native sequence-structure matches. J Mol Biol 235:1598–1613.
- Koehl and Levitt (1999a) Koehl P, Levitt M (1999a) De Novo protein design. I. In search of stability and specificity. J Mol Biol 293:1161–1181.
- Koehl and Levitt (1999b) Koehl P, Levitt M (1999b) De Novo protein design. II. Plasticity of protein sequence. J Mol Biol 293:1183–1193.
- Koretke et al. (1996) Koretke KK, Luthey-Schulten Z, Wolynes PG (1996) Self-consistently optimized statistical mechanical energy functions for sequence structure alignment. Protein Sci 5:1043–1059.
- Koretke et al. (1998) Koretke KK, Luthey-Schulten Z, Wolynes PG (1998) Self-consistently optimized energy functions for protein structure prediction by molecular dynamics. Proc Natl Acad Sci 95(6):2932–7.
- Kortemme and Baker (2002) Kortemme T, Baker D (2002) A simple physical model for binding energy hot spots in protein-protein complexes. Proc Natl Acad Sci 99:14116–21.
- Kortemme et al. (2004) Kortemme T, Kim DE, Baker D (2004) Computational alanine scanning of protein-protein interfaces. Sci STKE 2004:pl2.
- Kortemme et al. (2003) Kortemme T, Morozov AV, Baker D (2003) An orientation-dependent hydrogen bonding potential improves prediction of specificity and structure for proteins and protein-protein complexes. J Mol Biol 326:1239–59.
- Krishnamoorthy and Tropsha (2003) Krishnamoorthy B, Tropsha A (2003) Development of a four-body statistical pseudo-potential to discriminate native from non-native protein conformations. Bioinformatics 19(12):1540–8.
- Kuhlman et al. (2003) Kuhlman B, Dantas G, Ireton GC, Varani G, Stoddard BL, Baker D (2003) Design of a novel globular protein fold with atomic-level accuracy. Science :1364–8.
- Lazaridis and Karplus (2000) Lazaridis T, Karplus M (2000) Effective energy functions for protein structure prediction. Curr Opin Struct Biol 10:139–145.
- Lee et al. (1994) Lee KH, Xie D, Freire E, Amzel LM (1994) Estimation of changes in side chain configurational entropy in binding and folding: general methods and application to helix formation. Proteins 20:68–84.
- Lemer et al. (1995) Lemer CMR, Rooman MJ, Wodak SJ (1995) Protein-structure prediction by threading methods - evaluation of current techniques. Proteins 23:337–355.
- Levitt and Warshel (1975) Levitt M, Warshel A (1975) Computer simulation of protein folding. Nature 253:694–8.
- Li et al. (1996) Li H, Helling R, Tang C, Wingreen N (1996) Emergence of preferred structures in a simple model of protein folding. Science 273:666–669.
- Li et al. (1997) Li H, Tang C, Wingreen NS (1997) Nature of driving force for protein folding: A result from analyzing the statistical potential. Phys Rev Lett 79:765–768.
- Li et al. (2003) Li X, Hu C, Liang J (2003) Simplicial edge representation of protein structures and alpha contact potential with confidence measure. Proteins 53:792–805.
- Li and Liang (2005a) Li X, Liang J (2005a) Computational design of combinatorial peptide library for modulating protein-protein interactions. Pacific Symposium of Biocomputing .
- Li and Liang (2005b) Li X, Liang J (2005b) Geometric cooperativity and anti-cooperativity of three-body interactions in native proteins. Proteins 60:46–65.
- Liang and Dill (2001) Liang J, Dill KA (2001) Are proteins well-packed? Biophys J 81:751–766.
- Liu et al. (2004) Liu S, Zhang C, Zhou H, Zhou Y (2004) A physical reference state unifies the structure-derived potential of mean force for protein folding and binding. Proteins 56:93–101.
- Looger et al. (2003) Looger LL, Dwyer MA, Smith JJ, Hellinga HW (2003) Computational design of receptor and sensor proteins with novel functions. Nature 423:185–190.
- Lu and Skolnick (2001) Lu H, Skolnick J (2001) A distance-dependent atomic knowledge-based potential for improved protein structure selection. Proteins 44:223–232.
- Maiorov and Crippen (1992) Maiorov VN, Crippen GM (1992) Contact potential that pecognizes the correct folding of globular proteins. J Mol Biol 227:876–888.
- McConkey et al. (2003) McConkey BJ, Sobolev V, Edelman M (2003) Discrimination of native protein structures using atom-atom contact scoring. Proc Natl Acad Sci 100:3215–3220.
- Méndez et al. (2005) Méndez R, Leplae R, Lensink MF, Wodak SJ (2005) Assessment of capri predictions in rounds 3-5 shows progress in docking procedures. Proteins 60:150–169.
- Mészáros (1996) Mészáros CS (1996) Fast Cholesky factorization for interior point methods of linear programming. Comp Math Appl 31:49 – 51.
- Micheletti et al. (2001) Micheletti C, Seno F, Banavar JR, Maritan A (2001) Learning effective amino acid interactions through iterative stochastic techniques. Proteins 42(3):422–431.
- Mirny and Shakhnovich (1996) Mirny LA, Shakhnovich EI (1996) How to derive a protein folding potential? a new approach to an old problem. J Mol Biol 264:1164–1179.
- Mitchell et al. (1999) Mitchell BO, Laskowski RA, Alex A, Thornton JM (1999) BLEEP: potential of mean force describing protein-ligand interactions: II. Calculation of binding energies and comparison with experimental data. J Comp Chem 20:1177–85.
- Miyazawa and Jernigan (1985) Miyazawa S, Jernigan RL (1985) Estimation of effective interresidue contact energies from protein crystal structures: quasi-chemical approximation. Macromolecules 18:534–552.
- Miyazawa and Jernigan (1996) Miyazawa S, Jernigan RL (1996) Residue-residue potentials with a favorable contact pair term and an unfavorable high packing density term. J Mol Biol 256:623–644.
- Miyazawa and Jernigan (2005) Miyazawa S, Jernigan RL (2005) How effective for fold recognition is a potential of mean force that includes relative orientations between contacting residues in proteins? The Journal of Chemical Physics 122:024901.
- Momany et al. (1975) Momany FA, McGuire RF, Burgess AW, Scheraga HA (1975) Energy parameters in polypeptides. VII. Geometric parameters, partial atomic charges, nonbonded interactions, hydrogen bond interactions, and intrinsic torsional potentials for the naturally occurring amino acids. J Phys Chem 79(22):2361–2381.
- Muegge and Martin (1999) Muegge I, Martin YC (1999) A general and fast scoring function for protein-ligand interactions: a simplified potential approach. J Med Chem 42:791–804.
- Munson and Singh (1997) Munson PJ, Singh RK (1997) Statistical significane of hierarchical multi-body potential based on delaunay tessellation and their application in sequence-structure alignment. Protein Sci 6:1467–1481.
- Nishikawa and Matsuo (1993) Nishikawa K, Matsuo Y (1993) Development of pseudoenergy potentials for assessing protein 3-D-1-D compatibility and detecting weak homologies. Protein Eng 6:811–820.
- Papadimitriou and Steiglitz (1998) Papadimitriou C, Steiglitz K (1998) Combinatorial optimization: algorithms and complexity. Dover.
- Park and Levitt (1996) Park BH, Levitt M (1996) Energy functions that discriminate x-ray and near-native folds from well-constructed decoys. J Mol Biol 258:367–392.
- Park et al. (2004) Park Y, Elsner M, Staritzbichler R, Helms V (2004) Novel scoring function for modeling structures of oligomers of transmembrane alpha-helices. Proteins 57(3):577–85.
- Rank and Baker (1997) Rank JA, Baker D (1997) A desolvation barrier to hydrophobic cluster formation may contribute to the rate-limiting step in protein folding. Protein Sci 6(2):347–354.
- Rohl et al. (2004) Rohl CA, Strauss CE, Misura KM, Baker D (2004) Protein structure prediction using rosetta. Methods Enzymol 383:66–93.
- Rossi et al. (2001) Rossi A, Micheletti C, Seno F, Maritan A (2001) A self-consistent knowledge-based approach to protein design. Biophys J 80(1):480–490.
- Russ and Ranganathan (2002) Russ WP, Ranganathan R (2002) Knowledge-based potential functions in protein design. Curr Opin Struct Biol 12:447–452.
- Sale et al. (2004) Sale K, Faulon J, Gray G, Schoeniger J.S. an d Young M (2004) Optimal bundling of transmembrane helices using sparse distance constraints. Protein Sci 13(10):2613–27.
- Samudrala and Levitt (2000) Samudrala R, Levitt M (2000) Decoys ’R’ Us: a database of incorrect conformations to improve protein structure prediction. Protein Sci 9:1399–1401.
- Samudrala and Moult (1998) Samudrala R, Moult J (1998) An all-atom distance-dependent conditional probability discriminatory function for protein structure prediction. J Mol Biol 275:895–916.
- Schölkopf and Smola (2002) Schölkopf B, Smola AJ (2002) Learning with kernels: Support vector machines, regularization, optimization, and beyond. The MIT Press, Cambridge, MA.
- Shakhnovich (1994) Shakhnovich EI (1994) Proteins with selected sequences fold into unique native conformation. Phys Rev Lett 72:3907–3910.
- Shakhnovich and Gutin (1993) Shakhnovich EI, Gutin AM (1993) Engineering of stable and fast-folding sequences of model proteins. Proc Natl Acad Sci USA 90:7195–7199.
- Shimizu and Chan (2001) Shimizu S, Chan HS (2001) Anti-cooperativity in hydrophobic interactions: A simulation study of spatial dependence of three-body effects and beyond. J Chem Phys 115(3):1414–1421.
- Shimizu and Chan (2002) Shimizu S, Chan HS (2002) Anti-cooperativity and cooperativity in hydrophobic interactions: Three-body free energy landscapes and comparison with implicit-solvent potential functions for proteins. Proteins 48:15–30.
- Simons et al. (1999a) Simons KT, Ruczinski I, Kooperberg C, Fox B, Bystroff C, Baker D (1999a) Improved recognition of native-like protein structures using a combination of sequence-dependent and sequence-independent features of proteins. Proteins 34:82–95.
- Simons et al. (1999b) Simons KT, Ruczinski I, Kooperberg C, Fox B, Bystroff C, Baker D (1999b) Improved recognition of native-like protein structures using a combination of sequence-dependent and sequence-independent features of proteins. Proteins 34:82–95.
- Singh et al. (1996a) Singh RK, Tropsha A, Vaisman II (1996a) Delaunay tessellation of proteins: four body nearest-neighbor propensities of amino acid residues. J Comput Biol 3(2):213–221.
- Singh et al. (1996b) Singh RK, Tropsha A, Vaisman II (1996b) Delaunay tessellation of proteins: four body nearest-neighbor propensities of amino-acid residues. J Comp Bio 3:213–221.
- Sippl (1990) Sippl MJ (1990) calculation of conformational ensembles from potentials of the main force. J Mol Biol 213:167–180.
- Sippl (1993) Sippl MJ (1993) Boltzmann’s principle, knowledge-based mean fields and protein folding. an approach to the computational determination of protein structures. J Comput Aided Mol Des 7(4):473–501.
- Sippl (1995) Sippl MJ (1995) Knowledge-based potentials for proteins. Curr Opin Struct Biol 5(2):229–235.
- Tanaka and Scheraga (1976a) Tanaka S, Scheraga HA (1976a) Medium- and long-range interaction parameters between amino acids for predicting three-dimensional structures of proteins. Macromolecules 9:945–950.
- Tanaka and Scheraga (1976b) Tanaka S, Scheraga HA (1976b) Medium- and long-range interaction parameters between amino acids for predicting three-dimensional structures of proteins. Macromolecules 9:945–950.
- Thomas and Dill (1996a) Thomas PD, Dill KA (1996a) An iterative method for extracting energy-like quantities from protein structures. PNAS 93:11628–33.
- Thomas and Dill (1996b) Thomas PD, Dill KA (1996b) Statistical potentials extracted from protein structures: How accurate are they? J Mol Biol 257:457–469.
- Tobi et al. (2000a) Tobi D, Shafran G, Linial N, Elber R (2000a) On the design and analysis of protein folding potentials. Proteins 40:71–85.
- Tobi et al. (2000b) Tobi D, Shafran G, Linial N, Elber R (2000b) On the design and analysis of protein folding potentials. Proteins 40:71–85.
- Vanderbei (1996) Vanderbei RJ (1996) Linear Programming: Foundations and Extensions. Kluwer Academic Publishers.
- Vapnik (1995) Vapnik V (1995) The Nature of Statistical Learning Theory. Springer, N.Y., ISBN 0-387-94559-8.
- Vapnik and Chervonenkis (1964) Vapnik V, Chervonenkis A (1964) A note on one class of perceptrons. Automation and Remote Control 25.
- Vapnik and Chervonenkis (1974) Vapnik V, Chervonenkis A (1974) Theory of Pattern Recognition [in Russian]. Nauka, Moscow, (German Translation: W. Wapnik & A. Tscherwonenkis, Theorie der Zeichenerkennung, Akademie–Verlag, Berlin, 1979).
- Venclovas et al. (2003) Venclovas E, Zemla A, Fidelis K, Moult J (2003) Comparison of performance in successive CASP experiments. Proteins 45:163–170.
- Vendruscolo and Domanyi (1998) Vendruscolo M, Domanyi E (1998) Pairwise contact potentials are unsuitable for protein folding. J Chem Phys 109:11101–8.
- Vendruscolo et al. (2000a) Vendruscolo M, Najmanovich R, Domany E (2000a) Can a pairwise contact potential stabilize native protein folds against decoys obtained by threading? Proteins Structure Function and Genetics 38:134–148.
- Vendruscolo et al. (2000b) Vendruscolo M, Najmanovich R, Domany E (2000b) Can a pairwise contact potential stabilize native protein folds against decoys obtained by threading? Proteins Structure Function and Genetics 38:134–148.
- Wodak and Rooman (1993) Wodak SJ, Rooman MJ (1993) Generating and testing protein folds. Curr Opin Struct Biol 3:247–259.
- Wolynes et al. (1995) Wolynes PG, Onuchic JN, Thirumalai D (1995) Navigating the folding routes. Science 267:1619–20.
- Xia and Levitt (2000) Xia Y, Levitt M (2000) Extracting knowledge-based energy functions from protein structures by error rate minimization: Comparison of methods using lattice model. J Chem Phys 113:9318–9330.
- Xu et al. (1997) Xu D, Lin SL, Nussinov R (1997) Protein binding versus protein folding: the role of hydrophilic bridges in protein associations. J Mol Biol 2651:68–84.
- Zhang and Kim (2000) Zhang C, Kim SH (2000) Environment-dependent residue contact energies for proteins. PNAS 97:2550–2555.
- Zhang et al. (2004a) Zhang C, Liu S, Zhou H, Zhou Y (2004a) An accurate, residue-level, pair potential of mean force for folding and binding based on the distance-scaled, ideal-gas reference state. Protein Sci 13:400–411.
- Zhang et al. (2004b) Zhang C, Liu S, Zhou H, Zhou Y (2004b) The dependence of all-atom statistical potentials on structural training database. Biophys J 86(6):3349–58.
- Zhang et al. (2004c) Zhang C, Liu S, Zhou Y (2004c) The dependence of all-atom statistical potentials on training structural database. Biophys J 86:3349–3358.
- Zhang et al. (2005) Zhang C, Liu S, Zhu Q, Zhou Y (2005) A knowledge-based energy function for protein-ligand, protein-protein, and protein-dna complexes. J Med Chem 48:2325–35.
- Zhang et al. (1997) Zhang C, Vasmatzis1 G, Cornette JL, DeLisi C (1997) Determination of atomic desolvation energies from the structures of crystallized proteins. J Mol Biol 267.
- Zheng et al. (1997a) Zheng W, Cho SJ, Vaisman II, Tropsha A (1997a) A new approach to protein fold recognition based on delaunay tessellation of protein structure. Pac Symp Biocomput :486–497.
- Zheng et al. (1997b) Zheng W, Cho SJ, Vaisman II, Tropsha A (1997b) A new approach to protein fold recognition based on Delaunay tessellation of protein structure. In: Altman R, Dunker A, Hunter L, Klein T (eds.), Pacific Symposium on Biocomputing’97, World Scientific, Singapore, pp. 486–497.
- Zhou and Zhou (2002) Zhou H, Zhou Y (2002) Distance-scaled, finite ideal-gas reference state improves structure-derived potentials of mean force for structure selection and stability prediction. Protein Sci 11:2714–2726.