The effect of genome length on ejection forces
in bacteriophage lambda
Abstract
A variety of viruses tightly pack their genetic material into protein capsids that are barely large enough to enclose the genome. In particular, in bacteriophages, forces as high as 60 pN are encountered during packaging and ejection, produced by DNA bending elasticity and self-interactions. The high forces are believed to be important for the ejection process, though the extent of their involvement is not yet clear. As a result, there is a need for quantitative models and experiments that reveal the nature of the forces relevant to DNA ejection. Here we report measurements of the ejection forces for two different mutants of bacteriophage , b221cI26 and cI60, which differ in genome length by . As expected for a force-driven ejection mechanism, the osmotic pressure at which DNA release is completely inhibited varies with the genome length: we find inhibition pressures of 15 atm and 25 atm, respectively, values that are in agreement with our theoretical calculations.
1 Introduction
Over the past thirty years, a series of experiments and theoretical work have produced many insights about the importance of internal forces in the bacteriophage life cycle: Early measurements on capsids showed that they contained tightly packed DNA (Earnshaw and Harrison, 1977), and subsequent experiments established that DNA packed at these densities exerts a pressure of tens of atmospheres that is dependent on the density and salt conditions (Rau et al., 1984). Any effect of the genome length on its life cycle (independent of any particular genes) suggests that internal forces are important, and there are several such effects known: there are upper and lower bounds on the amount of DNA that can be packaged into a capsid (Feiss et al., 1977); mutants of with long genomes fail to grow without magnesium ions (Arber et al., 1983); and mutants with short genomes fail to infect pel- cells (Katsura, 1983). While magnesium ions reduce the forces between DNA, stabilizing the phage particles, DNA-condensing ions such as putrescine prevent DNA ejection (Katsura, 1983), and osmotic stress can stabilize the genome within phages (Serwer et al., 1983). The evidence seems to indicate that internal forces have an important role in the function of : phages with low forces can be incapable of ejecting their DNA forcefully enough to penetrate the cell, while phages with high forces are unable to package their genome or are unstable when fully packaged. A variety of theoretical models of DNA packaging in bacteriophage have been proposed (Riemer and Bloomfield, 1978; Black, 1989; Serwer, 1988; Tzlil et al., 2003; Purohit et al., 2003), but only recently have experiments begun to quantify the forces required to tightly pack DNA into capsids (Smith et al., 2001) and the forces driving DNA ejection (Evilevitch et al., 2003, 2005).
The aim of this paper is to study the effect of genome length on the ejection force of DNA, by comparing cI60, a simple mutant of the wild type with a 48.5 kbp genome, to b221cI26 (b221), which has a much shorter genome of 37.7 kbp (Bellett et al., 1971). The reason that measurements with different genome lengths are especially interesting is that simple models of the forces that arise during packaging depend in a precise way upon the genome length. To measure the force, a method reported earlier (Evilevitch et al., 2003) was used: osmotic stress was applied to the outside of the capsids during ejection, halting the ejection at the point where the internal and external forces balance. Using this method, we show that phages with shorter genomes have lower forces, phages with longer genomes eject their DNA with higher forces, and that straightforward theoretical models are sufficient to predict these effects.
2 Materials and Methods

Phages b221cI26 (b221) and cI60 were extracted from single plaques, grown in 3 L cultures of E. coli c600 cells, and purified by PEG precipitation, differential sedimentation, and equilibrium CsCl gradients, resulting in infectious particles. After purification, phages were dialyzed twice against a 500-fold greater volume of TM buffer (50 mM Tris, 10 mM , pH 7.4).
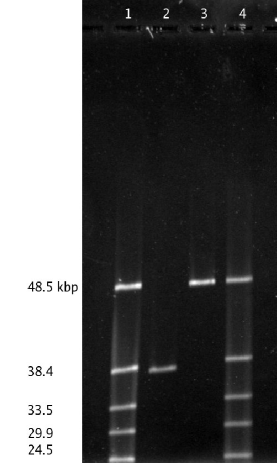
To check the genome lengths of the phages used in this experiment, we extracted the DNA with phenol and chloroform from approximately phages of each type into 500 L of 0.5x TBE buffer. A quantity of 1 L ( genomes, or 0.5 ng) was removed from each extraction, mixed with loading dye, heated briefly to 65∘C to separate cohesive ends, and pipetted into a 0.5x TBE, 1% agarose gel. A 10 ng quantity of a standard ladder (-mix, Fermentas) was included for size comparison. We ran the gel using the method of (Birren et al., 1990), with a simple electrophoresis box (Owl Separation Systems B1A) and a homebuilt voltage inverter, pulsed at 100 V forward, 60 V backward, for 19 h. The gel was stained with SYBR Gold (Molecular Probes) and photographed with an Alphaimager HP (Alpha Innotech). Dust was manually erased from the resulting image, which is shown in Fig. 1. Results were consistent with the expected 37.7 kbp genome for b221 and 48.5 kbp genome for cI60.
The receptor LamB (maltoporin), required to trigger ejection, was extracted from the membranes of E. coli pop154 cells. These cells express a lamB gene from S. sonnei known to be compatible with a variety of strains, allowing ejection in the absence of chloroform (Roa and Scandella, 1976; Graff et al., 2002). LamB was affinity-purified in amylose resin and dialyzed twice against TM buffer containing 1% n-octyl-oligo-oxyethylene (oPOE; Alexis Biochemicals #500-002-L005.)
Our method for measuring ejection forces is substantially the same as that described earlier (Evilevitch et al., 2003), with minor refinements that have improved precision. We paid particular attention to the difficulty of pipetting the viscous PEG solutions, trying to minimize systematic and statistical errors that occur when the solution adheres to the pipette tips. A solution of 50% (w/w) polyethylene glycol (PEG) 8000 (Fluka PEG Ultra) was prepared in TM buffer with 0.5% oPOE, and its density was measured at 1.09 g/ml (see also (González-Tello et al., 1994)). This solution was used to prepare solutions of PEG / TM 0.5–1% oPOE at various specified %(w/v) values (see Fig. 2) on an analytical balance. The mass measurements allowed us to set the quantity of PEG in each sample within 0.2 mg, which corresponds to an error in concentration of approximately 0.1% (w/v). Phage solution was added to a final concentration of /ml, and DNase I was added at 10 g/ml. The sample tubes were turned slowly for several minutes to mix the viscous PEG solutions. Purified LamB was added with a wide-mouth tip and the resulting 200 L solution was mixed quickly by pipetting. A wide-mouth tip is an inaccurate pipetting device, but it is necessary for quickly mixing viscous solutions. To minimize the effect of inaccurate pipetting on the measurements, we used a concentration of LamB that was sufficient for maximal ejection, estimated at g/ml by UV absorbance. After the addition of LamB, the samples were incubated for 1 h at 37∘C, which was sufficient for the reaction to reach its endpoint—complete digestion of the ejected genome fraction by DNase I. Finally, the capsids were separated from the ejected DNA fragments by a centrifugation for 20 h at .
After centrifugation, 120 L of supernatant from each tube was removed to a UV-transparent plastic cuvette (Ocean Optics UVettes) and DNA concentrations were measured with a UV–visible spectrophotometer (LKB Biochrom Ultrospec II). The absorbance curves were aligned at 300 nm (immediately after the DNA absorbance peak) to compensate for absorbance not due to DNA. The resulting curves are shown in Fig. 2. The absorbance values at 260 nm, , are linearly related to the amount of DNA ejected from the phage capsids. In contrast with earlier experiments, there was no measurable background DNA absorbance due to ruptured phage capsids: samples at high PEG concentrations or without LamB had similar values of to samples prepared without phages. This is probably because phages were used within one month of dialysis; in contrast, samples of b221 measured after five months of storage in TM buffer at 4∘C had a background .
When there is no PEG present, ejection reaches completion (100%), and when no phages are added there is no ejection (0%). Intermediate values were found with a linear interpolation:
| (1) |
An alternative procedure is to use no LamB as a calibration for 0% (Evilevitch et al., 2005).
The weight measurements set , the mass of PEG, and , the total mass, for each sample. The % (w/w) weight-weight fraction was computed as . The osmotic pressure at each PEG concentration was then determined with the empirical formula (Michel, 1983)
| (2) |
where T is the temperature (∘C) and . Note that the osmotic pressure is an increasing function of the PEG concentration and a decreasing function of temperature. For this experiment, .
Two complete sets of samples were prepared for each of cI60 and b221. Each sample has a statistical error due to weight measurements, pipetting, and spectrophotometry. To minimize systematic effects on the ejected fraction, the two “no phage” and “no PEG” tubes were averaged for each phage. Statistical errors were propagated to yield and error bars (see Fig. 3.)
3 Theoretical Model of DNA Packaging
Our theoretical model is based on earlier work (Riemer and Bloomfield, 1978; Tzlil et al., 2003; Purohit et al., 2003, 2005), which describes the packaging energy as a function of the length of DNA in the capsid. We model the capsid as a sphere and its genome as a long semiflexible rod. We assume that the rod is wound into a cylindrically symmetric spool (Cerritelli et al., 1997) with local hexagonal packing. The total energy of the packaged DNA can then be approximated by a sum of inter-axial repulsion energy and the bending energy of the rod:
| (3) |
where and are empirically determined constants describing the interaction between neighboring DNA double-helices, is the persistence length of DNA, is the length of the DNA within the capsid, is the inter-axial spacing, and are the radius of the capsid and the inner radius of the DNA spool, respectively, and is the number of loops of DNA at a distance from the spool axis. For the persistence length we use 50 nm, though its value in Mg2+ buffer may be 10% smaller (Hagerman, 1988). The spacing between sequential bases of DNA varies, depending on the base types, from 0.33 to 0.34 nm (Olson et al., 1998). To compute we disregard this variation and use 0.34 nm times the number of base pairs within the capsid. The inter-axial forces in buffers containing have been measured (Rau et al., 1984). Since the values measured for 5 mM and 25 mM were not significantly different, we assume that the forces at 10 mM (used in our experiments) will be identical. A least-squares fit to the 5 mM and 25 mM data in (Rau et al., 1984) gives and . The radius of the phage capsid is around nm (Earnshaw and Harrison, 1977). Once we know , , and , we can use Eq. 3 to calculate the internal force on the phage genome as a function of genome length inside the capsid, providing an interpretation of the experimental results.
We calculate the remaining variables as a function of according to the following recipe, which involves only simple geometrical considerations and elementary calculus. The number of loops in Eq. 3 is given by , where is the height of the capsid at distance from the central axis of the DNA spool. The actual volume occupied by the DNA spool can be related to the genome length and the inter-axial spacing to get an expression for in terms of , and (Purohit et al., 2003). This expression for is substituted into Eq. 3, which can then be minimized with respect to to give the equilibrium inter-axial spacing as a function of the genome length inside the capsid. From , , and , Eq. 3 now gives us the total packing energy as a function of genome length inside the capsid. The internal force acting on the genome is obtained by taking the derivative of Eq. 3 with respect to (Purohit et al., 2003).
The preceding construct is a parameter-free model that predicts the ejection force from a capsid. Experimental uncertainties in the quantities quoted above should lead to errors of – in the magnitude of the force predicted, but the shape and relative positions of the curves for different genome lengths should not be strongly affected by these errors (these tests of the parameters are not shown).
DNA ejection in our experiment or in vivo is halted at the point where the internal force balances the osmotic force. We have described above how to obtain the internal force (and hence, the external osmotic force because of the equilibrium) acting on the genome. But the experimental variable is an osmotic pressure (Tzlil et al., 2003). Thus we need to translate this force into a pressure. The force is given approximately by , where is the osmotic pressure and is the effective radius of the DNA. We take as 1.0 nm (bare DNA) plus 0.2 nm, half the PEG monomer length found experimentally (Abbot et al., 1992; Marsh, 2004). This is an exact formula for the osmotic force on a very large area. However, at the PEG concentrations used in our experiment, the diameter of DNA is comparable to the correlation length (mesh size) of PEG, 1–3 nm (de Gennes, 1979, pp.78–80), so the formula for is only approximately valid. A scaling expression for the correction could be used (de Vries, 2001; Castelnovo et al., 2003; Evilevitch et al., 2004), but since this result is good only up to a multiplicative constant, its importance is unclear. Hence, to maintain clarity in our analysis we do not use the correction. On the other hand, including this effect could result in a better fit between theory and experiment.
4 Results and Discussion

Fig. 3 shows our experimental results. Partial ejection in both b221 (37.7 kbp) and cI60 (48.5 kbp) corresponds closely to that measured earlier in EMBL3 (41.5 kbp): the ejected fraction decreases quickly to 50% at several atmospheres of osmotic pressure, then descends more slowly to 0%. (As shown by Evilevitch et al. (2005), this “ejected fraction” corresponds to all phages ejecting the same percentage of their DNA, rather than a percentage of the phages ejecting all of their DNA.) Most importantly, at every pressure where a measurable amount of DNA is ejected, b221 ejects less DNA than cI60. Conversely, at any point in the ejection process, the osmotic force on the DNA is always lower in b221 than in cI60. For example, the highest forces occur at the point where osmotic pressure completely inhibits the ejection of DNA. This inhibition pressure is in the range 10–15 atm for b221 and 20–25 atm for cI60 — a 100% increase in pressure results from a 30% increase in genome length.
An interesting dip (or bump) in the data is apparent between 1.5 and 3.4 atm. We observed this dip in all data sets collected for this experiment, but its cause is unknown.
Fig. 3 also shows the predictions of our parameter-free theory. Except for the dip, the theory predicts the data quite well. Both the absolute magnitude and the general shape of the curves are predicted correctly. This is a remarkable result because no fitting was done to match the theory to the data. A straightforward inverse-spool model of the DNA arrangement, taking into account only the measured bending elasticity and interaxial forces, correctly predicts the dependence of ejection force on genome length.
Our measurements can be compared with previous results on EMBL3 (Evilevitch et al., 2003), for which the genome length is 41.5 kbp. To do so, however, requires that the weight fractions be corrected in calculating the osmotic pressures, which we have done here for the rest of the data. In this earlier work, the osmotic pressures of the solutions were calculated from the %(w/v) concentrations, without taking into account the density of the PEG solution. Here, we convert it to %(w/w) taking into account the density of the PEG solution. The the density differences can be corrected using the relation between weight fraction and density of PEG solutions (González-Tello et al., 1994). After this correction, we find that the maximum pressure, for example, is 15 atm instead of 19.6 atm. The correction has a smaller effect at lower PEG concentrations; the difference at 10% (w/v) is only 0.2 atm. Fig. 3 shows a comparison between EMBL3 and the mutants used in the present study. Within the experimental uncertainty, the ejection curve for the intermediate length genome lies between those of the 48.5 kbp and 37.7 kbp phages reported here.
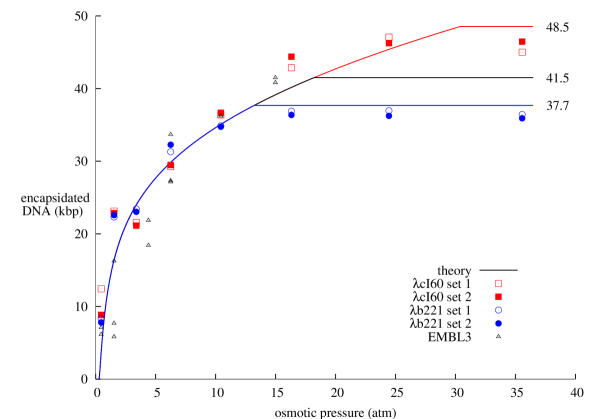
An alternative view of the ejection data is shown in Fig. 4. From the ejected fraction plotted in Fig. 3, we can compute the amount of DNA remaining in the capsid as , where is the number of base pairs in the genome. Since ejected DNA is digested by DNase I, the amount remaining in the capsid should depend only on the external osmotic pressure, and it should be independent of the genome size of the phage. Indeed, Fig. 4 shows that all of the data below 15 atm falls roughly on a single curve. Above 25 atm, the pressure is sufficient to hold the entire genome within the capsid, so the amount of encapsidated DNA is just equal to the genome length of the phage.
For cI60, which is almost identical to the wild-type , our model and measurements indicate that DNA is ejected with a force of around 10 pN that drops steadily as the genome enters the host cell. What advantage does gain from having such a high ejection force? For the phage DNA to enter the E. coli cell, it must overcome an internal osmotic pressure of (Neidhardt, 1996). Fig. 3 shows that cI60 can eject roughly 60% of its genome, 30 kbp, against this osmotic pressure. However, the rest of the genome must be actively transported into the cell. Reversible diffusion, in particular, is incapable of transporting the rest of the genome into cell, since the energy barrier that must be overcome is several times (Smith et al., 2001; Purohit et al., 2005). A two-step process is implied: first a quick pressure-driven injection of half of the DNA, then a slower protein-driven importation of the remainder (as, for example, by RNA polymerase in phage T7). This two-step process has been observed in vivo for the phages T5 (Letellier et al., 2004) and (González-Huici et al., 2004), though similar experiments have not been done on phage . For b221, Fig. 3 shows that only 40% of the genome, 15 kbp, is injected in the first step. Since phages with shorter genomes than cI60 are not infectious, we speculate that 15 kbp is close to the minimum amount of DNA required to initiate the second (non-pressure-driven) stage of importation.
In the case of bacteriophage T7, however, the entire genome is actively transported at a slow, constant speed (Molineux, 2001; Kemp et al., 2004), even though calculations indicate its internal pressure to be similar to that in (Purohit et al., 2005). Apparently, something unique to T7 slows down the process (perhaps the observed expulsion of internal proteins from the T7 capsid?), whereas most dsDNA bacteriophages experience a first stage of fast, pressure-driven ejection. Since ejection from is much faster (Novick and Baldeschwieler, 1988; Kemp et al., 2004) than from T7, it seems that is in this most common category. (As another example, recent experiments by de Frutos et al. (2005) and Mangenot et al. (2005) show that DNA ejection from bacteriophage T5 proceeds very rapidly between discrete stopping points along the genome. Furthermore, it has been shown in unpublished measurements that T5 ejection can be inhibited by external osmotic pressure.) In vivo ejection experiments with and in vitro experiments with T7 need to be done to explore the differences between these two phages.
5 Acknowledgments
We thank Alexandra Graff and Emir Berkane for providing protocols for the purification of LamB and the pop154 E. coli strain. Michael Feiss kindly sent us samples of the b221 and cI60 phages used here. We are indebted to Douglas Rees, Scott Fraser, Stephen Quake, and Grant Jensen for laboratory space and equipment; and to Ian Molineux, Jonathan Widom, and others for very helpful conversations. This work was supported by a grant from the Keck Foundation (to RP), an NIH Director’s Pioneer Award (to RP), NSF grant CMS-0301657 (to RP), and NSF grant CHE-0400363 (to CMK and WMG). PG was supported by an NSF graduate research fellowship. AE has received financial support from The Swedish Foundation for International Cooperation in Research and Higher Education (STINT) and the Swedish Research Council (VR).
References
- Abbot et al. (1992) Abbot, N. L., Blankschtein, D., and Hatton, T. A. (1992) Protein partitioning in two-phase aqueous polymer systems. 2. On the free energy of mixing globular colloids and flexible polymers. Macromolecules 25: 3917–3931.
- Arber et al. (1983) Arber, W., Enquist, L., Hohn, B., Murray, N. E., and Murray, K. (1983) Experimental methods for use with lambda. In Lambda II, Hendrix, R. W., Roberts, J. W., Stahl, F. W., and Weisberg, R. A., eds., Cold Spring Harbor, N.Y., pages 433–466.
- Bellett et al. (1971) Bellett, A. J. D., Busse, H. G., and Baldwin, R. L. (1971) Tandem genetic duplications in a derivative of phage lambda. In The Bacteriophage Lambda, Hershey, A. D., ed., Cold Spring Harbor, pages 501–513.
- Birren et al. (1990) Birren, B. W., Simon, M. I., and Lai, E. (1990) The basis of high resolution separation of small DNAs by asymmetric-voltage field inversion electrophoresis and its application to DNA sequencing gels. Nucleic Acids Res 18: 1481–1487.
- Black (1989) Black, L. (1989) DNA packaging in dsDNA bacteriophages. Annu Rev Microbiol 43: 267–292.
- Castelnovo et al. (2003) Castelnovo, M., Bowles, R. K., Reiss, H., and Gelbart, W. M. (2003) Osmotic force resisting chain insertion in a colloidal suspension. Eur Phys J E Soft Matter 10: 191–197.
- Cerritelli et al. (1997) Cerritelli, M. E., Cheng, B., Rosenberg, A. H., McPherson, C. E., Booy, F. P., and Steven, A. C. (1997) Encapsidated conformation of bacteriophage T7 DNA. Cell 91: 271–280.
- de Frutos et al. (2005) de Frutos, M., Letellier, L., and Raspaud, E. (2005) DNA ejection from bacteriophage T5: analysis of the kinetics and energetics. Biophys J 88: 1364–70.
- de Gennes (1979) de Gennes, P.-G. (1979) Scaling concepts in polymer physics. Ithaca, NY: Cornell University Press.
- de Vries (2001) de Vries, R. (2001) Flexible polymer-induced condensation and bundle formation of DNA and F-actin filaments. Biophys J 80: 1186–1194.
- Earnshaw and Harrison (1977) Earnshaw, W. C. and Harrison, S. C. (1977) DNA arrangement in isometric phage heads. Nature 268: 598–602.
- Evilevitch et al. (2004) Evilevitch, A., Castelnovo, M., Knobler, C. M., and Gelbart, W. M. (2004) Measuring the force ejecting DNA from phage. J Phys Chem B 108: 6838–6843.
- Evilevitch et al. (2005) Evilevitch, A., Gober, J. W., Phillips, M., Knobler, C. M., and Gelbart, W. M. (2005) Measurements of DNA lengths remaining in a viral capsid after osmotically suppressed partial ejection. Biophys J 88: 751–6.
- Evilevitch et al. (2003) Evilevitch, A., Lavelle, L., Knobler, C. M., Raspaud, E., and Gelbart, W. M. (2003) Osmotic pressure inhibition of DNA ejection from phage. Proc Natl Acad Sci U S A 100: 9292–5.
- Feiss et al. (1977) Feiss, M., Fisher, R. A., Crayton, M. A., and Egner, C. (1977) Packaging of the bacteriophage chromosome: Effect of chromosome length. Virology 77: 281–293.
- González-Huici et al. (2004) González-Huici, V., Salas, M., and Hermoso, J. M. (2004) The push-pull mechanism of bacteriophage 29 DNA injection. Mol Microbiol 52: 529–540.
- González-Tello et al. (1994) González-Tello, P., Camcacho, F., and Blázquez, G. (1994) Density and viscosity of concentrated aqueous solutions of polyethylene glycol. J Chem Eng Data 39: 611–614.
- Graff et al. (2002) Graff, A., Sauer, M., Gelder, P. V., and Meier, W. (2002) Virus-assisted loading of polymer nanocontainer. Proc Natl Acad Sci U S A 99: 5064–8.
- Hagerman (1988) Hagerman, P. J. (1988) Flexibility of DNA. Annu Rev Biophys Biophys Chem 17: 265–86.
- Katsura (1983) Katsura, I. (1983) Tail assembly and injection. In Lambda II, Hendrix, R. W., Roberts, J. W., Stahl, F. W., and Weisberg, R. A., eds., Cold Spring Harbor, N.Y., pages 331–346.
- Kemp et al. (2004) Kemp, P., Gupta, M., and Molineux, I. J. (2004) Bacteriophage T7 DNA ejection into cells is initiated by an enzyme-like mechanism. Mol Microbiol 53: 1251–1265.
- Letellier et al. (2004) Letellier, L., Boulanger, P., Plançon, L., Jacquot, P., and Santamaria, M. (2004) Main features on tailed phage, host recognition and DNA uptake. Front Biosci 9: 1228–1339.
- Mangenot et al. (2005) Mangenot, S., Hochrein, M., Rädler, J., and Letellier, L. (2005) Real-time imaging of DNA ejection from single phage particles. Curr Biol 15: 430–5.
- Marsh (2004) Marsh, D. (2004) Scaling and mean-field theories applied to polymer brushes. Biophys J 86: 2630–2633.
- Michel (1983) Michel, B. E. (1983) Evaluation of the water potentials of solutions of polyethylene glycol 8000 both in the absence and presence of other solutes. Plant Physiol 72: 66–70.
- Molineux (2001) Molineux, I. (2001) No syringes please, ejection of T7 DNA from the virion is enzyme driven. Mol Microbiol 40: 1–8.
- Neidhardt (1996) Neidhardt, F. (ed.) (1996) Escherichia Coli and Salmonella Typhimurium. ASM Press.
- Novick and Baldeschwieler (1988) Novick, S. L. and Baldeschwieler, J. D. (1988) Fluorescence measurement of the kinetics of DNA injection by bacteriophage lambda into liposomes. Biochemistry 27: 7919–24.
- Olson et al. (1998) Olson, W. K., Gorin, A. A., Lu, X. J., Hock, L. M., and Zhurkin, V. B. (1998) DNA sequence-dependent deformability deduced from protein-DNA crystal complexes. Proc Natl Acad Sci U S A 95: 11163–8.
- Purohit et al. (2005) Purohit, P. K., Inamdar, M. M., Grayson, P. D., Squires, T. M., Kondev, J., and Phillips, R. (2005) Forces during bacteriophage dna packaging and ejection. Biophys J 88: 851–66.
- Purohit et al. (2003) Purohit, P. K., Kondev, J., and Phillips, R. (2003) Mechanics of DNA packaging in viruses. Proc Natl Acad Sci U S A 100: 3173–8.
- Rau et al. (1984) Rau, D. C., Lee, B., and Parsegian, V. A. (1984) Measurement of the repulsive force between polyelectrolyte molecules in ionic solution: hydration forces between parallel DNA double helices. Proc Natl Acad Sci U S A 81: 2621–5.
- Riemer and Bloomfield (1978) Riemer, S. C. and Bloomfield, V. A. (1978) Packaging of DNA in bacteriophage heads: some considerations on energetics. Biopolymers 17: 785–94.
- Roa and Scandella (1976) Roa, M. and Scandella, D. (1976) Multiple steps during the interaction between coliphage lambda and its receptor protein in vitro. Virology 72: 182–94.
- Serwer (1988) Serwer, P. (1988) The source of energy for bacteriophage DNA packaging: An osmotic pump explains the data. Biopolymers 27: 165–169.
- Serwer et al. (1983) Serwer, P., Masker, W. E., and Allen, J. L. (1983) Stability and in vitro DNA packaging of bacteriophages: effects of dextrans, sugars, and polyols. J Virol 45: 665–71.
- Smith et al. (2001) Smith, D., Tans, S., Smith, S., Grimes, S., Anderson, D., and Bustamante, C. (2001) The bacteriophage phi29 portal motor can package DNA against a large internal force. Nature 413: 748–752.
- Tzlil et al. (2003) Tzlil, S., Kindt, J. T., Gelbart, W. M., and Ben-Shaul, A. (2003) Forces and pressures in DNA packaging and release from viral capsids. Biophys J 84: 1616–27.