Ubiquity of Log-normal Distributions in
Intra-cellular Reaction Dynamics
Chikara Furusawa11footnotemark: 1 55footnotemark: 5, Takao Suzuki22footnotemark: 2, Akiko Kashiwagi11footnotemark: 1,
Tetsuya Yomo11footnotemark: 1 22footnotemark: 2 33footnotemark: 3 44footnotemark: 4 55footnotemark: 5, Kunihiko Kaneko33footnotemark: 3 44footnotemark: 4 55footnotemark: 5
Department of Bioinformatics Engineering, Graduate School of
Information Science and Technology, Osaka University, 2-1 Yamadaoka, Suita, Osaka 565-0871, Japan
22footnotemark: 2 Department of Biotechnology, Graduate School of Engineering, Osaka University, 2-1 Yamadaoka, Suita, Osaka 565-0871, Japan
33footnotemark: 3 Graduate School of Frontier Biosciences, Osaka University
1-3 Yamadaoka, Suita, Osaka 565-0871, Japan
44footnotemark: 4 Department of Pure and Applied Sciences, Univ. of Tokyo
Komaba, Meguro-ku, Tokyo 153-8902, Japan
55footnotemark: 5 ERATO Complex Systems Biology Project, JST , 3-8-1 Komaba, Meguro-ku,
Tokyo 153-8902, Japan
Corresponding Author: Kunihiko Kaneko
Department of Pure and Applied Sciences, Univ. of Tokyo,
Komaba, Meguro-ku, Tokyo 153-8902, Japan
Tel/FAX: +81-3-5454-6746
E-mail: kaneko@complex.c.u-tokyo.ac.jp
Abstract
The discovery of two fundamental laws concerning cellular dynamics with recursive growth is reported. First, the chemical abundances measured over many cells are found to obey a log-normal distribution and second, the relationship between the average and standard deviation of the abundances is found to be linear. The ubiquity of the laws is explored both theoretically and experimentally. First by means of a model with a catalytic reaction network, the laws are shown to appear near the critical state with efficient self-reproduction. Second by measuring distributions of fluorescent proteins in bacteria cells the ubiquity of log-normal distribution of protein abundances is confirmed. Relevance of these findings to cellular function and biological plasticity is briefly discussed.
Keywords: log-normal distribution, fluctuation, recursive growth
1 introduction
The search for universal statistics with regards to fluctuations in cellular dynamics is an important topic in biophysics. Generally, the molecule numbers of the various chemical species (e.g., proteins) change from cell to cell. Since many intra-cellular reaction processes are finely tuned to specific functions, one would initially expect the number distributions of the involved chemical species to be sharp in order to suppress fluctuations. In reality, however, they are far from sharp, and large fluctuations do occur. In order to understand how cells can nevertheless function, it is essential to gain insight into the statistics of the chemical abundances.
Indeed, fluctuations in cellular processes have extensively been studied in stochastic gene expressions and signal transduction these days [1, 2, 3, 4, 5]. In particular, significant advances have been made in the study of their distributions using fluorescent proteins [6, 7]. In light of these recent advances, it is important to search for general laws that hold for such distributions.
Previously we found a universal power-law distribution in the average abundances of chemicals in cells, by using a simple reaction network model [8]. The theoretical conclusions were confirmed with the help of a large-scale gene expression data [8, 9, 10]. The above power law concerns the average over all chemical species and forms a first step in the study of universal statistics in cellular dynamics. As a next step, it is important to explore universal characteristics with regards to the distribution of each chemical over the cells.
Here, we report two basic laws for the number distributions of chemicals in cells that grow recursively. The first law is a log-normal distribution of chemical abundances measured over many cells, and the second law is a linear relationship between the average and standard deviation of chemical abundances. We give a heuristic argument as to why these laws should hold for a cell with steady growth, and demonstrate them numerically using a simple model for a cell with an internal reaction network. Lastly, the results of an experimental study confirming the two laws are presented.
Indeed, the log-normal distribution is clearly different from the Gaussian distribution normally adopted in the study of statistical fluctuations, and has a much larger tail for greater abundances. Hence the generality of the laws we report is of considerable significance for all the statistical studies of cellular fluctuations, and is essential to understanding cellular function, adaptation, and evolution.
2 Heuristic Argument
Cells contain huge numbers of chemicals that catalyze each other and form complex networks. For a cell to replicate itself recursively, a set of chemicals has to be synthesized from nutrients supplied from the outside through biochemical processes driven by the same set of chemicals. Consequently, it is natural to consider an auto-catalytic process as the basis of biochemical dynamics within replicating cells.
As a very simple illustration, let us consider an auto-catalytic process where a molecule (or a set of molecules) is replicated with the aid of other molecules. Then, the growth of the number of the molecule species is given by with describing the rates of the reaction processes that synthesize the molecule . Clearly, this kind of synthetic reaction process depends on the number of the molecules involved in the catalytic process. At the same time, however, all chemical reaction processes are inevitably accompanied by fluctuations arising from the stochastic collisions of chemicals. Thus, even when the reactions that synthesize a specific chemical to subsequently convert it to other chemicals are balanced in a steady state, fluctuation terms will remain. Consequently, the above rate has fluctuations around its temporal average such that , and hence we obtain
| (1) |
In other words, the logarithm of the chemical abundances shows Brownian motion around its mean, as long as is approximated by random noise. Accordingly, one would expect the logarithm of the chemical abundances (i.e. molecule numbers) to obey a normal (Gaussian) distribution (this kind of a distribution is known as a log-normal distribution)[11]. In contrast to the Gaussian distribution, the log-normal distribution has a longer tail representing the higher frequencies of greater abundances when plotted in the original scale without taking the logarithm.
In general, at each step of the auto-catalytic process, a multiplicative stochastic factor can appear. Consequently, the log-normal distribution of chemical abundances, rather than the Gaussian distribution, may be common for cells that reproduce recursively.
Of course, the above argument is too simplistic to describe the dynamics of actual cells. For example, the fluctuations could be suppressed since the increase in chemical abundance does not continue for ever due to cell divisions which might thus alter the form of the distribution. Furthermore, in a complex biochemical reaction network, several reaction processes may work in parallel for the replication of a chemical. This leads to the addition of fluctuation terms, and the central limit theorem of probability theory might imply that the distribution becomes Gaussian.
Hence it is a priori far from clear whether the simple argument to support the log-normal distribution is valid or not. Nevertheless, since the log-normal distribution is rather different from the standard Gaussian distribution, its universality is of great importance for understanding the fluctuations in cells and stochastic gene expressions. Here we will confirm the validity of the law both theoretically and experimentally.
3 Model Study with Catalytic Reaction Network
In order to search for universal laws of replicating cells which are independent of details, we employ a simple reaction network model following Ref.8. Consider a cell consisting of a variety of chemicals. The internal state of the cell can be represented by a set of numbers , where is the number of molecules of the chemical species with ranging from to . We choose a randomly generated catalytic network among these chemicals, where each reaction from some chemical to some chemical is assumed to be catalyzed by a third chemical , that is . For simplicity all the reaction coefficients were chosen to be equal while the connection paths of this catalytic network were chosen randomly such that the probability of any two chemicals and to be connected is given by the connection rate .
Some chemicals diffuse between the cell and the environment with the diffusion coefficient . Among the penetrable chemicals, nutrients without catalytic activity are supplied by the environment. Through the catalytic reactions to synthesize impenetrable chemicals, the total amount of chemicals in a cell can increase, and when the total amount of chemicals is beyond some threshold , the cell is divided into two. This growth and division processes is repeated. In the numerical simulations, we randomly pick up a pair of molecules in a cell, and transform them according to the reaction network. In the same way, diffusion through the membrane is also computed by randomly choosing molecules inside the cell and nutrients in the environment (see Ref.8 for details of the model).
As the diffusion coefficient
is increased, the growth speed of the cell increases up to a
critical value after which
the cell ceases growing because
the flow of nutrients from the environment is so fast that
the internal reactions transforming them into chemicals sustaining its
‘metabolism’ cannot keep up.
As discussed in Ref.8, the intra-cellular dynamics
at is biologically relevant due to
the efficient recursive growth for this value and
its statistical property of chemical abundances, i.e.,
the power-law distribution with exponent -1 which is confirmed
experimentally for almost all cells we investigated.
Accordingly, this simple model captures enough basic properties of a
cell
to adequately reflect universal statistical
properties and we therefore choose it to measure the distribution of
each chemical’s abundance over many cells, by sampling them over a large
number of divisions.
Results of Simulations.
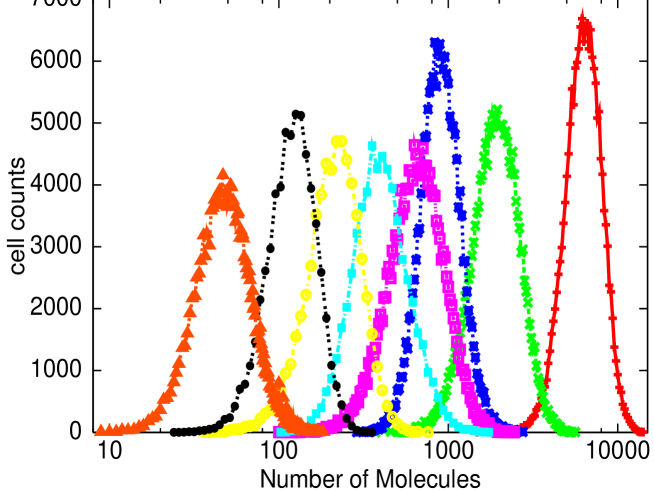
In Fig.1, the number distributions of several chemicals for
are plotted [12].
Here we measure the number of molecules of each chemical
when a cell divides into two and
the distribution indeed is nearly log-normal. I.e.
| (2) |
where indicates the average of over the cells.
This log-normal distribution holds for the abundances of all chemicals except for those that are supplied externally as nutrients which obey the standard Gaussian distribution. In other words, those molecules that are reproduced in a cell obey a log-normal distribution, while nutrients that are just transported from the outside of a cell follow a Gaussian distribution.
Why would the log-normal distribution law generally hold, in spite of the fact that the central limit theorem implies that the addition of several fluctuation terms should lead to a more Gaussian distribution? This can be understood by considering that the recursive production process is a cascade reaction near the critical state [8]. At this point, a small part of the possible reaction pathways is dominant and organized in a cascade of catalytic reactions so that a chemical in the -th group is catalyzed by a chemical in the group. In other words, a ”modular structure” with groups of successive catalytic reactions is self-organized in the network. In this cascade of catalytic reactions, fluctuations propagate “multiplicatively”; for example, the concentration fluctuation of a chemical in the -th group influences multiplicatively that of the -th group, which then influences multiplicatively that of the -th group, and so forth. The result of this multiplicative effect is the log-normal distribution of [13]. Note that, at the critical state with which we are concerned, this cascade of catalytic reactions continues over all chemical species that are reproduced, and that the log-normal distribution holds clearly. The importance of cascade process for log-normal distribution is also studied in the theory of turbulence [14], where energy cascade leads to multiplicative creation of vortices. In the present case, cascade in the catalytic reaction is essential to the log-normal distribution.
The width of the distribution for each chemical shown in Fig.1 looks almost independent of its average. This suggests a connection between the fluctuations and the averages of the chemicals. We therefore plotted the standard deviation of each chemical as a function of the average in Fig.2 and indeed found a linear relationship between the standard deviation (not the variance) and the average number of molecules. This can be understood by considering the steady growth and cascade structure of the catalytic reactions. Take two chemicals and , one of which () catalyzes the synthesis of the other in the cascade. During the steady growth phase of a cell, the synthesis and conversion of chemical should be balanced, i.e., , where and are average concentrations of other chemicals involved in the catalytic reaction. The average concentration then satisfies . Taking into account that the relation remains satisfied as increase while the cell grows, it is rather natural to assume that the relationship holds for the fluctuations of the average as well: . Hence the variance is expected to be proportional to the square of the mean, yielding the linear relationship between the mean and the standard deviation.
A linear relationship is also found as with regards to the variation of the chemical abundances when changing the external conditions. For example, we computed the change from to by varying the concentrations of the supplied nutrients. The variation is again found to be proportional to for each chemical , similar to the data plotted in Fig.2.
Through extensive simulations of a variety of related models, we have confirmed that the discovered laws hold generally and do not rely on the details of the model, such as the kinetic rules of the reactions, or the structure of reaction network including networks with heterogeneous path connectivity as scale-free topology. They are universal properties of replicating cellular systems near the critical state .
Of course, the arguments for the two laws thus far are based on the recursive production of a cell. In general, there can be deviations from the two laws, if the steady growth condition for a cell is not satisfied. In the present case, for example, recursive production is not possible when the parameter is much smaller than as all the possible reaction pathways occur with similar weights and the cascade of catalytic reactions is replaced by a random reaction network. In this case, the fluctuations of the molecule numbers are highly suppressed, and the distributions are close to normal Gaussian. The multiplicative stochastic process supported by the cascade of catalytic reaction is replaced by several parallel catalytic processes, and the central limit theorem for the addition of stochastic processes would lead to Gaussian distribution of chemicals.
Furthermore, we have confirmed numerically that the variance (not the standard deviation) increases linearly with the average concentrations. In other words, the ”normal” behavior expected from the central limit theorem is observed.
4 Experiment
Now, we report experimental confirmations of the two basic laws on the distributions of abundances. Recalling that the laws are expected to hold for the abundances of a protein synthesized within cells with recursive (steady) growth, we measured the distribution of the protein abundances in Escherichia coli that are in the exponential phase of growth, i.e., in a stage of steady growth [15]. To obtain the distribution of the protein abundances, we introduced the fluorescent proteins with appropriate promoters into the cells, and measured the fluorescence intensity by flow cytometry. To demonstrate the universality of the laws, we have carried out several sets of experiments by using a variety of promoters and also by changing places that the reporter genes are introduced (i.e., on the plasmid and on the genome).
The detailed experimental procedures are as follows.
Methods of Experiments.
Plasmids and Strains. Reporter plasmids were constructed by subcloning tetA promoter from pASK-IBA3 (Sigma Genosys) and egfp gene (BD Biosciences Clontech) into pPROTet.E 6xHN(BD Biosciences Clontech) and dsred.t4 gene coding red fluorescence protein (RFP)[16] into pTrc99A (Amersham Biosciences). E. coli strain OSU2, a derivative of DH5 that lacks glutamine synthetase gene, was transformed with these reporter plasmids. E. coli strain OSU5 was constructed by replacing glnA gene with tetA promoter and gls-h [17] fused with gfpuv5 [18] gene by homologous recombination [19].
Culture and Measurements.
Cultures of strain OSU2 with reporter plasmid
were grown in LB medium with 100 g/ml ampicilline for 6h at 37oC. To
obtain the high expression level of RFP, the culture was grown to
mid-exponential growth and then induced with 1 mM isopropyl- -
D-thiogalactoside (IPTG) for 3h at 37oC. E. coli OSU5 was grown in
minimal medium (0.1 M Sodium L-Glutamate Monohydrate, 4g/l glucose,
10.5g/l , 4.5g/l , 50mg/l , 50mg/l thiamine HCl,
10M , 0.5M , micronutrient solution [20], 25g/ml
kanamycine ) for 24 h at 37oC.
All expression data were collected using COULTER®EPICS®ELITE flow cytometer with a 488-nm argon excitation
laser and bandpass filter at 525 25 nm for GFP fluorescence and
600-nm dichroic filter for RFP fluorescence. For each culture, 10,000
events were collected.
We have confirmed that it is within its dynamics range,
by using commercialized beads with known-amount of fluorescent dyes.
All flow data were converted to text format using
WinMDI Version 2.8.
Results of Experiments.
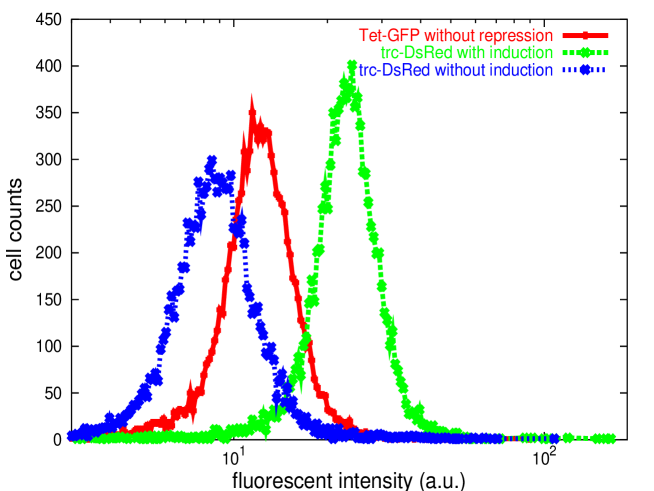
In Fig.3, we have plotted the distributions of the emitted fluorescence intensity from Escherichia coli cells with the reporter plasmids containing either EGFP (enhanced green fluorescent protein) under the control of the tetA promoter without repression, or DsRed.T4 (monomeric red fluorescent protein) under the control of the trc promoter with and without IPTG induction [21]. In general, the fluorescence intensity (the abundance of the protein) increases with the cell size. To avoid the effect of variation of cell size, which may also obey log-normal distribution, we normalized the fluorescence intensity by the volume of each cell. Here we adopt the forward-scatter (FS) signal from the flow cytometry, to estimate the cell volume. Indeed, by plotting data of the fluorescence intensity versus FS signal, the two are proportional on the average. (The data points are distributed around the proportionality line between the two, as are generally observed for the plot of fluorescence intensity by flow cytometry). Hence, we normalized the fluorescence intensity by dividing the FS signal. Fig.3 is the distribution of this normalized fluorescence intensity. Note that all these data are fitted well by log-normal, rather than Gaussian, distributions, even though each of the expressions is controlled by a different condition of the promoter.
To clarify the existence of larger tail for greater abundances of proteins, in Fig. 4, we have plotted the distribution of protein abundances both in the logarithmic scale and in the normal scale. The abundances of fluorescent protein expressed from the chromosome is also found to obey the log-normal distribution, as shown in Fig.4. Here, the data are obtained by Escherichia coli cells with an expression of glutamine synthetase (GS) fused to GFP in the chromosome, whose expression is controlled by the upstream tetA promoter. In Fig.4, plotted is the distribution of fluorescence intensity again normalized by the cell volume. As can be seen, when using the logarithmic scale (a), the distribution is roughly symmetric and close to Gaussian, while when using the normal scale (b), the distribution has a larger tail on the side of greater abundances. The fact that the log-normal distributions are also observed when genes are located on the genome indicates that the nature of log-normal distribution is not due to the variation in plasmid copy number. We have also examined several other cases using different reporter genes both on the plasmids and on the genome, and obtained similar results supporting the universality of the log-normal distributions. It is furthermore interesting to note that the abundances of the fluorescent proteins, reported in the literature so far, are often plotted with a logarithmic scale[7].
It should be noted that the log-normal distribution of protein abundances is observed when the E. coli are in the exponential phase of growth, i.e., when the bacteria are in the steady growth stage. For other phases of growth without steady growth, the distribution is found to be often deviated from the log-normal distribution, and sometimes show distribution with double peaks, as will be reported in future. Note that the theory also supports the log-normal distribution for the steady growth case only.
As for the linear relationship between the variation and the average, Banerjee et al. [22] recently reported that the standard deviation of gene expressions in cell population is proportional to the average expression level, which support the relationship discovered in our study. However, using a different system, Ozbudak et al. [23] showed that the standard deviation of gene expression is not proportional to its average, but the variance increases linearly with the average. However, in these studies, the dynamic ranges of the measurements are relatively narrow and the growth conditions of cells are not kept precisely in the log phase, so that the condition for the steady growth is not satisfied. To confirm the linear relationship between the standard deviation and the average, further experimental studies with a wide dynamic range of measurements and precise control of the steady cellular growth are required.
5 Discussion
To sum up, we have reported universal laws on the distributions of chemical abundances in cells with steady growth. First, the distribution of chemical abundance obeys the log-normal distribution due to the multiplicative propagation of fluctuations. Second, there is a linear relationship between the average and standard deviation of chemical abundances. Since the laws generally appear near the critical state , and the dynamics at the critical state provides a faithful and efficient self-reproduction of a cell [8], it is natural to conclude that cells generally hold these laws. We have also shown the experimental confirmations of the law using E. coli cells, where the number distributions of fluorescent proteins obey the log-normal distribution independent of the conditions of promoters and locations of reporter genes. The ubiquity of the discovered log-normal distributions can be a solid basis for the study of fluctuations in cells. It should be stressed that the log-normal distribution of chemical abundances implies that the average magnitude of the fluctuations is much larger than what one would observe for the normal distribution. However, at the present time, analysis of cellular heterogeneity mostly relies on the Gaussian distribution in the abundance of chemicals. Hence, our discovery for the ubiquity of log-normal distribution sets drastic and essential changes to future studies concerning with fluctuations in cellular dynamics.
Clearly, these laws bear relevance to adaptation and evolution[24] as well since the role of phenotypic fluctuations cannot be neglected. With these two laws in mind, it is therefore important to further study how cells maintain their functions and replicate themselves successfully despite being subjected to such large fluctuations, and to search for possible relationships between the topology of the reaction networks and the fluctuations in intra-cellular reaction dynamics. In relation, the search for some ‘exceptional’ chemicals that do not follow the log-normal distribution that may be located at specific positions in the network will be interesting. Indeed, the log-normal distribution appears as a result of multiplicative propagation of noise in cascade catalytic reaction process, and the distribution could be sharpened by interference of parallel reaction processes, including negative feed-back loop.
Finally, we note again that the observed laws hold for a cell that grows recursively. For cells undergoing the change of the states, the distribution could be distorted or have double peaks, as observed when the condition of culture is changed or in the course of cell differentiation. The present two laws could be a basis for studying such change of distribution as a measure of biological plasticity.
We would like to thank K. Sato and K. Ohnuma for stimulating discussions and Frederick H. Willeboordse for critical reading of the manuscript. Grant-in-Aids for Scientific Research from the Ministry of Education, Science and Culture of Japan (11CE2006).
References
- [1] Hasty, J., Paradines, P., Dolnik, M., & Collins, J.J. Noise-based switches and amplifiers for gene expression. Proc. Natl. Acad. Sci. USA 97, 2075-2080 (2000).
- [2] McAdams, J.J. & Arkin, A. Stochastic mechanisms in gene expression. Proc. Natl. Acad. Sci. USA 94, 814-819 (1997).
- [3] Swain, S.P., Elowitz, M.B. & Siggia, E.D. Intrinsic and Extrinsic contributions to stochasticity in gene expression. Proc. Natl. Acad. Sci. USA 99, 12795-800 (2002).
- [4] Ueda, M., et al. Single-Molecule Analysis of Chemotactic Signaling in Dictyostelium Cells. Science 294:(5543), 864-867 (2001).
- [5] Paulsson, J. Summing up the noise in gene networks. Nature 427, 415-418 (2004).
- [6] Elowitz, M.B., Levine, A.J., Siggia, E.D & Swain, P.S. Stochastic gene expression in a single cell. Science 297, 1183-1186 (2002).
- [7] Blake, W.J., et al. Noise in eukaryotic gene expression. Nature 422, 633-637 (2003).
- [8] Furusawa, C. & Kaneko, K. Zipf’s law in gene expression. Phys. Rev. Lett. 90, 088102 (2003)
- [9] Ueda, H., et al., Universality and flexibility in gene expression from bacteria to human. Proc. Natl. Acad. Sci. USA. 101(11), 3765-3769 (2004).
- [10] Kuznetsov, V.A, Knott, G. D., Bonner R. F., General Statistics of Stochastic Process of Gene Expression in Eukaryotic Cells. Genetics 161, 1321-1332 (2002)
- [11] Kaneko, K. Recursiveness, Switching, and Fluctuations in a Replicating Catalytic Network. Phys. Rev. E 68 031909 (2003).
- [12] In the simulation used to generate Fig.1, the total number of molecules is much larger than the number of chemical species . In this case, the population ratios generally fall into a unique steady state and fluctuate around it, while the daughter cells inherit the chemical compositions of their mother cells. On the other hand, when , the population ratios do not settle down and can change from generation to generation. In this case, the number distribution of each chemical does not obey the log-normal distribution as shown in Fig.1, but seems to follow a Poisson-like distribution.
- [13] The heuristic argument on the log-normal distribution in §2 intended for auto-catalytic processes is not directly applicable here, since in the present study, catalysts are generally other molecule species, and such direct auto-catalytic process is not particularly enhanced. Still, some revision might be possible, since a set of chemical species could work as an auto-catalytic set to synthesize the same set of chemicals, for a recursive production of a cell.
- [14] Kolmogorov, A.N. A refinement of previous hypotheses concerning the local structure of turbulence J. Fluid Mech. 13, 82-85 (1962).
- [15] Concentration dynamics of a given protein is controlled by many factors, including concentrations of transcriptional factors, several subunits of RNA polymerases, ribosomal proteins, RNA and protein degradations, number of plasmids, and so forth. Since these factors regulate each other through chemical reactions, it is natural to describe the dynamics of a protein concentration using a network of reactions as our model.
- [16] Bevis, B.J. & Glick, B.S. BS Rapidly maturing variants of the Discosoma red fluorescent protein (DsRed). Nature Biotech. 20, 83-87 (2003).
- [17] Xu, W-Z., Fukuhara, J., Yamamoto, K., Yomo, T., & Urabe, I. Random mutagenesis of glutamine synthetase from Escherichia coli: correlation between structure, activity, and fitness. Journal of fermentation and bioengineering 77(3), 252-258 (1994).
- [18] Ito, Y., Kawata, T., Urabe, I., & Yomo, T., Evolution of an arbitrary sequence in solubility. Journal of Molecular Evolution, 58(2), 196-202, (2004).
- [19] Datsenko, K. A. & Wanner, B. L. One-step inactivation of chromosomal genes in Escherichia coli K-12 using PCR products. Proc. Natl. Acad. Sci. USA 97(12), 6640-6645 (2000).
- [20] Neidhardt, F. C., Bloch, P. L., & Smith D. F., Culture medium for enterobacteria. Jour. Bacteriol. 119, 736-747 (1974).
- [21] Amann, E., Ochs, B. & Abel, K.I., Tightly regulated tac promoter vectors useful for the expression of unfused and fused proteins in Escherichia coli. Gene 69(2), 301-315 (1988)
- [22] Banerjee, B., et al., Tracking Operator State Fluctuations in Gene Expression in Single Cells. Biophys. Jour. 86, 3052-3059 (2004).
- [23] Ozbudak, E. M., et al, Regulation of noise in the expression of a single gene. Nature Genetics 31, 69-73 (2002).
- [24] K. Sato, et al., On the relation between fluctuation and response in biological systems. Proc. Nat. Acad. Sci. USA 100, 14086-14090 (2003).
Figure regends
Fig.1.
The number distribution of the molecules of chemical
abundances of our model.
Distributions are plotted
for several chemical species with different average molecule numbers.
The data were obtained by observing 178800 cell divisions.
Fig.2.
Standard deviation versus average number of molecules.
Using the same data set and parameters as for Fig.1,
the relationship between
the average and standard deviation is plotted for all chemical species.
The solid line is for reference.
Fig.3.
The number distribution of the proteins measured by fluorescence
intensity, normalized by the cell volume.
Distributions are obtained from three Escherichia coli cell
populations
containing different reporter plasmids (see text).
Note that, although the IPTG induction changes the average fluorescence
intensity,
both the distributions (with and without the induction) can be fitted
by log-normal distributions well.
Fig.4.
The distribution of the fluorescence intensity normalized by the cell
volume, plotted (a) with a logarithmic scale and (b) with a normal scale.
Data are obtained from a population of isogenic bacterial
cells with an expression of GFP-GS fusion protein in the chromosome.
It is clear that the distribution with the logarithmic scale is
symmetric and close to a Gaussian form.