SARS outbreaks in Ontario, Hong Kong and Singapore: the role of diagnosis and isolation as a control mechanism
Abstract
In this article we use global and regional data from the SARS epidemic in conjunction with a model of susceptible, exposed, infective, diagnosed, and recovered classes of people (“SEIJR”) to extract average properties and rate constants for those populations. The model is fitted to data from the Ontario (Toronto) in Canada, Hong Kong in China and Singapore outbreaks and predictions are made based on various assumptions and observations, including the current effect of isolating individuals diagnosed with SARS. The epidemic dynamics for Hong Kong and Singapore appear to be different from the dynamics in Toronto, Ontario. Toronto shows a very rapid increase in the number of cases between March 31st and April 6th, followed by a significant slowing in the number of new cases. We explain this as the result of an increase in the diagnostic rate and in the effectiveness of patient isolation after March 26th. Our best estimates are consistent with SARS eventually being contained in Toronto, although the time of containment is sensitive to the parameters in our model. It is shown that despite the empirically modeled heterogeneity in transmission, SARS’ average reproductive number is , a value quite similar to that computed for some strains of influenza [2]. Although it would not be surprising to see levels of SARS infection higher than ten per cent in some regions of the world (if unchecked), lack of data and the observed heterogeneity and sensitivity of parameters prevent us from predicting the long-term impact of SARS. The possibility that 10 or more percent of the world population at risk could eventually be infected with the virus in conjunction with a mortality rate of three-to-seven percent or more, and indications of significant improvement in Toronto support the stringent measures that have been taken to isolate diagnosed cases.
1 Introduction
Severe acute respiratory syndrome (SARS) is a new respiratory disease which was first identified in China’s southern province of Guangdong. SARS is not merely a local endemic disease: it poses a serious risk to the medical community, is a threat to international travelers, is having a substantial negative economic impact in parts of East Asia and is spreading world-wide. The serious danger SARS poses to the medical community is illustrated by the numerous cases of transmission to health-care workers. Startlingly, the man who awakened the world to the dangers of SARS, Dr. Carlo Urbani, succumbed to the disease. Cases of transmission between aircraft passengers are suspected, and relatively short visits to epidemic regions have resulted in infection. The most striking feature of SARS, however, has proven to be its ability to rapidly spread on a global scale. One man with SARS made flights: from Hong Kong to Münich to Barcelona to Frankfurt to London, back to Münich and Frankfurt before finally returning to Hong Kong [3]. Another individual, a -year-old airport worker, appears to have transmitted the disease to people [4]. Clearly, there is an unfortunate interaction between the incubation period of the virus, the widely distributed severity and infectiousness of SARS in different people and the speed and volume of passenger air travel. The adverse economic impact in parts of East Asia far exceeds the disruption of previous outbreaks of avian influenza, earning comparison with the 1998 financial market crisis in that part of the world [5, 6, 7]. Although the causative agent of SARS has been determined [8, 9], a detailed understanding of the causative virus’ pathogenticity and routes of transmission and the dynamics of the epidemic is still at a very early stage. It is uncertain how the virus is transmitted: by droplet or airborne transmission or person-to-person contact. The recent development of laboratory tests promises to improve the epidemiological situation somewhat [10].
SARS is a public health crisis on a scale rarely seen. The obvious question in such a crisis is, “can SARS be contained?” In this study, we report transmission parameters and epidemic dynamics from a model based on classes of people who are susceptible, exposed, infectious, diagnosed, and recovered (“SEIJR”) that includes the effect of patient isolation. Our model is consistent with the possibility of containment in Toronto, Ontario.
2 SARS epidemiology and related issues
SARS was first identified in November 2002 in the Guongdong Province of China [11]. By February , officials in Hong Kong reported their first cases of SARS and no later than March of this year the virus reached Canada [12]. As of April , Canada is the only location outside of Asia which has seen deaths as a result of SARS ( so far) [13]. U. S. health officials are currently investigating cases in states (Apri 17, 2003) [14].
An individual exposed to SARS may become infectious after an incubation period of days (or longer) [33] with days being most common [15]. Most infected individuals either recover, typically after to days, or suffer mortality or higher [16, 21, 35]. SARS appears to be most serious in people over age , especially those who have other medical problems such as heart or liver disease. Its symptoms are similar to pneumonia or other respiratory ailments and include a high fever ( C), shortness of breath, dry cough, headache, stiff or achy muscles, fatigue and diarrhea [17]. These symptoms, however, are not uniform. In the US, for example, the disease seems to be a milder one than in Asia [18]. The result has been that SARS was, and for the moment remains, a diagnosis of exclusion.
Presently, there is no treatment for SARS [19] and diagnostic tests are just becoming available [10]. The mortality rate is reported to be % or higher world-wide[21, 35]. Experts estimate that between and percent of people with SARS recover without medical intervention, while the condition of the remaining victims requires medical care [17]. As of April , , the World Health Organization (WHO) reported cases (a mixture of probable or suspected cases) in countries. victims are reported to have died [14].
Although researchers in the Erasmus Medical Center in Rotterdam recently demonstrated that a coronavirus (some of which produce common colds) is the causative agent of SARS, the mode of transmission still remains unknown [14]. The current hypothesis is that SARS is transmitted mainly by close person-to-person contact which may explain the relatively slow transmission scale. However, it could also be transmitted through contaminated objects, air or by other unknown ways [22]. It is also a mystery how the disease originated, whether in birds, pigs or other animals, nor is it known if the origin is rural or urban [23].
In this article, a simple model for SARS outbreaks is formulated (see [24]). The model is used in conjunction with global and local SARS data to estimate the initial growth rate of the SARS epidemic. These rates are used to estimate SARS’ basic reproductive number, , the classical epidemiological measure associated with the reproductive power of a disease. estimates the average number of secondary cases of infection generated by a typical infectious individual in a population of susceptibles [25] and hence, it is used to estimate the initial growth of a SARS outbreak. We estimate (using data from Ontario, Hong Kong and Singapore) that is about . This value is not too different from past estimates of for influenza (see [2]) despite the fact that superspreaders of SARS have been identified. In fact, the parameter values resulting on this , on our population-scaled model, can lead to extremely high levels of infection). We show, via simple extrapolation, that the estimated rate of growth is consistent with the reported date for the first cases of SARS in Hong Kong, however the first cases in Toronto may be several weeks earlier than the February 23 date of the first case reported by the Canadian Health Ministries [26]. Our best “rough” estimate for Toronto is that the first case occurred sometime around January 29th, and not later than February 28th. The data for Hong Kong are fitted by fixing the parameters , and based on estimates of the observed rates for the corresponding processes. The growth rate is estimated from observed “model-free” exponential growth in Singapore and Hong Hong. The average diagnostic rate and the measure of heterogeneity between the two susceptible classes and the effectiveness of patient isolation measures (related to ) are then varied to fit the initial data for Hong Kong and Singapore. To model the data in Toronto, we must postulate that the parameters describing the rate of diagnosis () and isolation () in the Canadian outbreak changed radically on March . Two hospitals in Toronto were closed about that time: Scarborough Grace Hospital on March and York Central Hospital on March [20]. The remainder of this article is organized as follows: Section introduces the basic model and gives a formula for the basic reproductive number ; Section describes the results of simulations and connections to data; and, Section collects our final thoughts.
3 SARS’ Transmission Model
U. S. data is limited and sparsely distributed [27, 28] while the quality of China’s data is hard to evaluate [29]. On the other hand, there appears to be enough data for Toronto [26], Singapore and Hong Kong [30] to make limited preliminary predictions using a model that includes the effects of suspected mechanisms for the spread of SARS. Limited data and inconclusive epidemiological information place severe restrictions on efforts to model the global spread of the SARS etiological agent.
Thus, we model single outbreaks, ignoring demographic processes other than the impact of SARS on survival. The model is applied to data from Toronto, Hong Kong and Singapore. Because the outbreak dynamics in Singapore and Hong Kong are different from those in Toronto, some of the results may only be indicative of what is happening in those regions of the world (in particular our parameters and may change). The situation must be re-evaluated frequently as SARS continues its travels around the world.
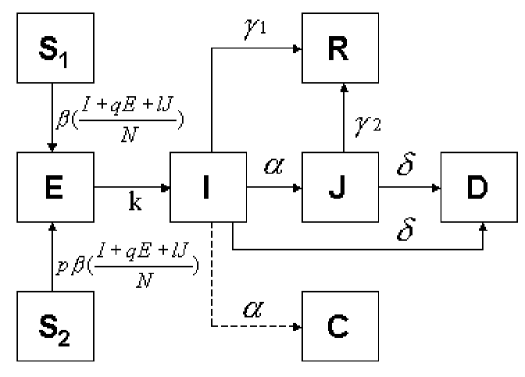
Here we describe a model that incorporates, in a rather crude way, some of the important characteristics suggested in the literature (unequal susceptibility, symptomatic and asymptomatic individuals, mode of transmission, superspreaders, etc.) [22, 31, 32, 27]. The goal is to use the results for single outbreaks as a first step in our efforts to gauge the global impact of SARS. Hence, we focus on three “closed” populations (Southern Ontario (Toronto), Singapore and Hong Kong) and postulate differences in the degree of susceptibility to SARS [4, 17]. These differences may be due to variations in contact rates, age-dependent susceptibility or “unknown” genetic factors. This last assumption is handled (in a rather crude and arbitrary way) via the introduction of two distinct susceptible classes: , the most susceptible, and , less so. Initially, and where is the proportion of the population size that is initially at higher risk of SARS infection. The parameter is a measure of reduced susceptibility to SARS in class [17, 4]. (“exposed”) denotes the class composed of asymptomatic, possibly infectious (at least some of the time) individuals. Typically, it takes some time before asymptomatic infected individuals become infectious. The possibility of limited transmission from class is included, in a rather crude way, via the parameter (see Table ). The class denotes infected, symptomatic, infectious, and undiagnosed individuals. -individuals move into the diagnosed class at the rate . Individuals recover at the rates ( class) and ( class). The rate denotes SARS’ disease-induced mortality. The classes is included to keep track of the cumulative number of diagnosed and recovered, respectively. Furthermore, it is assumed that diagnosed individuals are handled with care. Hence, they might not be (effectively) as infectious as those who have not been diagnosed (if is small). The parameter takes into account their reduced impact on the transmission process (small represents effective measures taken to isolate diagnosed cases and visa versa). Table includes parameters’ definitions and the initial values used. Our SARS epidemiological model is given by the following nonlinear system of differential equations:
| (1) |
which is refered to as “SEIJR,” after the variables used to name the
classes.
The values of and are not known and are fixed arbitrarily while and are varied and optimized to fit the existing data (least-squares criterion) for Hong Kong, Singapore and Toronto. We did not explored the sensitivity of the model to variations in and because they are not known and cannot be controlled. All other parameters were roughly estimated from data [26, 30] and current literature [22, 33, 15, 16]. In particular, the transmission rate is calculated from the dominant root of the third order equation obtained from the linearization around the disease-free equilibrium [25]. The parameters and were allowed to vary when fitting the data for each location (Singapore, Hong Kong and Toronto). Some restrictions apply, for example, the value of . We also require that , a statement that members of the diagnosed class recover at the same rate as members of the undiagnosed class . has been reported to be between and days [21, 16]. From the second generator approach [25], we obtain the following expression for the basic reproductive number:
| (2) |
which can be easily given an epidemiological interpretation. The use of parameters estimated from Hong Kong (Table ) gives a values of (Hong Kong) and (Toronto, assuming exponential growth) and (Singapore).
4 Simulation Results
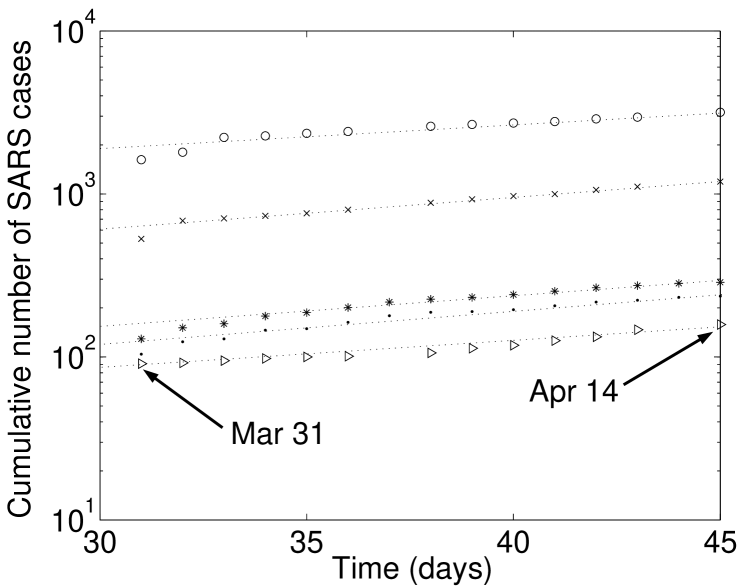
Initial rates of growth for SARS outbreaks in different parts of the world (see Figure 2) are computed using the data provided by WHO [30] and the Canadian Ministry of Health [26]. These rates are computed exclusively from the number of cases reported between March and April . The values obtained are (world data), (Hong Kong), (Canada), (Toronto) and (Singapore).
For our numerical simulations, we start with an infectious individual
(not yet diagnosed, ) and crude estimates for the
start of SARS outbreaks
() are obtained from the formula , which assumes initial exponential
growth (, the estimated “model-free” rate of growth from the time
series of the cumulative number of SARS cases).
Results for Toronto, Hong Kong, Singapore and aggregated
world data are shown in Table
. The estimated “world” start of the outbreak is
November , a date consistent with the
fact that the first SARS case was detected in Guangdong, China in
November [11]. These dates are used as the starting time of the
respective outbreaks.
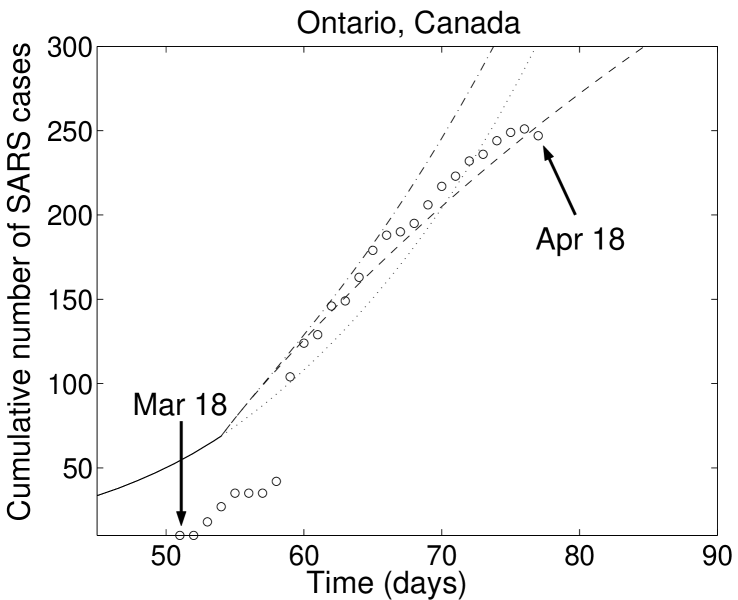
For the case of the Province of Ontario, Canada the total population is approximately million. We assume that the population at major risk of SARS infection lives in Ontario’s southern part (particularly Toronto), and is approximately of the total population ( in our model). It is worth pointing out that this value of is not critical (that is, the most sensitive) in the model. The “model-free” approximately exponential growth rates for the various regions of the world are roughly similar except for Canada from March 31st (day 61) to April 6th (beginning the day of the jump in the number of reported Canadian cases), the number of diagnosed cases grew , where is measured in days. This rate is substantially higher than elsewhere in the world. In the subsequent week (beginning April 7th, day 68) the number of probable or suspected Canadian cases rapidly rolls over to a smaller growth rate not too far from the rest of the world. We conclude, based on the coincidence of the Canadian hospital closures, the jump in the reported number of Canadian SARS cases on March 31st and the rapid rise in recognized cases in the following week, that Canadian doctors were rapidly diagnosing pre-existing cases of SARS (in either class or on March 26th). If we make the assumption that the fundamental disease spreading parameters other than and are roughly constant throughout the world prior to March 26th, we can reach two important conclusions. Beginning on March 26th, in Toronto:
-
•
changed from a number days to days, and
-
•
changed from an uncertain and relatively large value to .
If we assume that the fundamental growth rate is essentially
constant from one region of the world to another, it is difficult for
our model to produce growth rates well above the world average,
except as a transient response to differences in diagnostic rate
(due to delays in response or change in policy). Similarly,
the SEIJR model requires fairly small values of
to achieve a rapid roll-over in the growth rate of recognized
cases. The parametric details of how a “second” initial condition
for Toronto on March 26th is generated
do not affect the qualitative aspect of this argument: the Canadian
data prior to March 31st
(the day of the large jump) are probably not as meaningful as data
after
that date, and hence only bound the model from below prior to March
26th. The essential aspect of this before-and-after hospital closure
argument is that there were substantially more undiagnosed people in
classes and than in class on March 26th. This is a
reasonable assumption
given that the number of cases reported by Canadian officials more
than
double from March 30th to March 31st.
The introduction of behavioral changes starting on March (
days),alters the fate of the disease in a dramatic
fashion (see Table ).
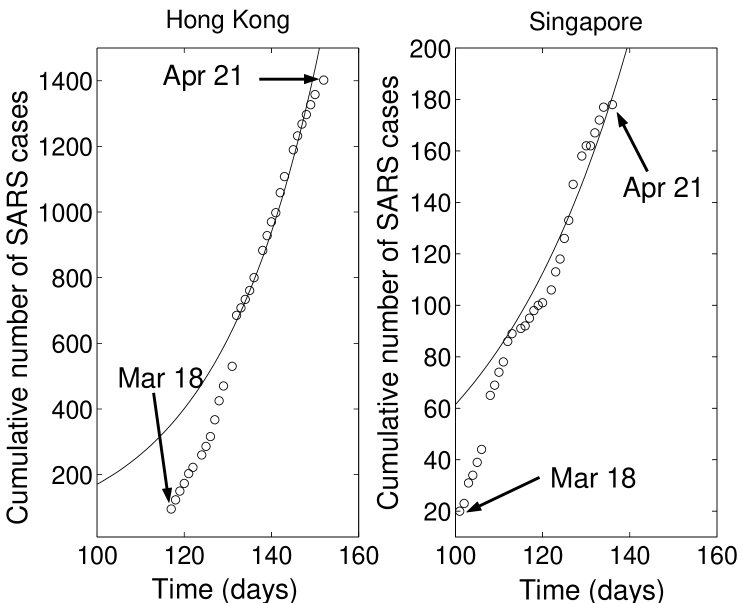
Fitting the model to the Hong Kong and Singapore data is carried out in a similar fashion with , (Hong Kong has about million inhabitants, Singapore million). The estimated transmission rate from Hong Kong data is and for Singapore . Both Hong Kong and Singapore’s data are fit with the value . Hong Kong and Singapore’s measure of contact between diagnosed SARS cases and susceptibles are and , respectively (see Figure 4). Even though there is some heterogeneity in the parameters for Hong Kong and Singapore, they provide an important calibration of our model. Their values for and are roughly consistent with each other, indicating that the difference with Toronto is significant within our model, and pointing to the joint importance of rapid diagnosis and good isolation of diagnosed patients in controlling an outbreak. While there is some indication in the data from Hong Kong of a possible slowing of the outbreak, we did not attempt to analyze the slowing or assess its significance.
5 Conclusions
A simple model that can capture the effect of average infectiousness in a heterogeneous population and the effect of isolating diagnosed patients has been introduced to explore the role of patient isolation and diagnostic rate in controlling a SARS outbreak. By examining two cases with relatively clean exponential growth curves for the number of recognized cases, we are able to calibrate a SEIJR model with parameters (SARS’ diagnostic rate) and (isolation effectiveness). We then use our SEIJR model to examine the non-exponential dynamics of the Toronto outbreak. Two features of the Toronto data, the steep increase in the number of recognized cases after March 31st and rapid slowing in the growth of new recognized cases, robustly constrained the SEIJR model by requiring that and days-1.
The model is also used to look at the impact of
drastic control measures (isolation). The fitting of
data shows that the initial rates of SARS’ growth are
quite similar in most regions leading to estimates of
between and despite the recent identification of
superspreaders. Model simulations are fitted to SARS reported data
for the province of Ontario, Hong Kong and Singapore. Good fits are
obtained
for reasonable values of , the rate of identification of SARS
infections; “reasonable” values of the control parameters (a
measure of isolation); possible values of , a
crude measure of reduced susceptibility (due to genetic factors,
age or reduced contact rates); a crude measure of the
relative
degree of infectiousness of asymptomatic individuals; possible values
of a measure of initial levels of population
heterogeneity; and, reasonable values of N the effective
population size. It is worth noticing that for values of larger
than the predictions (proportion of cases at the end of the
outbreak, etc.) are roughly the same. The introduction of
behavioral changes that follow the identification of the first case
(reduce values of at the time of the identification and moving
aggressively to identify cases of SARS by increasing )
result in a dramatic reduction in the total number of cases and on
mortality in Toronto.
Given the fact that SARS appears to kill between three and seven
percent of infected (diagnosed) cases ([35]), it seems quite
appropriate to
isolate diagnosed people. Although we do not examine the effect of
quarantine by varying , it seems intuitive that quarantining
those who came into close contact
with positively diagnosed individuals will reduce the total number of
cases.
Model results and simple estimates suggest that local outbreaks may follow similar patterns. Furthermore, the use of relative extreme isolation measures in conjunction with rapid diagnosis has strong impact on the local dynamics (Toronto’s situation). However, if SARS has shown us anything it is that “undetected” and “unchecked” local disease dynamics can rapidly become a global issue.
The research on this article used the latest data available (April for Canada and April for Hong Kong and Singapore). Recent disclosures [34] reaffirm the importance of carrying out the analysis excluding data from China. We have redone the analysis including the data collected up to April and, our conclusions, remain the same. Current data seem to support higher values for SARS induced mortality rates [35]. However, our model is most sensitive to the parameters (effectiveness of isolation) and () diagnostic rate. It is not as sensitive to changes in . In fact, the consideration of a mortality () rather than reduces the number of cases by about . In Toronto, we have estimated diagnosed cases with ( and after March 26th). Perfect isolation after March 26th, () reduces this number to diagnosed cases. The assumption of homogenous mixing implies that our model is likely to overestimate the size of the outbreak. Hence, the situation in Toronto seems to support the view that this outbreak is being contained. Obviously, the case of the crude model (by design) cannot handle high levels of variability (an stochastic model would be desirable). This possibility is tested (as it is often done in deterministic models) by looking at the sensitivity of the model to parameters ( and being the most critical). Such sensitivity analyses can also help “estimate” the variability in .
6 Acknowledgments
We thank Penny J. Hitchcock, Norman L. Johnson, Krastan B. Blagoev, and the T-11 epidemiology discussion group at Los Alamos National Laboratory and Hans Frauenfelder for enhancing our ability to carry out this research. We also thank Fred Brauer, Simon Levin, James Watmough (who reconfirmed our value of by the method [25]), Carlos W. Castillo-Garsow, and Miriam Nuno for their recent comments. This research has been supported through the Center for Nonlinear Studies at Los Alamos National Lab under Department of Energy contract W-7405-ENG-36 and partially supported by NSF, NSA and Sloan Foundation grants to Carlos Castillo-Chavez. During the final stages of preparation, it came to our attention that Prof. Roy Anderson is examining similar questions about SARS’ outbreak dynamics.
References
- [1] R. M. Anderson and R. M. May, Infectious Diseases of Humans, Oxford University Press (1991).
- [2] C. Castillo-Chavez, H. W. Hethcote, V. Andreasen, S. A. Levin, W. M. Liu. Epidemiological models with age structure, proportionate mixing, and cross-immunity, J. Math. Biol. 27, 233-258 (1989).
- [3] Bradsher, Keith. “Carrier of SARS Made Flights Before Treatment.” The New York Times. April 11, 2003.
- [4] McNeil, Donald G. and Lawrence K. Altman. “How One Person Can Fu el an Epidemic.” The New York Times. April 15, 2003.
- [5] Schoen, John W. “SARS business impact spreading.” MSN B news service. April 2, 2003.
- [6] “Record SARS deaths in Hong Kong.” MSNBC news service . Website: http://www.msnbc.com/news/885653.asp. April 15, 2003.
- [7] “SARS hits airlines, Qantas cuts jobs.” MSNBC News Service. Website: http://www.msnbc.com/news/897719.asp. April 9, 2003.
- [8] C. Drosten, et al., “Identification of a novel coronavirus in patients with severe acute respiratory syndrome,” New England J. Med. (2003).
- [9] T. G. Ksiazek, et al., “A novel coronavirus associated with severe acute respiratory syndrome,” New England J. Med. (2003).
- [10] J. L. Gerberding, “Faster . . . but Fast Enough?” New England J. Med. (2003).
- [11] Pomfret, John. “Doctor Says Health Ministry Lied About Disease.” The Washington Post. April 9, 2003.
- [12] “Time line.” MSNBC News Service. Website: http://www.m snbc.com/news/885653.asp.
- [13] Record SARS deaths in Hong Kong; MSNBC News Service (April , ).
- [14] Stein, Rob. “Scientists Identify Cause of Outbreak.” The Washington Post. April 17, 2003.
- [15] “IAFF issues SARS guidelines for first responders.” FIRE CHIEF magazine. Website: http://www.firechief.com. April 9, 2003.
- [16] “Symptoms and treatment of SARS.” C Health. Website: http://chealth.canoe.ca/
- [17] Stein, Rob. “FAQ on SARS.” The Washington Post. website : http://www.washingtonpost.com/wp-dyn/articles/A11849-2003Apr2.html.
- [18] Sloan, Rennie. “Will SARS wreak havoc here?.” MSNBC N ew Service. Website: http://www.msnbc.com/news/894251.asp. April 3, 2003.
- [19] Kalb, Claudia. “Tracking SARS.” Newsweek. April 28, 2003.
- [20] Private Communication, April 21st, 2003.
- [21] International Society for Infectious Diseases. ProMED-mail. Archive Number 20030325.0744. SARS - WORLDWIDE (March 25, 2003).
- [22] CDC (Centers for Disease Control): Basic Information About SARS. Website: http://www.cdc.gov/ncidod/sars/factsheet.htm (April 16th, 2003).
- [23] Bradsher, Keith. “SARS Is Here to Stay, Hong Kong and Singapore T ell Citizens.” The New York Times. April 8, 2003.
- [24] F. Brauer, C. Castillo-Chavez, Mathematical Models in Population Biology and Epidemiology, Springer Verlag New York (2000).
- [25] O. Diekmann, J. A. P. Heesterbeek, Mathematical Epidemiology of Infectious Diseases: Model Building, Analysis and Interpretation, Wiley (2000).
- [26] Canadian Ministry of Health. Summary of Severe Acute Respiratory Syndrome (SARS) Cases: Canada and International. http://www.hc-sc.gc.ca/pphb-dgspsp/sars-sras/eu-ae/
- [27] International Society for Infectious Diseases. ProMED-mail. Archive Number 20030416.0930. SARS - WORLDWIDE (April 16th, 2003).
- [28] Coomer, John. “Suspected SARS cases near 150 in U.S.“ The Reporter. Vanderbuilt Medical Center. April 11, 2003.
- [29] Pomfret, John. “Underreporting, Secrecy Fuel SARS in B eijing, WHO says.” The Washington Post. April 17, 2003.
- [30] World Health Organization. Cumulative Number of Reported Probable Cases of Severe Acute Respiratory Syndrome (SARS). http://www.who.int/csr/sarscountry/en/
- [31] CDC (Centers for Disease Control): Isolation and Quarantine. Website: http://www.cdc.gov/ncidod/sars/isolationquarantine.htm (April 3, 2003).
- [32] CDC (Centers for Disease Control): Information For Close Contacts Of SARS Patients . Website: http://www.cdc.gov/ncidod/sars/factsheetcc.htm (April 16th, 2003).
- [33] CDC (Centers for Disease Control): SARS: Frequently asked questions. Website: http://www.cdc.gov/ncidod/sars/faq.htm. April 16, 2003.
- [34] Pomfret, John. “China Seals Hospitals to Fight SARS.” The Washington Post. April 25, 2003.
- [35] “Ministers may review SARS status.” BBC News. http://news.bbc.co.uk/1/hi/health/2979623.stm (April 27, 2003).
7 Tables
Table 1. Parameter definitions and values that fit the
cumulative number of cases in class (“diagnosed”) for Hong Kong.
These parameters are used
to compute the basic reproductive number .
Parameter
Definition
Value
Transmission rate per day
relative measure of infectiousness for the asymptomatic class
relative measure of reduced risk among diagnosed SARS cases
reduction in risk of SARS infection for class
rate of progression to the infectious state per day
rate of progression from infective to diagnosed per day
rate at which individuals in the infectious class
recover per day
rate at which diagnosed individuals recover per day
SARS-induced mortality per day
Initial proportion of the popualtion at higher risk of SARS
infection
0.4
Table 2. Estimated starting times of the SARS outbreak.
Country
Estimated start of the outbreak
Canada
February 1st
Hong Kong
November 20th
Singapore
December 6th
World data
November 5th
Table 3. Long-time model results for Ontario, Canada,
assuming various changes in behavior on March 26th, 2003.
Infected with SARS
Diagnosed with SARS
8 Figures